
The hourly chart in last analysis expected a pullback for the short term, which is currently unfolding.
Summary: The target is now at 1,431. Further and substantial confidence in an upwards trend may be had now if price makes a new high above 1,333.84.
For the short term, it is still unclear if lows will be tested again or not; classic technical analysis is giving mixed signals. If lows are tested again, then a target may be only just below 1,300. The Elliott wave target at 1,295 may be a little too low.
Always trade with stops to protect your account. Risk only 1-5% of equity on any one trade.
New updates to this analysis are in bold.
Grand SuperCycle analysis is here.
Last in-depth historic analysis with monthly and several weekly charts is here, video is here.
There are multiple wave counts at this time at the weekly and monthly chart levels. In order to make this analysis manageable and accessible only two will be published on a daily basis, one bullish and one bearish. This does not mean the other possibilities may not be correct, only that publication of them all each day is too much to digest. At this stage, they do not diverge from the two possibilities below.
BULLISH ELLIOTT WAVE COUNT
FIRST WEEKLY CHART
Click chart to enlarge.
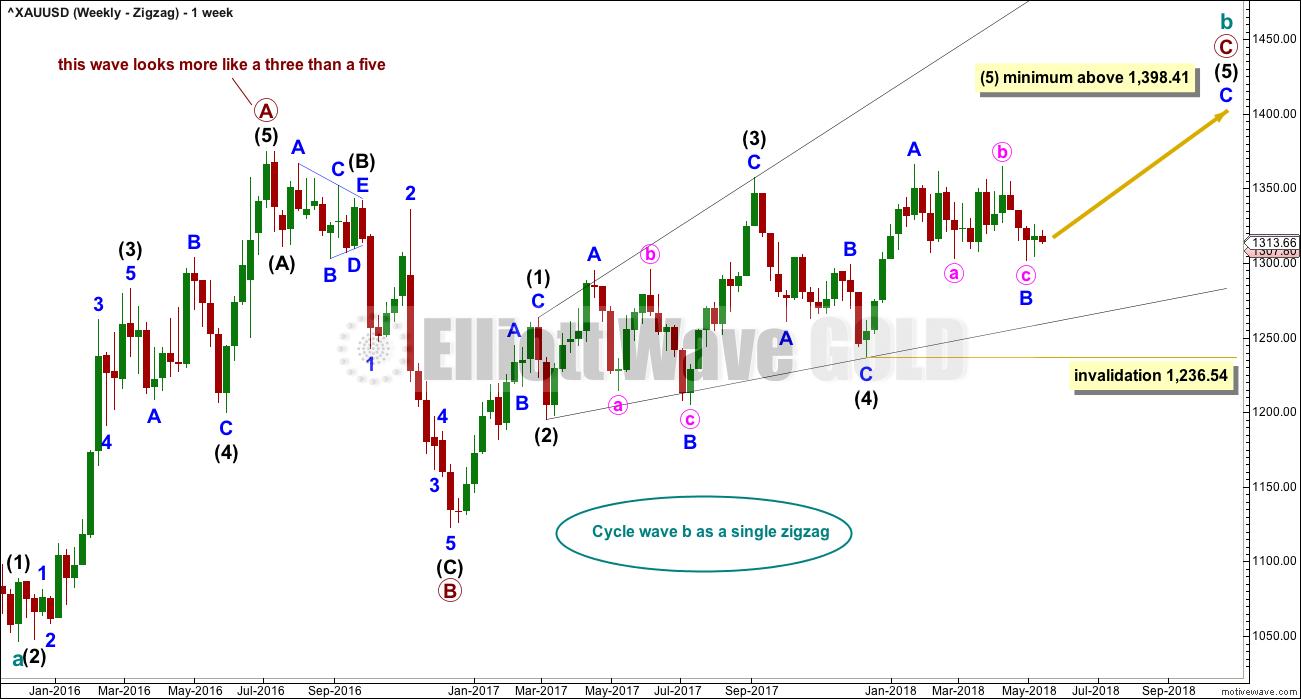
Cycle wave b may be a single zigzag. Zigzags subdivide 5-3-5. Primary wave C must subdivide as a five wave structure and may be either an impulse or an ending diagonal. Overlapping at this stage indicates an ending diagonal.
Within an ending diagonal, all sub-waves must subdivide as zigzags. Intermediate wave (4) must overlap into intermediate wave (1) price territory. This diagonal is expanding: intermediate wave (3) is longer than intermediate wave (1) and intermediate wave (4) is longer than intermediate wave (2). Intermediate wave (5) must be longer than intermediate wave (3), so it must end above 1,398.41 where it would reach equality in length with intermediate wave (3).
Within the final zigzag of intermediate wave (5), minor wave B may not move beyond the start of minor wave A below 1,236.54. However, if it were now to turn out to be relatively deep, it should not get too close to this invalidation point as the lower (2)-(4) trend line should provide strong support. Diagonals normally adhere very well to their trend lines.
Within the diagonal of primary wave C, each sub-wave is extending in price and so may also do so in time. Within each zigzag, minor wave B may exhibit alternation in structure and may show an increased duration.
Within intermediate wave (1), minor wave B was a triangle lasting 11 days. Within intermediate wave (3), minor wave B was a regular flat lasting 60 days. Intermediate wave (5) is expected to be longer in price than intermediate wave (3), and it may also be longer in duration, and so minor wave B within it may also be longer in duration. If minor wave B is over at the last low, it would have lasted 68 days.
This first weekly chart sees the upwards wave labelled primary wave A as a five wave structure. It must be acknowledged that this upwards wave looks better as a three than it does as a five. The fifth weekly chart below will consider the possibility that it was a three.
FIRST DAILY CHART
Click chart to enlarge.
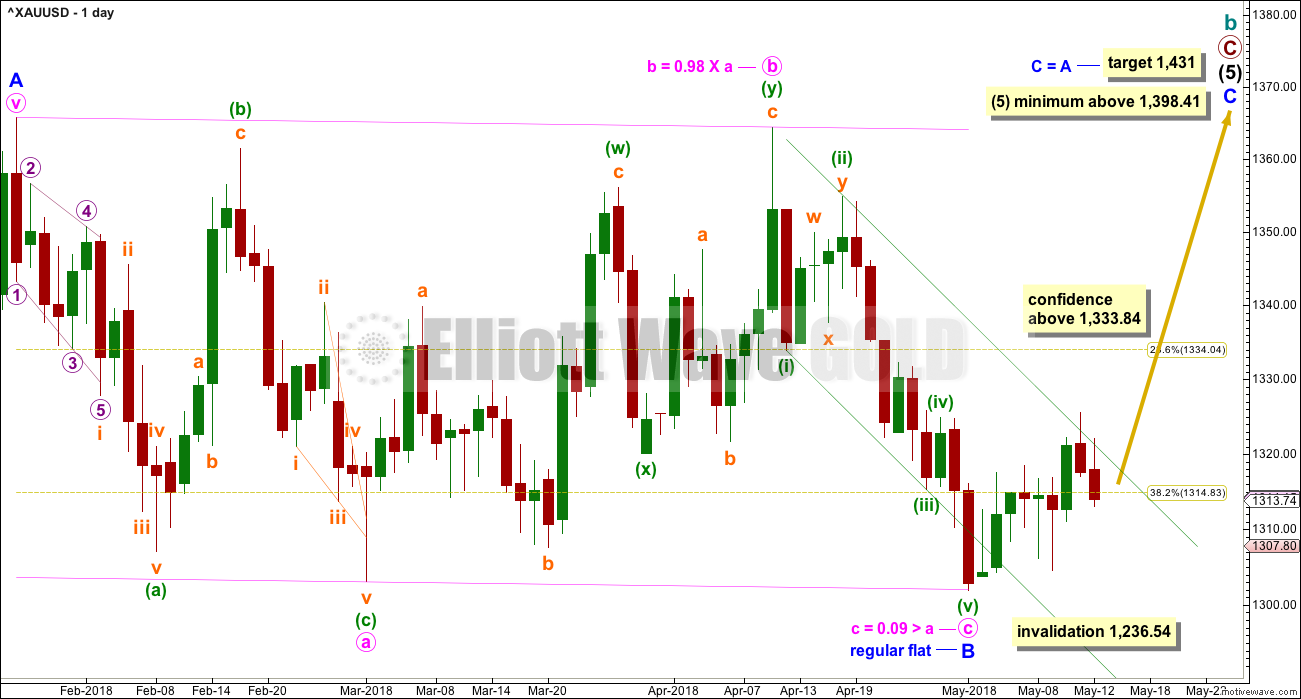
Minor wave B may be a complete single regular flat correction. Within the flat, minute wave a is a three, a single zigzag, and minute wave b is a three, a double zigzag, and minute wave c is a five that has moved price slightly below the end of minute wave a. There is a very close Fibonacci ratio of equality between minute waves a and c.
Regular flats normally fit very well into parallel channels. Minute wave c has found support almost exactly at the lower edge of this channel. This gives the flat correction the right look.
HOURLY CHART
Click chart to enlarge.
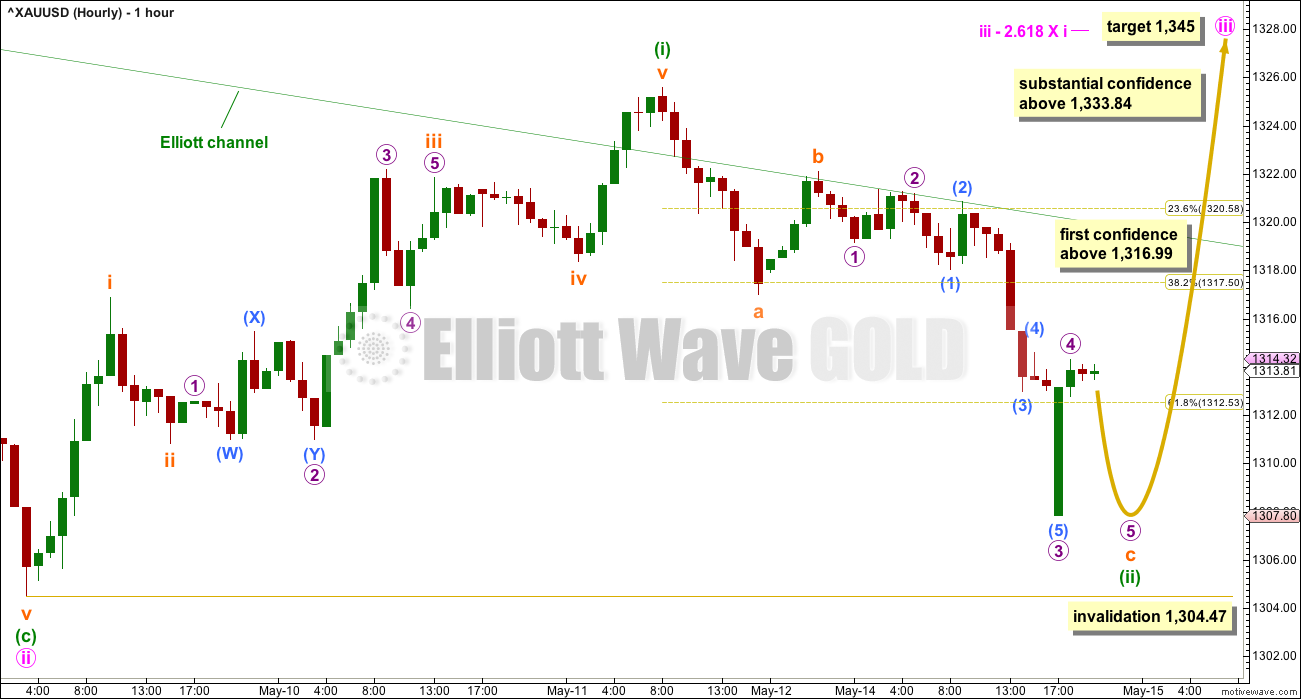
Minute wave iii may only subdivide as an impulse, and within it minuette wave (i) may be complete.
Minuette wave (ii) may be over at today’s low, or it may need one more small fifth wave to complete it. Minuette wave (ii) may not move beyond the start of minuette wave (i) below 1,304.47.
When minuette wave (ii) is complete, then the power of a third wave should be able to again breach the upper edge of the green Elliott channel and remain above it.
FIRST DAILY CHART – ALTERNATE
Click chart to enlarge.
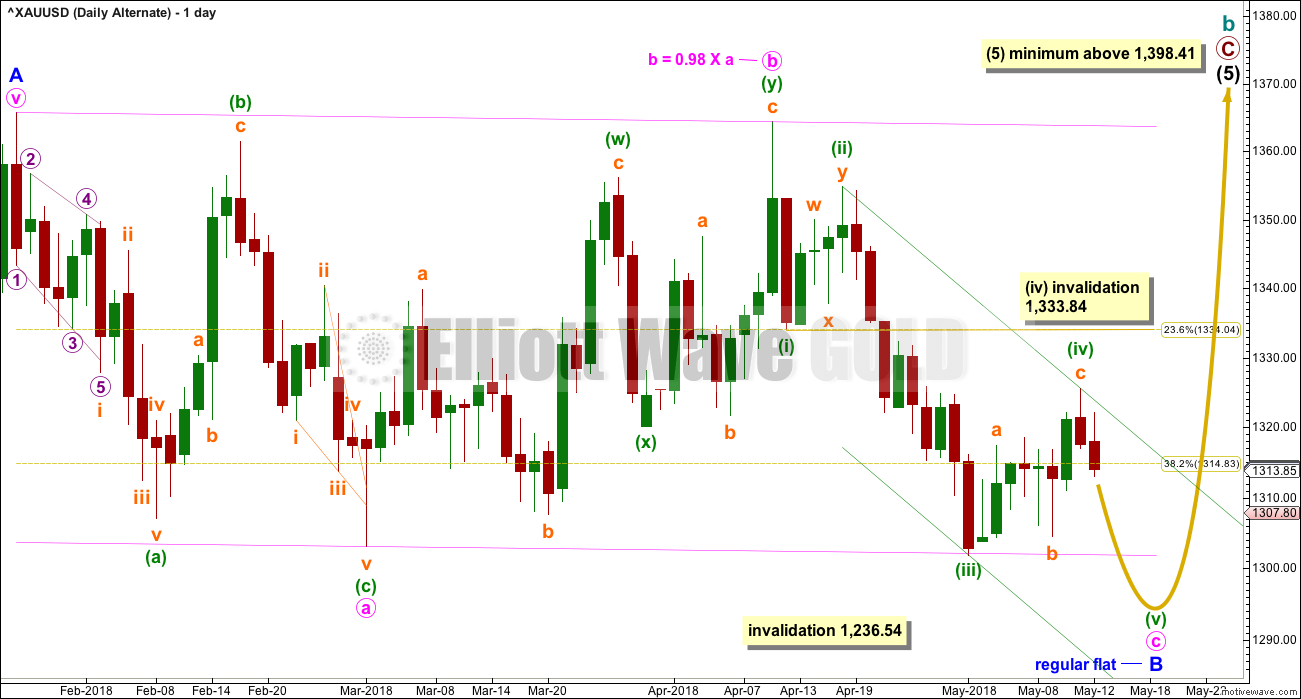
It is possible that the impulse for minute wave c is incomplete. There is a little disproportion between the corrections of minuette waves (ii) and (iv). Minuette wave (ii) subdivides as a double zigzag and minuette wave (iv) as a single zigzag, so there is some alternation in structure.
Minute wave c may end with a small overshoot of the lower pink trend line. Strong support is still in the zone about 1,300 to 1,310, so not much if any movement below this zone would be expected for this wave count.
Minuette wave (iv) has breached a channel drawn using Elliott’s first technique. The channel is redrawn using Elliott’s second technique.
Minuette wave (iv) may not move into minuette wave (i) price territory above 1,333.84.
This wave count may be discarded prior to invalidation if upwards movement continues and has support from volume.
HOURLY CHART
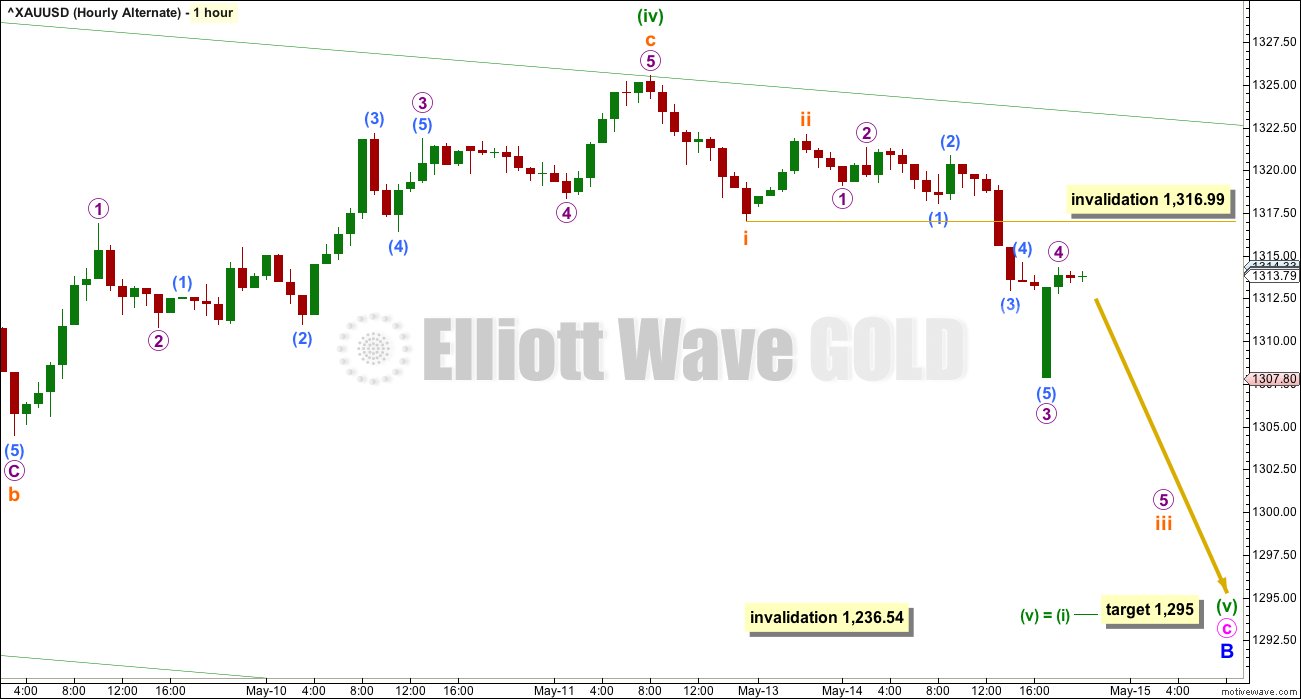
Click chart to enlarge.
Minuette wave (v) downwards may be subdividing as an impulse, and within it subminuette waves i and ii may be complete.
Subminuette wave iii may only subdivide as an impulse, and it may be incomplete.
Subminuette wave iv may not move into subminuette wave i price territory above 1,316.99.
BEARISH ELLIOTT WAVE COUNT
FIFTH WEEKLY CHART
Click chart to enlarge.
There were five weekly charts published in the last historic analysis. This fifth weekly chart is the most immediately bearish wave count, so this is published as a bearish possibility.
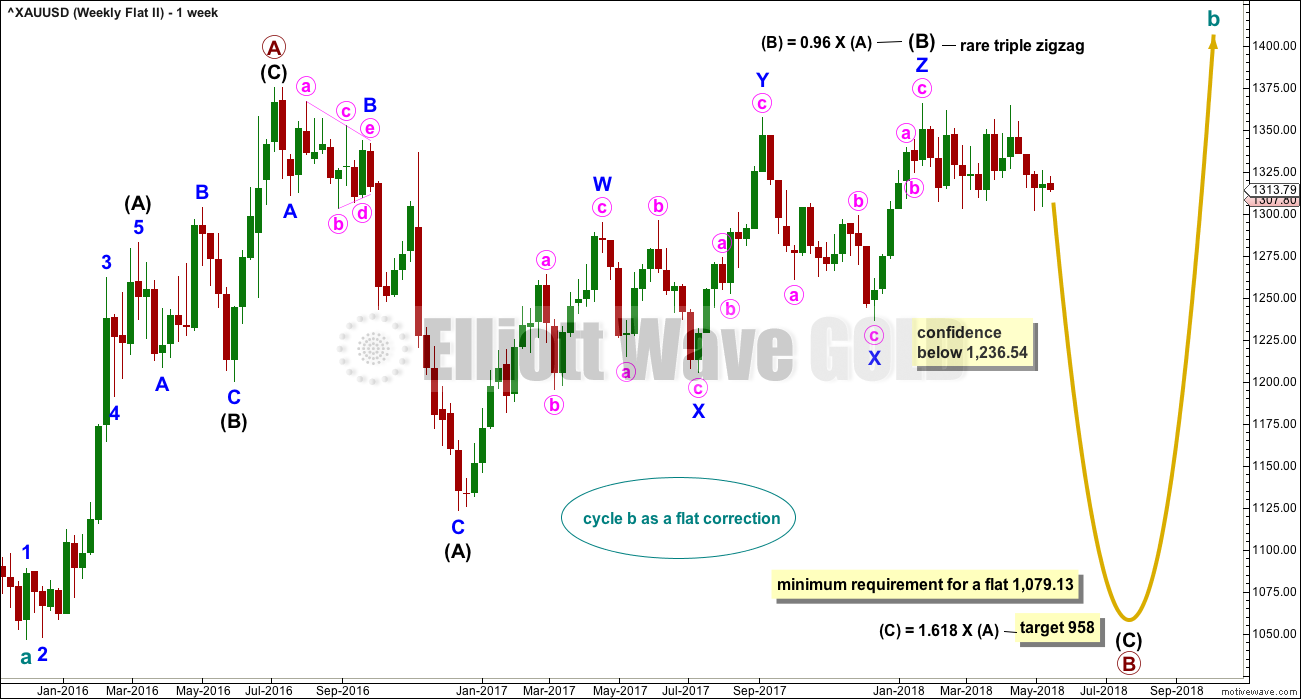
This fifth weekly chart sees cycle wave b as a flat correction.
If cycle wave b is a flat correction, then within it primary wave B must retrace a minimum 0.9 length of primary wave A at 1,079.13 or below. The most common length of B waves within flats is from 1 to 1.38 times the length of the A wave. The target calculated would see primary wave B end within this range.
Primary wave B may be subdividing as a regular flat correction, and within it both intermediate waves (A) and (B) subdivide as three wave structures. Intermediate wave (B) fits as a triple zigzag.
I have only seen two triple zigzags before during my 10 years of daily Elliott wave analysis. If this wave count turns out to be correct, this would be the third. The rarity of this structure is identified on the chart.
FIFTH DAILY CHART
Click chart to enlarge.
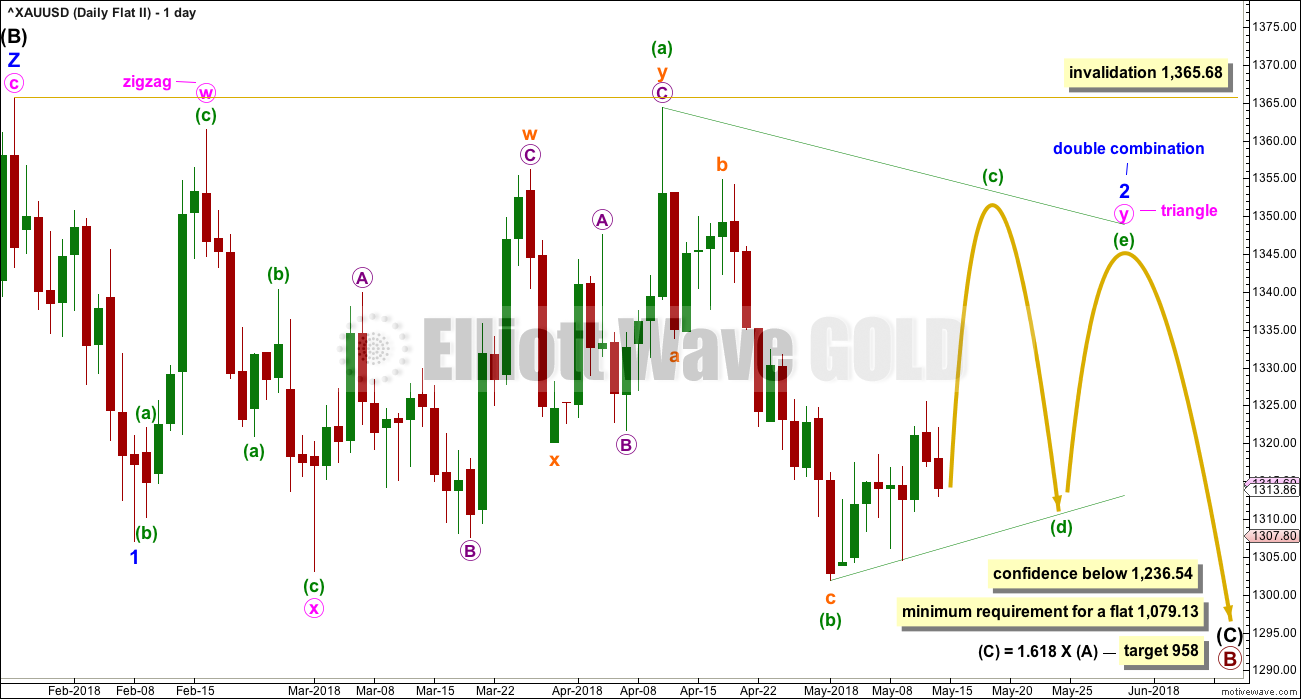
Minor wave 1 may have been a relatively brief impulse over at the low of the 8th of February. Thereafter, minor wave 2 may be an incomplete double combination.
The first structure in the double may be a zigzag labelled minute wave w. The double may be joined by a three in the opposite direction, a zigzag labelled minute wave x. The second structure in the double may be an incomplete running triangle labelled minute wave y. This structure may yet take some weeks to complete. In my experience a double combination with a triangle for minute wave y is not very common. This reduces the probability of this wave count, but it remains valid.
This wave count is a good solution for this bearish wave count. All subdivisions fit and there are no rare structures so far within intermediate wave (C).
TECHNICAL ANALYSIS
WEEKLY CHART
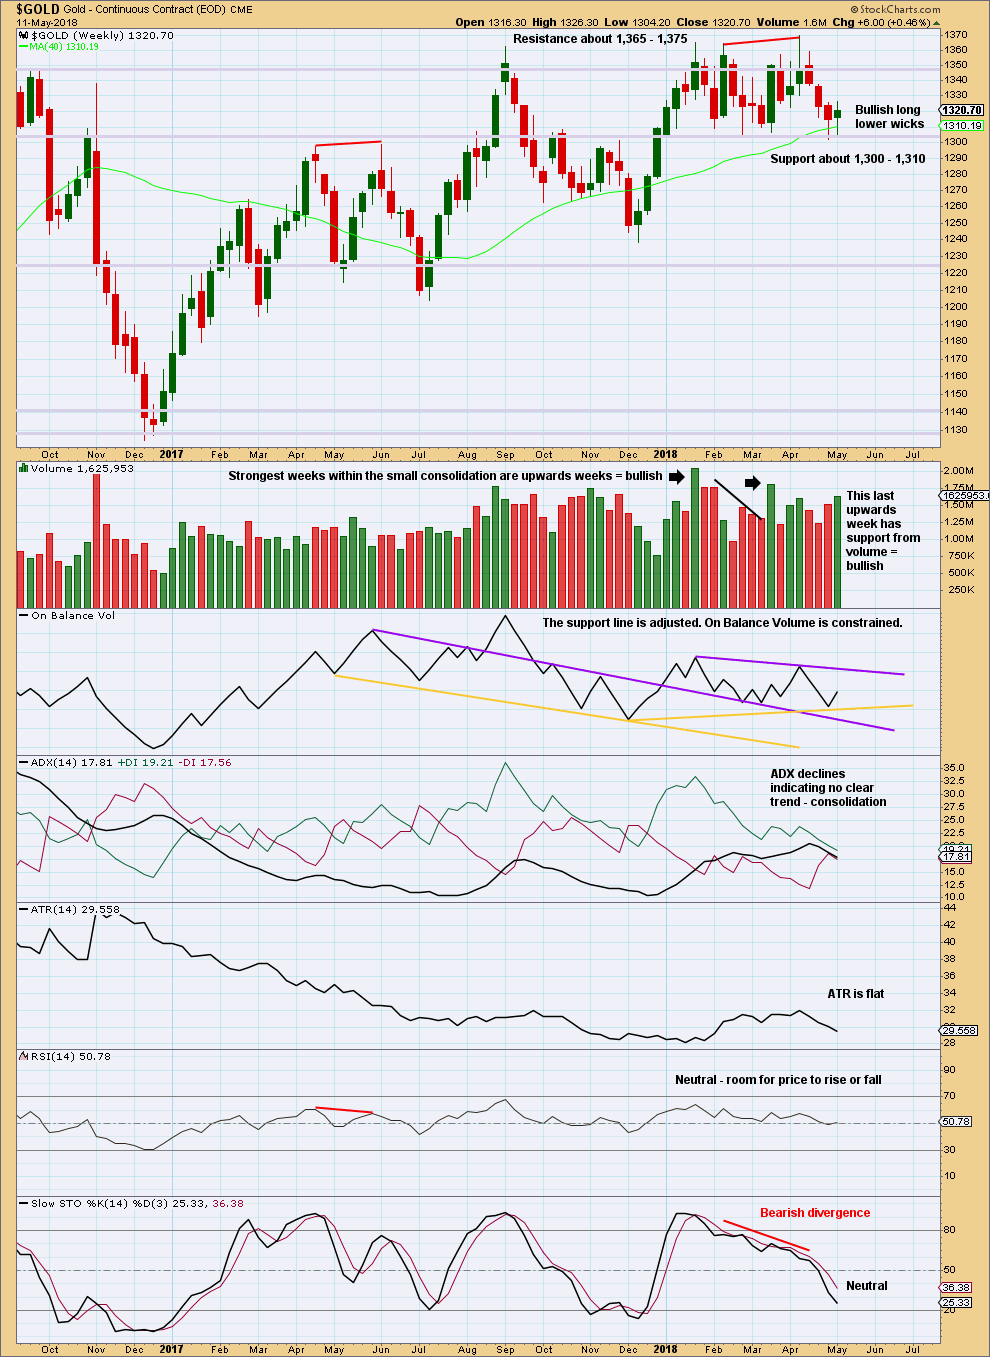
Click chart to enlarge. Chart courtesy of StockCharts.com.
Gold is within a small consolidation with resistance about 1,365 to (final) 1,375 and strong support about 1,310 to 1,305. Volume suggests an upwards breakout is more likely than downwards.
Last week’s candlestick has support from volume, which is bullish.
Gold looks reasonably bullish at the weekly chart level.
DAILY CHART
Click chart to enlarge. Chart courtesy of StockCharts.com.
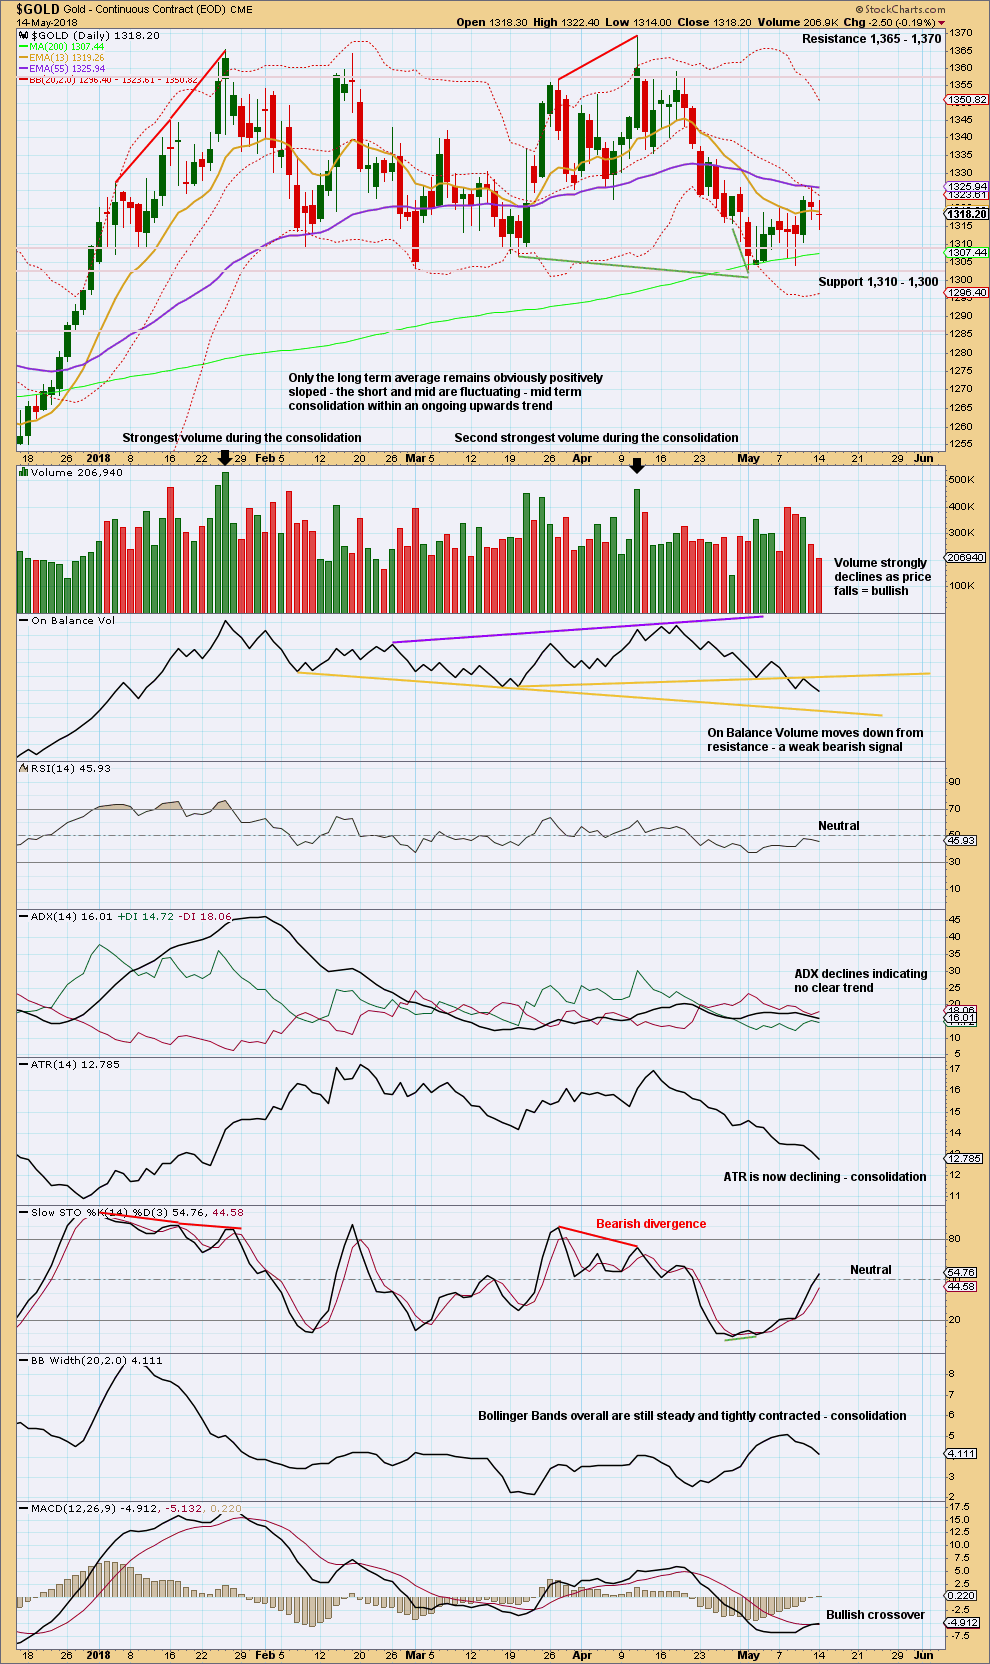
Gold is within a consolidation that began back on about the 3rd of January. This consolidation is delineated by resistance about 1,360 to 1,365 and support about 1,310 to 1,300. It is the upwards days of the 15th of January and the 11th of April that have strongest volume. This strongly suggests an upwards breakout may be more likely than downwards.
Price has found support. Bullish divergence with Stochastics while it is oversold is clear. With a few long lower wicks and support about the 200 day moving average, it looks like Gold has found a low.
Of the last nine sessions since the last low, it is upwards days that have the largest range but downwards days that have most support from volume. This gives mixed signals; it is still unclear of lows will be tested again or not.
It is possible that lows may again be tested, but expect very strong support in the zone 1,310 – 1,300.
GDX WEEKLY CHART
Click chart to enlarge. Chart courtesy of StockCharts.com.
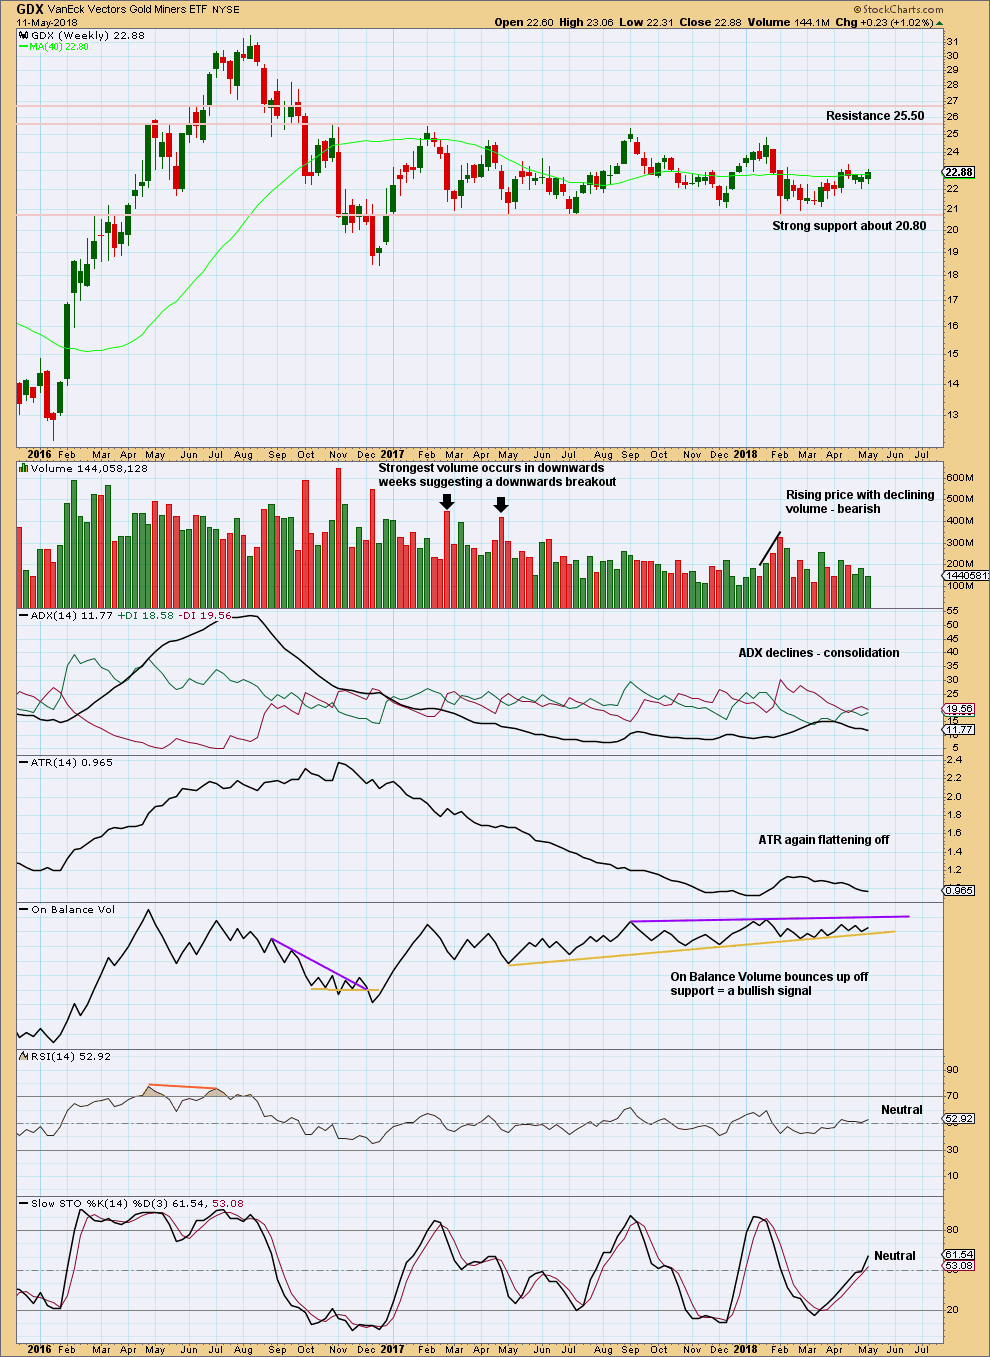
Support about 20.80 has been tested about eight times and so far has held. The more often a support area is tested and holds, the more technical significance it has.
In the first instance, expect this area to continue to provide support. Only a strong downwards day, closing below support and preferably with some increase in volume, would constitute a downwards breakout from the consolidation that GDX has been in for a year now.
Resistance is about 25.50. Only a strong upwards day, closing above resistance and with support from volume, would constitute an upwards breakout.
Overall, a slow upwards swing may be underway. Do not expect it to move in a straight line; it may have downwards weeks within it.
The short term volume profile remains bearish, but this week On Balance Volume gives a bullish signal.
GDX DAILY CHART
Click chart to enlarge. Chart courtesy of StockCharts.com.
On trading triangles from Dhalquist and Kirkpatrick, page 319:
“The ideal situation for trading triangles is a definite breakout, a high trading range within the triangle, an upward-sloping volume trend during the formation of the triangle, and especially a gap on the breakout. These patterns seem to work better with small-cap stocks in a rising market.
Although triangles are plentiful, their patterns suffer from many false and premature breakouts. This requires that a very strict breakout rule be used, either a wide filter or a number of closes outside the breakout zone. It also requires a close protective stop at the breakout level in case the breakout is false. Once these defensive levels have been exceeded, and price is on its way, the trader can relax for a little while because the failure rate after a legitimate breakout is relatively low. Trailing stops should then be placed at each preceding minor reversal.
…. in symmetrical triangles, the best performance comes from late breakouts in the 73% – 75% distance.
Volume on the breakout seems more desirable in symmetrical triangles.”
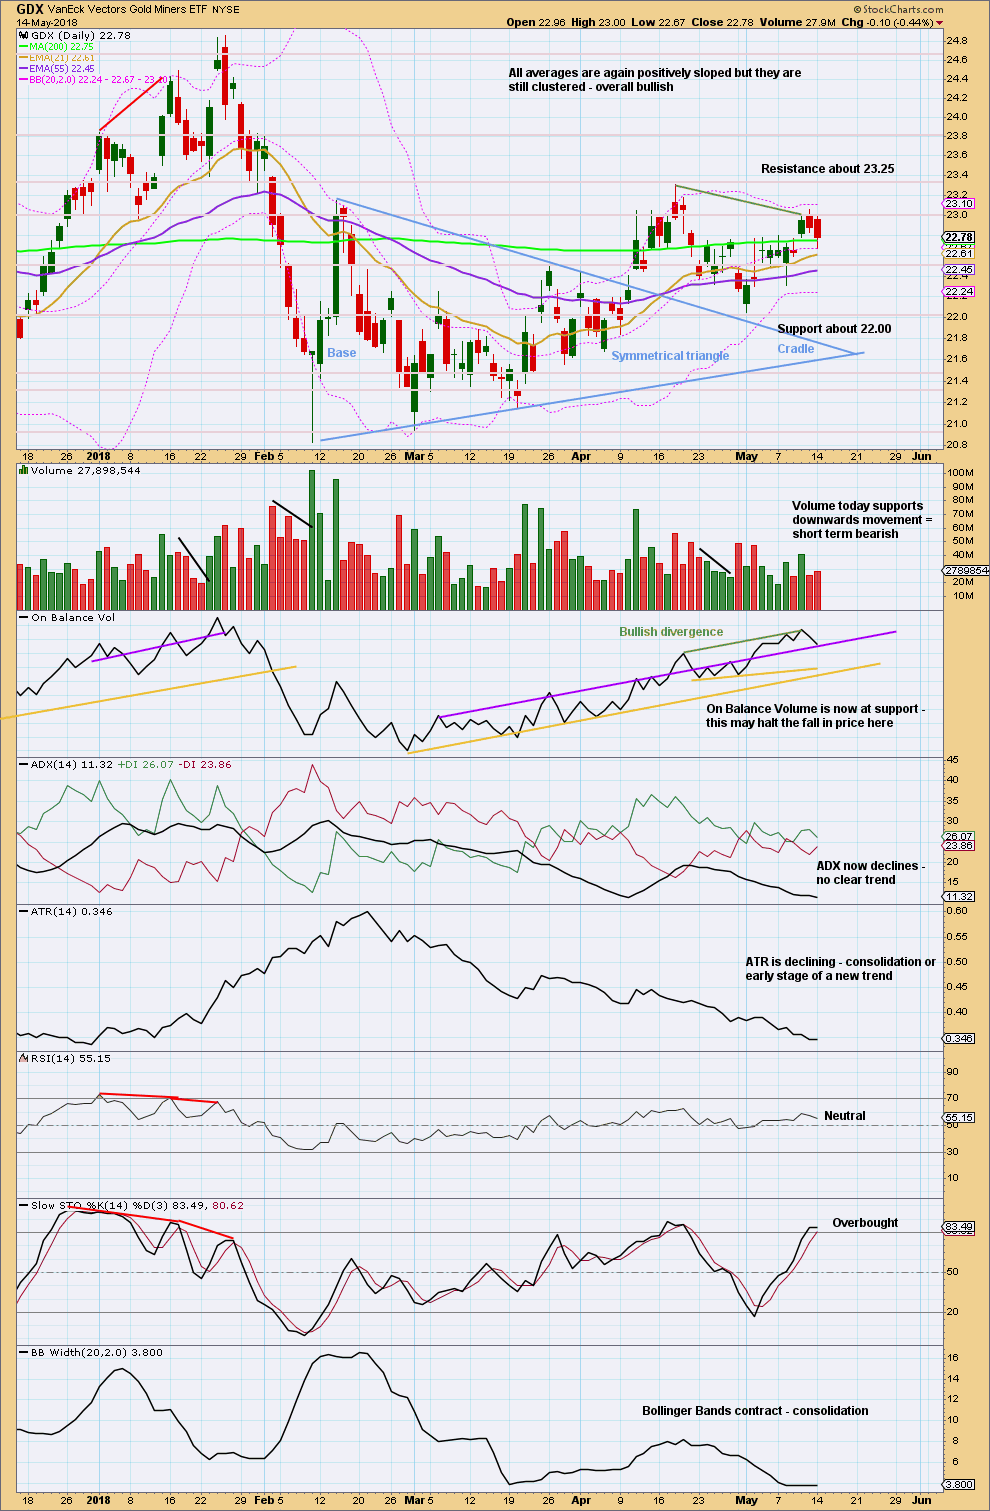
In this case, the breakout has come 61% of the triangle length from base to cradle. Volume towards the end of the triangle declined. The breakout is accompanied by a gap and has good support from volume.
Pullbacks occur 59% of the time for symmetrical triangles.
It looks like the pullback may be over. Price found support.
On Balance Volume gives a clear bullish signal with a break above resistance. This signal is reasonable as this resistance line is long held and tested many times. But it is not very strong because it has been broken once and has a reasonable slope. This could turn out to be another false signal.
It should also be noted that since the 28th of February On Balance Volume has been overall rising, which is bullish. On Balance Volume has made a new high above the high of the 19th of April, but price has not. This is also bullish.
GDX continues to look more clearly bullish than Gold at this stage. Although volume today supports downwards movement, more weight may be given to support on On Balance Volume suggesting downwards movement may be over here.
Published @ 09:10 p.m. EST.
Updated alternate hourly chart:
the main count is invalidated. the alternate daily and hourly is now the main count
the structure of minuette (v) is complete. within it, subminuette iii has a swift strong fifth wave to end it, typical of commodities
Will probably spell disaster with a daily / weekly close below 1300? Gold price has broken below 200dma (1306) for an almost 50% retrace of H 1365 / L 1205. Where to next I wonder lol 🙂
Not necessarily. It broke below the 200 DMA on the 5th of December, 2017. Moved $29 below the 200 DMA to the low on the 12th of December a few days later, and then bounced very strongly up from there.
The lesson there is that the 200 DMA does not always provide support, and if price closes below it that does not necessarily mean price must remain below it.
Right now price is close to the 0.618 Fibonacci ratio of minor A which is at 1,284.36.
Syed, good to see you post. It’s been awhile…
Looking closer at the GDX and GDXJ charts, I don’t think today will be the bottom. Price needs to move below the May 1st lows. Maybe a couple more days.
Gold bouncing at the bottom channel trend line. Miners holding up relatively well. Time will tell if today becomes a reversal day or not. So far looks like it could be, but too soon to tell 🤔
Boom. Interest rates and the USD pop! Gold drops to new lows. Price hit the channel bottom near 1,293. Critical time.
Either today is a reversal day or gold is in trouble. @ 1,293ish, bottom should be close and a reversal should occur if main weekly and daily alternate are correct. Let’s see
If Gold bottoms today, this is the immediately bullish idea for GDX
https://www.tradingview.com/x/nYkFQyyP/
Well all support except the trend line has been broke stuck in buy from break out over 1318 seems like every trade lately is wrong guess I’ll hold for awhile
Looks like another big spike down on BarChart that doesn’t show on other databases. Ugh 😑
At least we know where price is going as other databases usually follow these phantom moves.
I know. It’s not ideal. But yes, I have noticed that those phantom spikes do often seem to be an indicator of direction, at least for the short term.
So I look at them as useful, rather than annoying. Best to look on the bright side, no?
Yes. Good to be an optimist 😀