
Strong upwards movement fits the main Elliott wave count. This was expected to show up sometime this week or early next week.
Summary: The target is now 1,411. Triple bullish divergence between price and Stochastics, and now a cluster of long lower candlestick wicks, suggest a low may be in place here or very soon.
With a bullish signal from On Balance Volume and support from volume for rising price, some confidence may now be had in the main bullish Elliott wave count.
Always trade with stops to protect your account. Risk only 1-5% of equity on any one trade.
New updates to this analysis are in bold.
Grand SuperCycle analysis is here.
Last in-depth historic analysis with monthly and several weekly charts is here, video is here.
There are multiple wave counts at this time at the weekly and monthly chart levels. In order to make this analysis manageable and accessible only two will be published on a daily basis, one bullish and one bearish. This does not mean the other possibilities may not be correct, only that publication of them all each day is too much to digest. At this stage, they do not diverge from the two possibilities below.
BULLISH ELLIOTT WAVE COUNT
FIRST WEEKLY CHART
Click chart to enlarge.
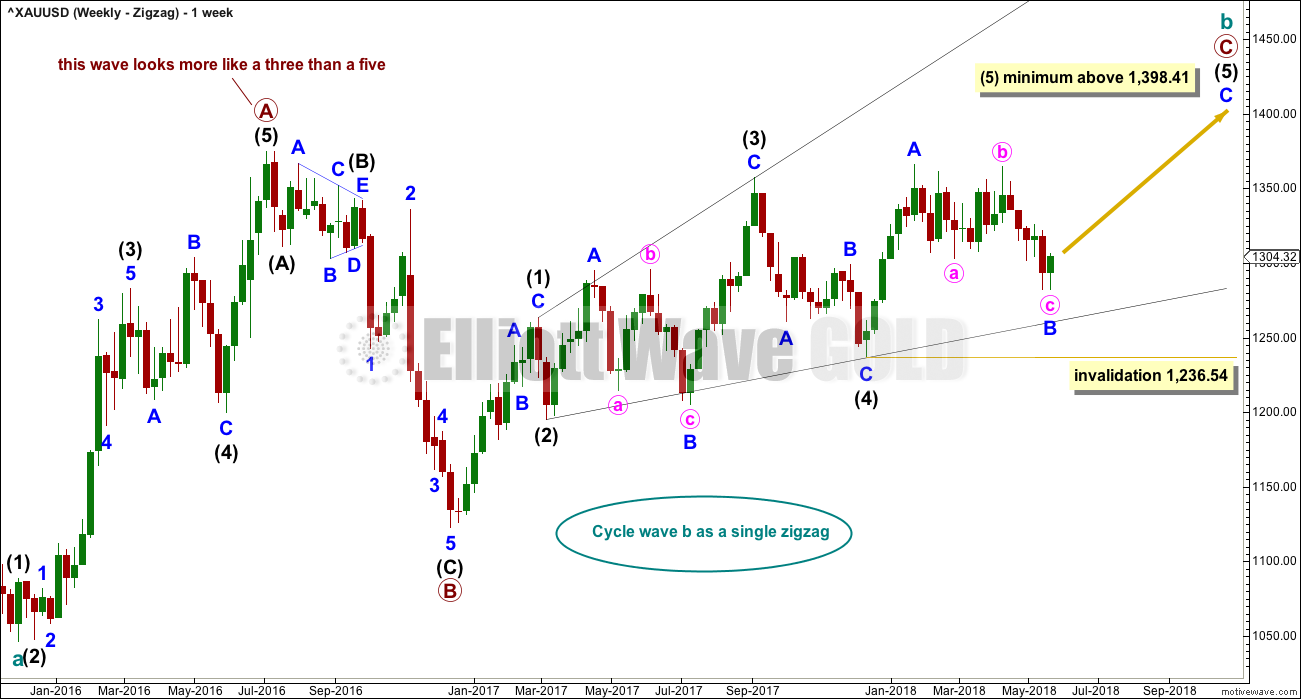
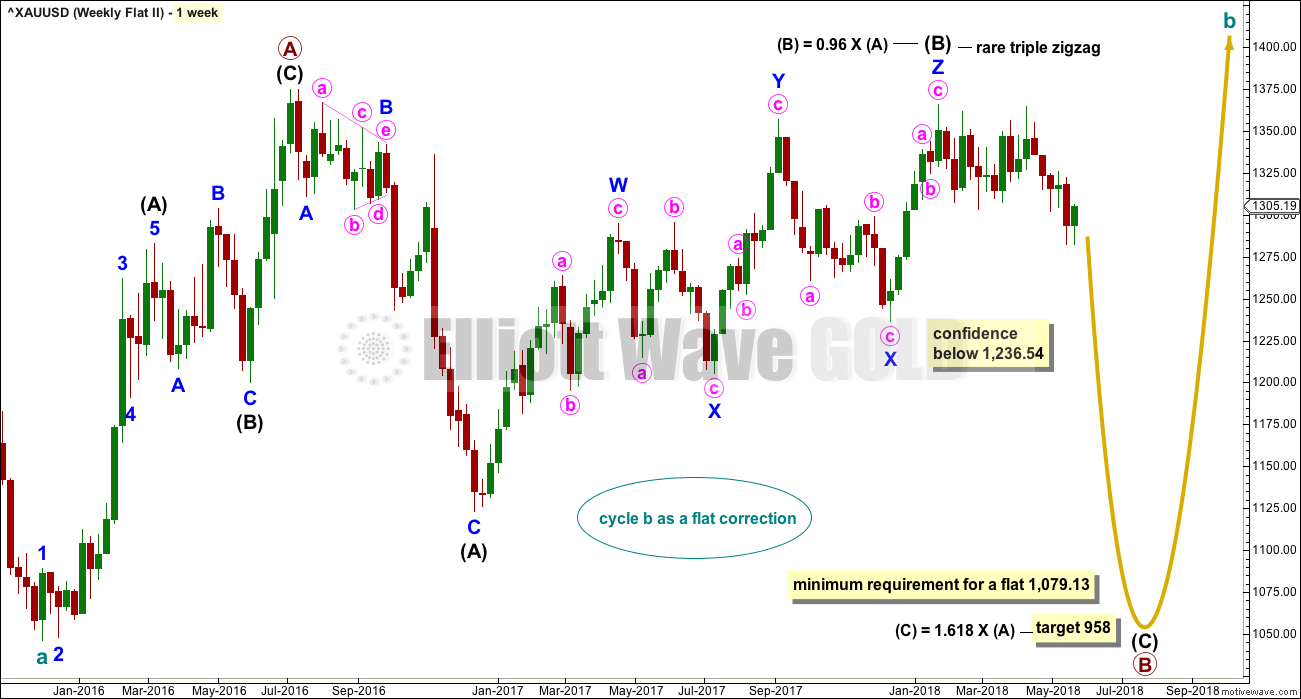
Cycle wave b may be a single zigzag. Zigzags subdivide 5-3-5. Primary wave C must subdivide as a five wave structure and may be either an impulse or an ending diagonal. Overlapping at this stage indicates an ending diagonal.
Within an ending diagonal, all sub-waves must subdivide as zigzags. Intermediate wave (4) must overlap into intermediate wave (1) price territory. This diagonal is expanding: intermediate wave (3) is longer than intermediate wave (1) and intermediate wave (4) is longer than intermediate wave (2). Intermediate wave (5) must be longer than intermediate wave (3), so it must end above 1,398.41 where it would reach equality in length with intermediate wave (3).
Within the final zigzag of intermediate wave (5), minor wave B may not move beyond the start of minor wave A below 1,236.54. However, if it were now to turn out to be relatively deep, it should not get too close to this invalidation point as the lower (2)-(4) trend line should provide strong support. Diagonals normally adhere very well to their trend lines.
Within the diagonal of primary wave C, each sub-wave is extending in price and so may also do so in time. Within each zigzag, minor wave B may exhibit alternation in structure and may show an increased duration.
Within intermediate wave (1), minor wave B was a triangle lasting 11 days. Within intermediate wave (3), minor wave B was a regular flat lasting 60 days. Intermediate wave (5) is expected to be longer in price than intermediate wave (3), and it may also be longer in duration, and so minor wave B within it may also be longer in duration. If minor wave B is over, it would have lasted 82 days.
This first weekly chart sees the upwards wave labelled primary wave A as a five wave structure. It must be acknowledged that this upwards wave looks better as a three than it does as a five. The fifth weekly chart below will consider the possibility that it was a three.
FIRST DAILY CHART
Click chart to enlarge.
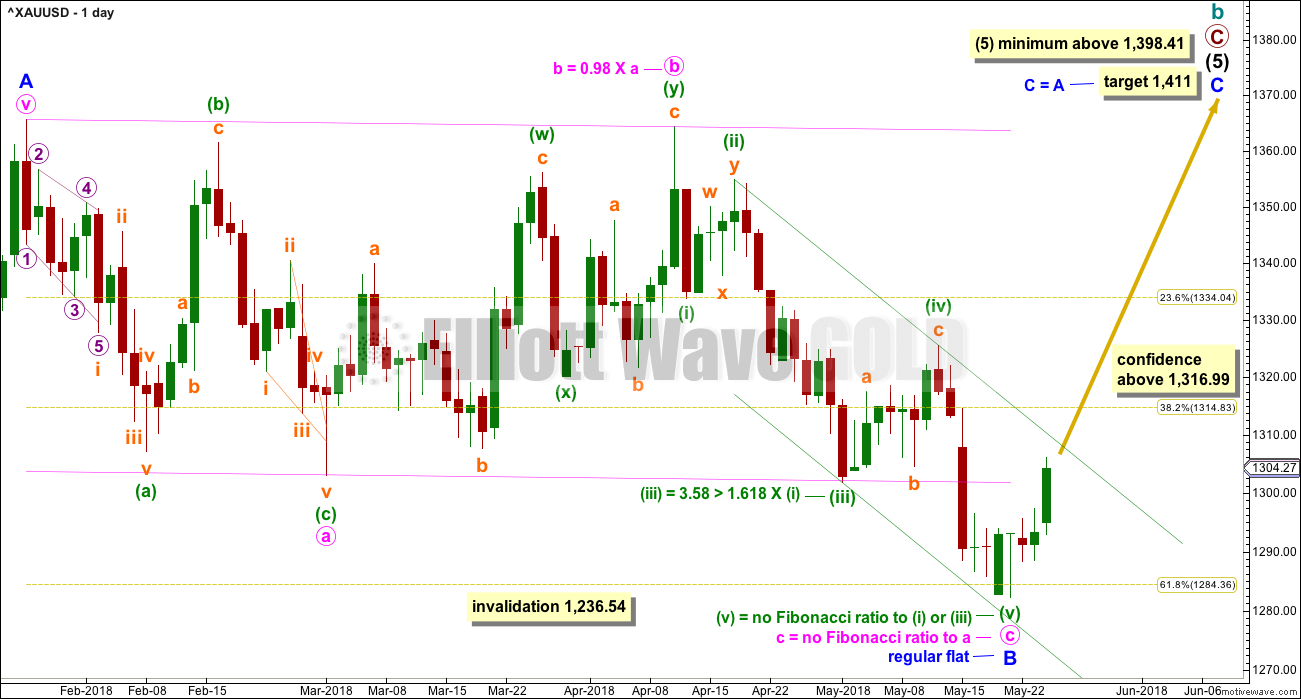
Minor wave B may be a complete regular flat correction. Minute wave c has overshot the lower trend line. Although this is not the most common look for a regular flat, it does sometimes happen.
The bottom line for this wave count is it now requires a breach of the green Elliott channel about minute wave c for confidence that a low is now in place.
The target for minor wave C is calculated using the most common Fibonacci ratio to minor wave A. This would see intermediate wave (5) reach beyond its minimum required length. All Elliott wave rules would be met.
HOURLY CHART
Click chart to enlarge.
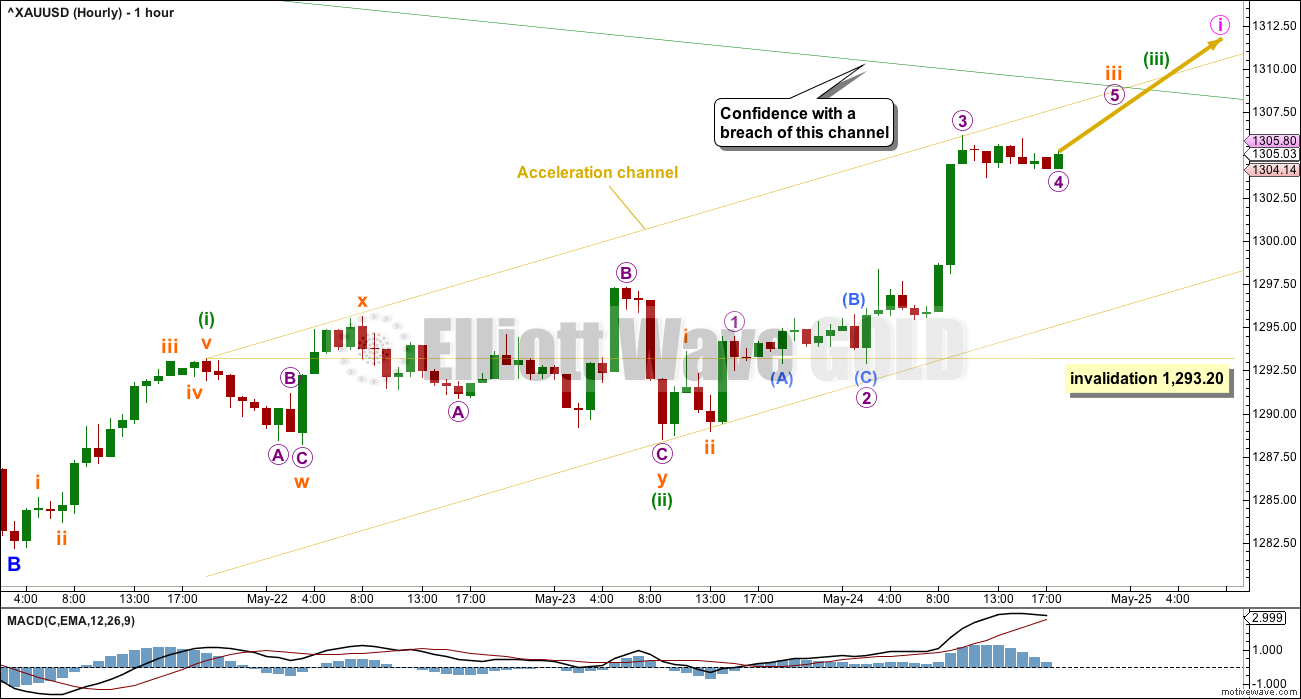
Minor wave C must subdivide as a five wave motive structure, either an impulse or an ending diagonal. An impulse is much more common, and that is what will be expected.
Minute wave i may be incomplete. Within minute wave i, minuette waves (i) and (ii) may be complete and minuette wave (iii) may be close to completion. The following correction for minuette wave (iv) may not move into minuette wave (i) price territory below 1,293.20.
Draw an acceleration channel about upwards movement. Draw the first trend line from the end of minuette wave (i) to the last high, then place a parallel copy on the end of minuette wave (ii). Keep redrawing the channel as price moves higher. The lower edge may show where corrections along the way up may find support.
If price breaks above the upper edge of the green channel copied over from the daily chart, that would add confidence to this wave count. At that stage, the alternate below would be discarded.
ALTERNATE HOURLY CHART
Click chart to enlarge.
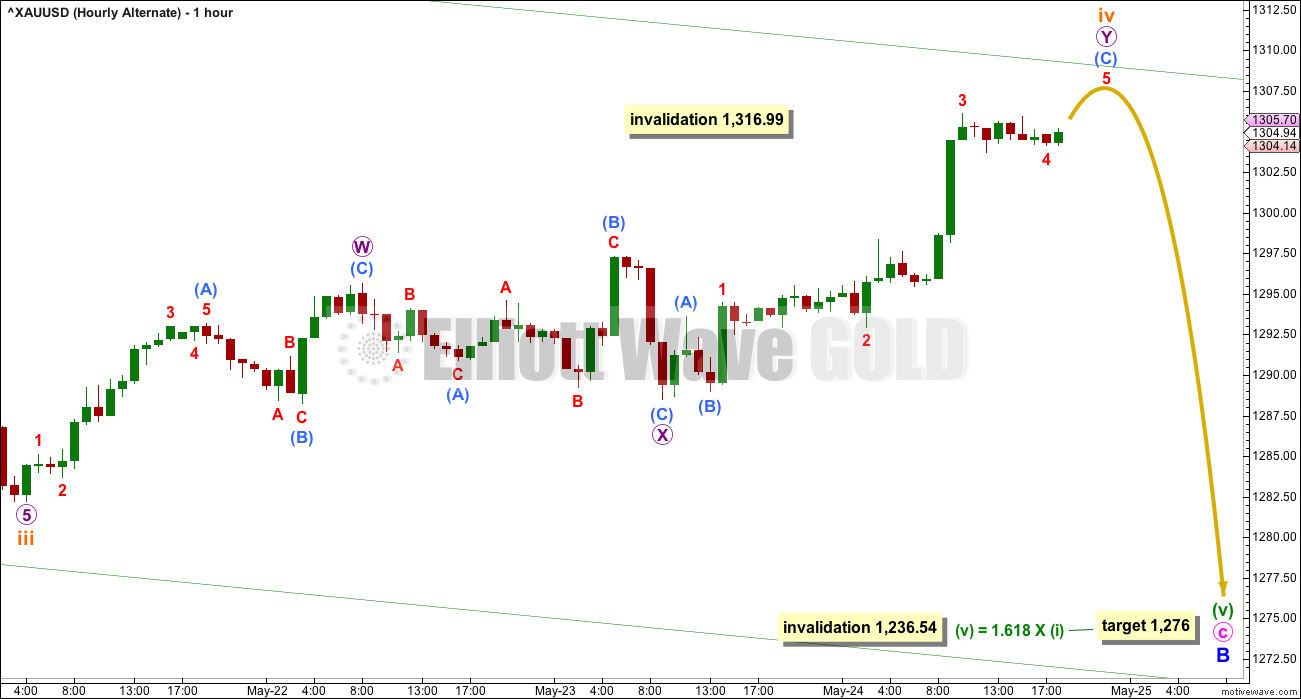
If minor wave B is incomplete, then within it the impulse of minute wave c downwards may need a final fifth wave to complete it.
Subminuette wave iv is now grossly disproportionate to subminuette wave ii, which lasted just 5 hours (it is now off to the left of this chart). This wave count no longer looks reasonable at the daily chart level.
Subminuette wave iv may be an incomplete double zigzag, and it may not move into subminuette wave i price territory above 1,316.99.
This wave count has an extremely low probability today, and it does not have support from classic technical analysis.
BEARISH ELLIOTT WAVE COUNT
FIFTH WEEKLY CHART
Click chart to enlarge.
There were five weekly charts published in the last historic analysis. This fifth weekly chart is the most immediately bearish wave count, so this is published as a bearish possibility.
This fifth weekly chart sees cycle wave b as a flat correction.
If cycle wave b is a flat correction, then within it primary wave B must retrace a minimum 0.9 length of primary wave A at 1,079.13 or below. The most common length of B waves within flats is from 1 to 1.38 times the length of the A wave. The target calculated would see primary wave B end within this range.
Primary wave B may be subdividing as a regular flat correction, and within it both intermediate waves (A) and (B) subdivide as three wave structures. Intermediate wave (B) fits as a triple zigzag.
I have only seen two triple zigzags before during my 10 years of daily Elliott wave analysis. If this wave count turns out to be correct, this would be the third. The rarity of this structure is identified on the chart.
FIFTH DAILY CHART
Click chart to enlarge.
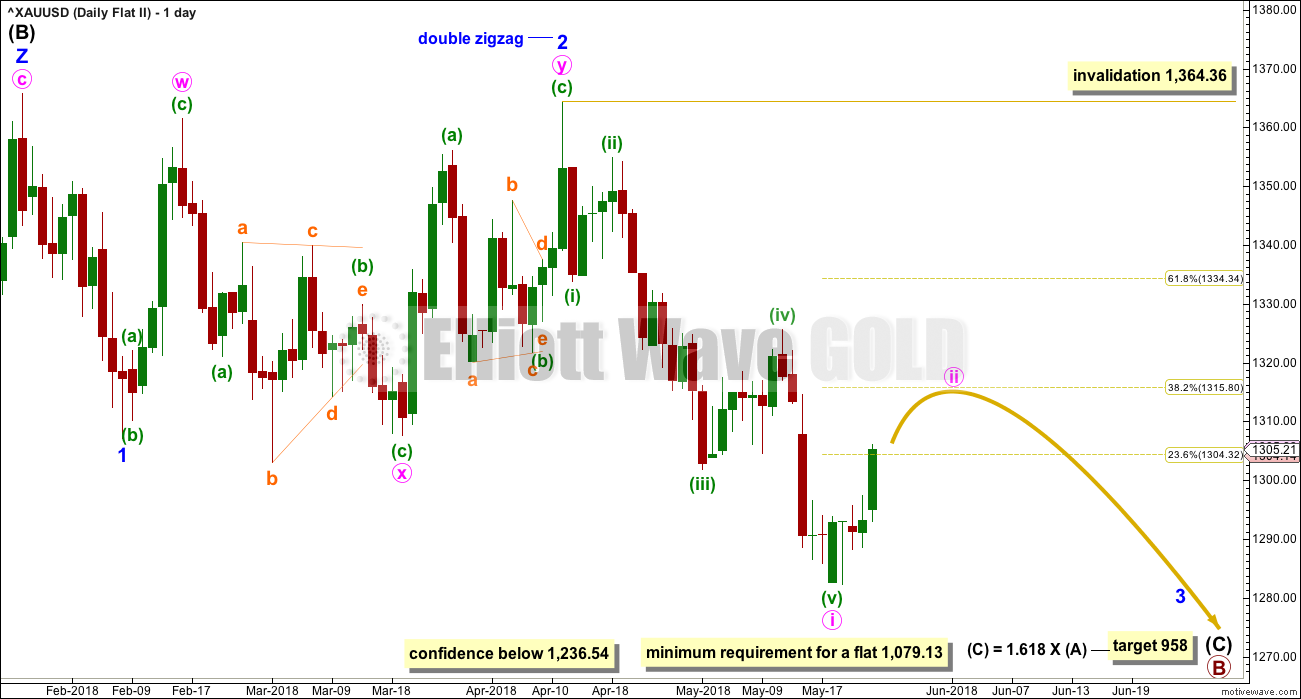
Minor wave 1 may have been a relatively brief impulse over at the low of the 8th of February.
Minor wave 2 may be over at the last high as a double zigzag. All subdivisions fit and all Elliott wave rules are met. The second zigzag in the double does deepen the correction, which is its purpose, although it is not by very much.
It is possible that a third wave, minor wave 3, began at the last high labelled minor wave 2. Minor wave 3 may only subdivide as an impulse.
Within minor wave 3, minute wave i may be over at the last low. Minute wave ii may be a multi day bounce or sideways movement that may end about the 0.382 or 0.618 Fibonacci ratios, but the pull of the middle of a third wave down may now force it to be more shallow than second wave corrections usually are; the 0.382 Fibonacci ratio may be slightly favoured.
Minute wave ii may not move beyond the start of minute wave i above 1,364.36.
TECHNICAL ANALYSIS
WEEKLY CHART
Click chart to enlarge. Chart courtesy of StockCharts.com.
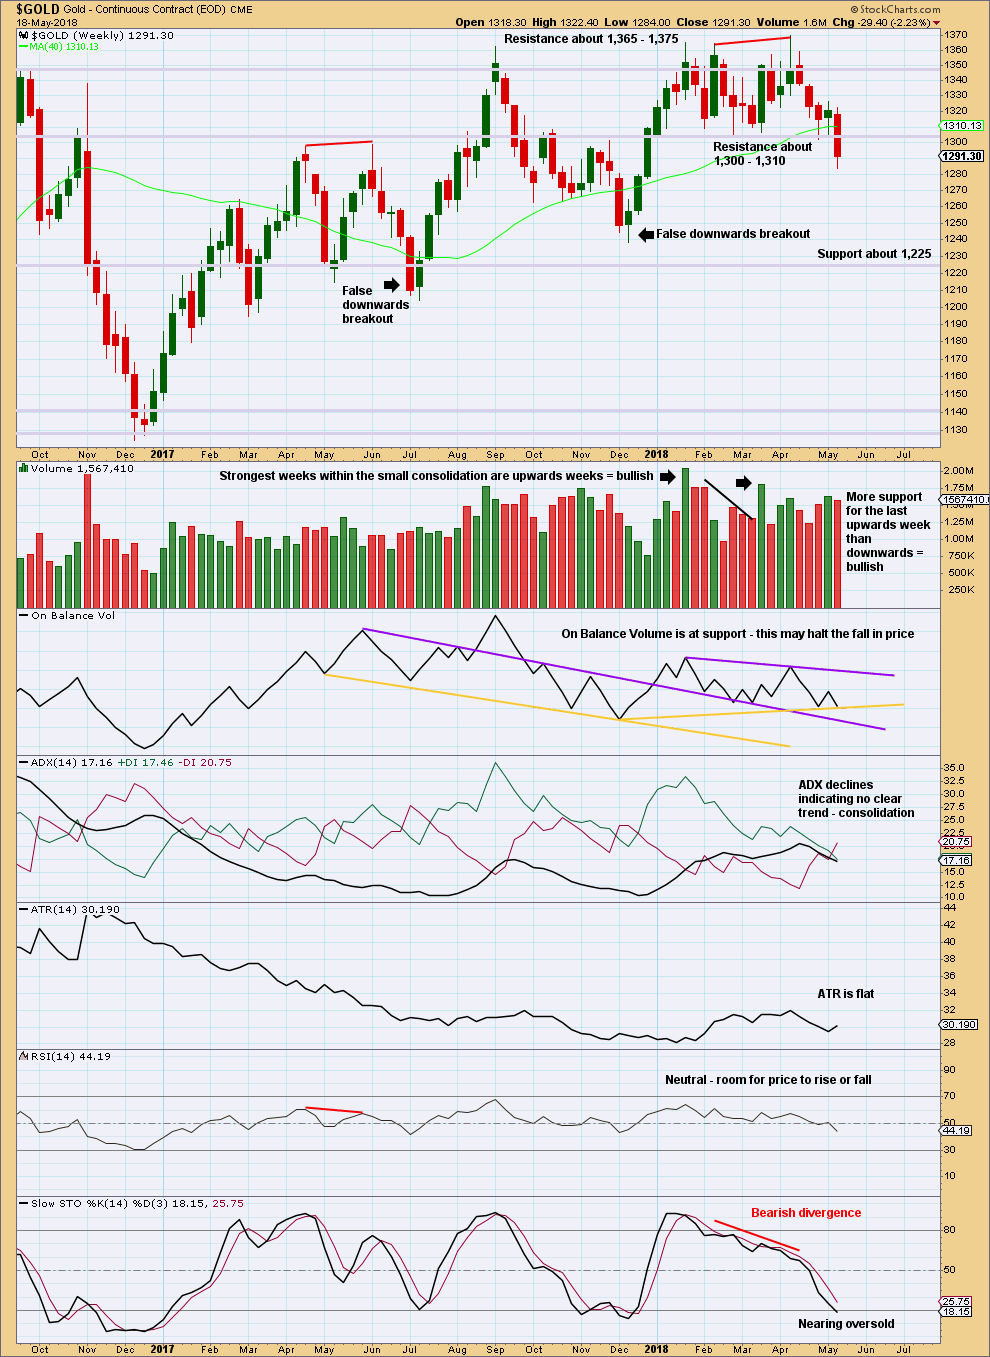
Price has closed below support last week, although at this time frame it does not have support from volume. However, a downwards breakout does not require support from volume for confidence.
Next support at this time frame is about 1,225.
At this stage, with the data in hand, this looks like a possible downwards breakout. However, there are two recent examples of false downwards breakouts on this chart. As noted, price closed below support at the weekly chart time frame in both instances, but within two weeks afterwards price was back within the prior consolidation zone. In both instances, the clue was in volume during the consolidation: both instances saw the strongest volume during the consolidation for upwards weeks.
That could be the case again here as volume during the last consolidation was for upwards weeks. For this reason some suspicion may be had on this possible downwards breakout. If it is followed by another downwards week, then some confidence may then be had in it.
DAILY CHART
Click chart to enlarge. Chart courtesy of StockCharts.com.
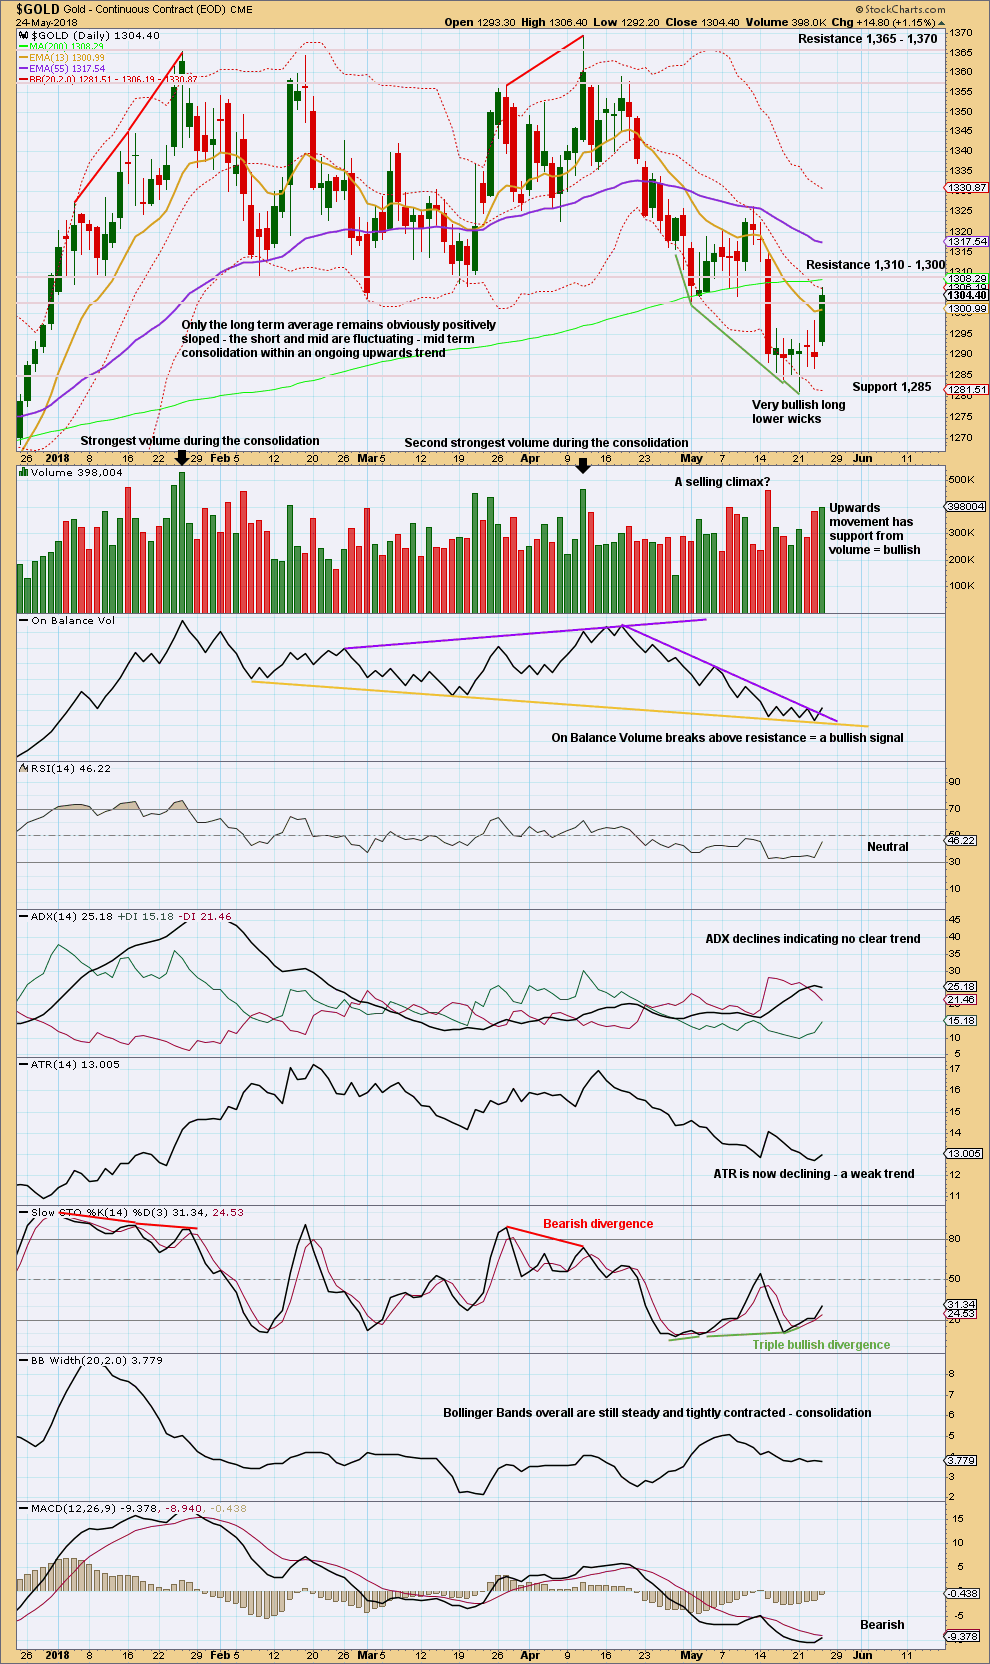
Gold has broken below support about 1,310 – 1,305 on a downwards day with support from volume. This may be a downwards breakout from the consolidation.
In order to judge the possibility of a low in place as the main Elliott wave count expects, let us look back at major lows from November 2015 and see how price behaved in the days immediately after.
A major low was found on the 3rd of December, 2015. The following day for the 4th of December saw a strong Bullish Engulfing reversal pattern with support from volume, and it came with strong double bullish divergence between price and both of RSI and Stochastics. That low in hindsight looks fairly strong.
Another reasonable low was found on the 31st of May, 2016. There was no reasonable bullish divergence at the low between price and either of RSI or Stochastics. At the low, the candlestick had a bullish long lower wick (although with a reasonable upper wick, it is not properly a Hammer reversal pattern). The two days following the low for the 1st and 2nd of June were inconclusive; both closed red and could at the time have been considered a potential bear flag pattern developing; both had a balance of volume downwards but showed strongly declining volume. Not until the third day, with a very strong upwards day with support from volume to complete a very strong Bullish Engulfing reversal pattern, was a low set in place.
A major low was found on the 15th of December, 2016. At the low, the candlestick had a somewhat bullish long lower wick; volume for the last downwards day supported the fall in price; and, there was clear and strong bullish divergence between price and RSI and Stochastics. The next two days closed green but did not have support from volume. The following two days closed red and did have support from volume. At that stage, four days out from a major low, the short term volume profile was bearish and it looked like a bear flag pattern may be developing. It was not until seven days after the low on the 27th of December that a reasonable bullish day unfolded, and even then it did not have good support from volume. This low did not look clear.
The next low to study occurred on the 10th of March, 2017. That day was inconclusive, closing green, but the balance of volume was downwards and volume supported that downwards movement. At the low, there was no reasonable bullish divergence between price and either of RSI or Stochastics. It was not until three days after the low on the 15th of March that price bounced strongly to complete a strong Bullish Engulfing reversal pattern, which had good support from volume.
The next low to study occurred on the 9th of May, 2017. On that day RSI reached oversold, but there was no divergence between it and price nor price and Stochastics. Right up until six days after the low the short term volume profile could have been judged to be bearish; rising price did not have support from volume. It was clear a low was in place on the 17th of May as a very strong Bullish Engulfing reversal pattern unfolded with strong support from volume. The small bounce up until that date could have been judged to be a bounce within an ongoing downwards trend.
The next low to study occurred on the 10th of July, 2017. There was no divergence at the low between price and RSI, but there was strong clear bullish divergence between price and Stochastics. There were two candlesticks with bullish long lower wicks at the low, but volume remained lighter than the prior downwards day of the 9th of July. This looks like a selling climax in hindsight, but at the time it could have been judged to support downwards movement. Right up until the 14th of July, five days after the low, it could have been considered a bear flag pattern unfolding. On the 14th of July a strong Bullish Engulfing pattern unfolded with some support from volume.
The last low to study is a very important one on the 12th of December, 2017. This occurred after a downwards breakout below support, which was previously at 1,262. That downwards breakout was short lived; price remained below support for two weeks, and found a low only five days after the breakout. At the low, there was no bullish divergence between price and either of RSI or Stochastics. The first upwards day on the 13th of December had a wide range but a very small real body. It did have good support from volume, but volume remained lighter than most prior downwards days. After that low, price moved steadily higher for weeks, initially on light and declining volume. That low in hindsight was very difficult to pick.
Some conclusions may be drawn in relation to the current situation. The first and strongest conclusion is that lows for Gold (at least for the last two years and five months) are not always very clear at the time. Price can be weak in days immediately following lows; it can remain weak for about five to seven days following lows. Lows do not always come with divergence between price and RSI nor even price and Stochastics, but when they do that offers a clue.
Although the last few days have seen unexpected downwards movement, some suspicion may be had that this is a downwards breakout. ADX at this time indicates a downward trend is in place, but this is a lagging indicator. Look out for at least a short term bounce here, and do not be surprised if it begins to show some strength towards the end of this week. If it remains persistently weak, then short positions may be taken for a downwards trend (the new labelling for the fifth wave count could be correct). If it shows strength, that would support the first wave count; the downwards breakout may have been yet another false breakout.
The current low now has triple bullish divergence with price, and there is now a cluster of long lower candlestick wicks. Considering volume during the last consolidation was bullish and Gold has a recent history of false downwards breakouts following that set up, look out here for a strong bounce.
A strong upwards day with support from volume and a bullish breakout by On Balance Volume today offer good support to the main Elliott wave count.
GDX WEEKLY CHART
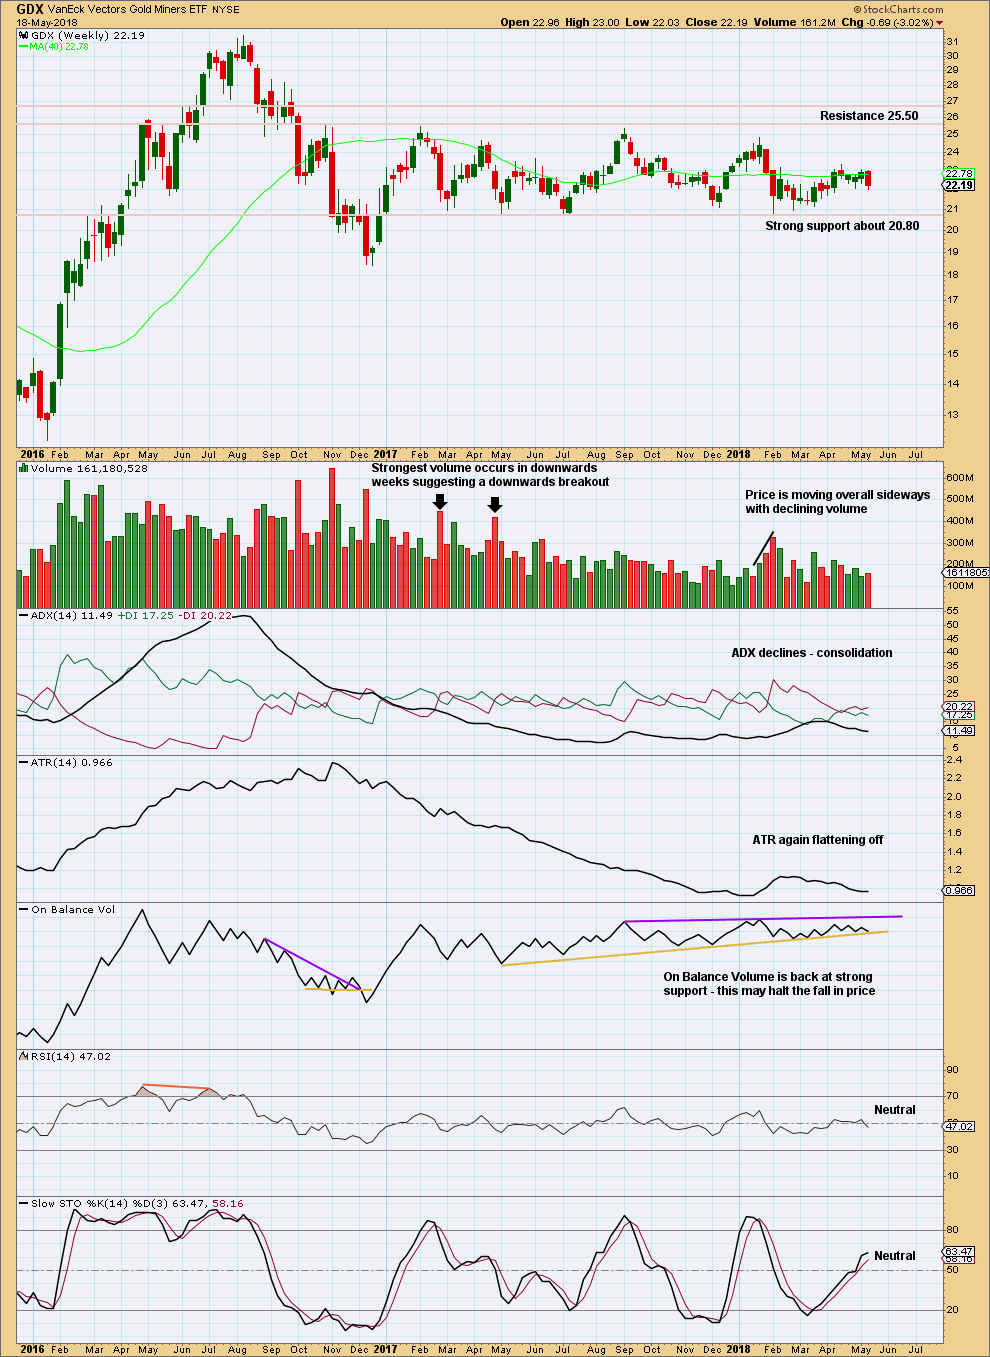
Click chart to enlarge. Chart courtesy of StockCharts.com.
Support about 20.80 has been tested about eight times and so far has held. The more often a support area is tested and holds, the more technical significance it has.
In the first instance, expect this area to continue to provide support. Only a strong downwards day, closing below support and preferably with some increase in volume, would constitute a downwards breakout from the consolidation that GDX has been in for a year now.
Resistance is about 25.50. Only a strong upwards day, closing above resistance and with support from volume, would constitute an upwards breakout.
Overall, a slow upwards swing may be underway. Do not expect it to move in a straight line; it may have downwards weeks within it.
GDX DAILY CHART

Click chart to enlarge. Chart courtesy of StockCharts.com.
On trading triangles from Dhalquist and Kirkpatrick, page 319:
“The ideal situation for trading triangles is a definite breakout, a high trading range within the triangle, an upward-sloping volume trend during the formation of the triangle, and especially a gap on the breakout. These patterns seem to work better with small-cap stocks in a rising market.
Although triangles are plentiful, their patterns suffer from many false and premature breakouts. This requires that a very strict breakout rule be used, either a wide filter or a number of closes outside the breakout zone. It also requires a close protective stop at the breakout level in case the breakout is false. Once these defensive levels have been exceeded, and price is on its way, the trader can relax for a little while because the failure rate after a legitimate breakout is relatively low. Trailing stops should then be placed at each preceding minor reversal.
…. in symmetrical triangles, the best performance comes from late breakouts in the 73% – 75% distance.
Volume on the breakout seems more desirable in symmetrical triangles.”
In this case, the breakout has come 61% of the triangle length from base to cradle. Volume towards the end of the triangle declined. The breakout is accompanied by a gap and has good support from volume.
Pullbacks occur 59% of the time for symmetrical triangles.
Overall, this chart remains bullish, particularly the volume profile.
Bullish divergence between price and On Balance Volume at the last highs still remains valid, and it still supports the idea of new highs from price to follow through.
Published @ 06:52 p.m. EST.
Hourly chart updated:
price is reacting down from resistance at the upper edge of the green channel, this looks like another small fourth wave correction
but if this count is wrong, it will be in seeing minuette (iii) incomplete, or even in seeing minute i incomplete.
this reaction downwards could be minuette (iv) or even minute ii.
because the middle of the upwards wave, the third wave in the middle, may not look like a good five on the hourly chart
so I’ll take some time today to look on the five minute chart and see if minute i could be complete
because or Gold’s third wave impulses: it often has a time consuming second wave correction and then a sharp third wave, then a quick shallow fourth wave, and a very sharp thrust to end the fifth wave with the most strength
when it does that at higher time frames due to a disproportion between the time consuming second wave and the quick fourth wave, the five looks like a three
so that’s a possibility I’ll look for on the five minute chart, if it fits and looks typical this count may change to see the current downwards reaction either minuette (iv) or possibly even minute ii
anyway, look now for price to find support at the lower edge of the acceleration channel, which should be redrawn from the end of minuette (i) to the last high then a copy on the end of minuette (ii)
Yesterday’s green candle was anticipated. My comment about candlestick bullish pattern frying pattern came to fruition sooner than expected. Great!
May 23 report: “It appears “now a cluster of long lower candlestick wicks” these candles are part of developing bullish frying pan candle pattern. Once a strong green candle is formed the pattern will be complete.”
Soon gold will punch thru the green channel.
yes indeed, that candlestick was so good to see this week
finding resistance now right at the green trend line… may be able to break through early next week
then resistance may become support
So ultimately, GDX made a new low and GDXJ did not. Neither hit my preferred target zones for very deep retraces. Overall, it’s very bullish that the miners held up so well.
If this count is correct and the bottom is in for this recent Minor wave 2, we are starting a strong 3rd wave up. If you try to day-trade this, you will likely miss a large portion of the move up.
For the adventurous:
Buying NUGT at today’s close could result in 120% gains within 3 months.
Buying JNUG at today’s close could result in 170% gains within 3 months.
Good luck all!
https://www.tradingview.com/x/NEpQ6Rsf/