
With a sideways range day, the Elliott Wave counts remain the same.
Summary: The target is now 1,411. Triple bullish divergence between price and Stochastics suggest a low may be in place here or very soon.
If price does move lower, then it should find very strong support at the lower black (2)-(4) trend line on the weekly and daily charts. Weakness in recent movement suggests this possibility must be seriously considered.
Price is finding strong resistance at 1,310 – 1,300. If this can be overcome, then a trend may be able to build strength.
Always trade with stops to protect your account. Risk only 1-5% of equity on any one trade.
New updates to this analysis are in bold.
Grand SuperCycle analysis is here.
Last in-depth historic analysis with monthly and several weekly charts is here, video is here.
There are multiple wave counts at this time at the weekly and monthly chart levels. In order to make this analysis manageable and accessible only two will be published on a daily basis, one bullish and one bearish. This does not mean the other possibilities may not be correct, only that publication of them all each day is too much to digest. At this stage, they do not diverge from the two possibilities below.
BULLISH ELLIOTT WAVE COUNT
FIRST WEEKLY CHART
Click chart to enlarge.
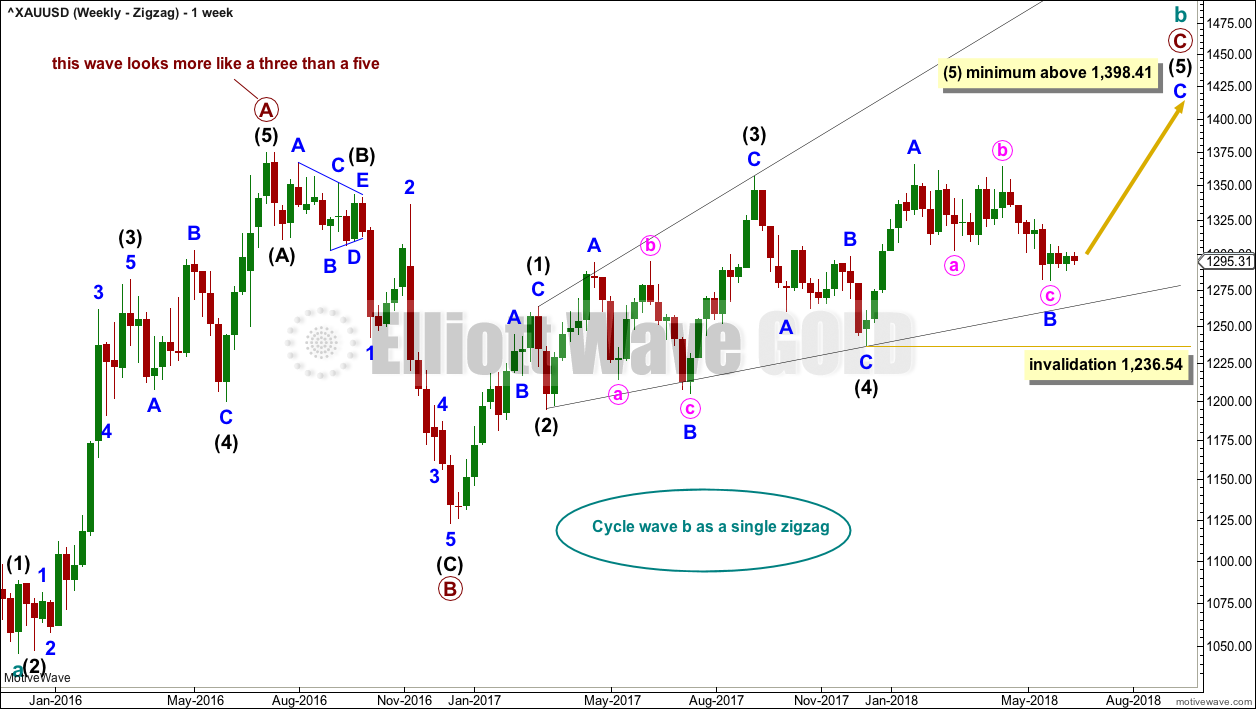
Cycle wave b may be a single zigzag. Zigzags subdivide 5-3-5. Primary wave C must subdivide as a five wave structure and may be either an impulse or an ending diagonal. Overlapping at this stage indicates an ending diagonal.
Within an ending diagonal, all sub-waves must subdivide as zigzags. Intermediate wave (4) must overlap into intermediate wave (1) price territory. This diagonal is expanding: intermediate wave (3) is longer than intermediate wave (1) and intermediate wave (4) is longer than intermediate wave (2). Intermediate wave (5) must be longer than intermediate wave (3), so it must end above 1,398.41 where it would reach equality in length with intermediate wave (3).
Within the final zigzag of intermediate wave (5), minor wave B may not move beyond the start of minor wave A below 1,236.54. However, if it were now to turn out to be relatively deep, it should not get too close to this invalidation point as the lower (2)-(4) trend line should provide strong support. Diagonals normally adhere very well to their trend lines.
Within the diagonal of primary wave C, each sub-wave is extending in price and so may also do so in time. Within each zigzag, minor wave B may exhibit alternation in structure and may show an increased duration.
Within intermediate wave (1), minor wave B was a triangle lasting 11 days. Within intermediate wave (3), minor wave B was a regular flat lasting 60 days. Intermediate wave (5) is expected to be longer in price than intermediate wave (3), and it may also be longer in duration, and so minor wave B within it may also be longer in duration. If minor wave B is over, it would have lasted 82 days.
This first weekly chart sees the upwards wave labelled primary wave A as a five wave structure. It must be acknowledged that this upwards wave looks better as a three than it does as a five. The fifth weekly chart below will consider the possibility that it was a three.
FIRST DAILY CHART
Click chart to enlarge.
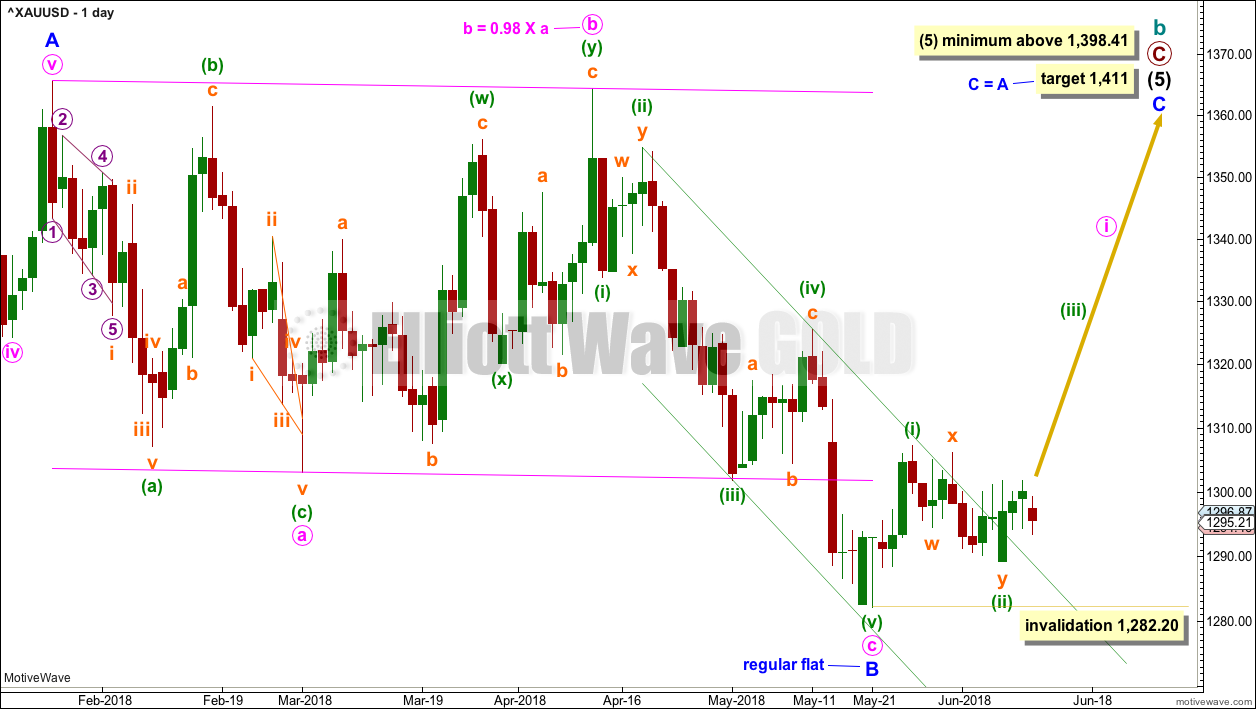
Minor wave B may be a complete regular flat correction. Minute wave c has overshot the lower trend line. Although this is not the most common look for a regular flat, it does sometimes happen. Minute wave c now looks like an obvious five wave structure at the daily chart level.
There is now one full daily candlestick above and not touching the upper edge of the channel which contains minute wave c. This indicates that the downwards wave labelled minute wave c may be over and a new wave upwards may have begun. Within minute wave c, minuette wave (ii) may not move beyond the start of minuette wave (i) below 1,282.20. The channel breach may give some confidence now in this wave count.
What would add substantial confidence to this wave count now would be a close back above resistance at 1,300 – 1,310 on an upwards day with support from volume.
The target for minor wave C is calculated using the most common Fibonacci ratio to minor wave A. This would see intermediate wave (5) reach beyond its minimum required length. All Elliott wave rules would be met.
HOURLY CHART
Click chart to enlarge.
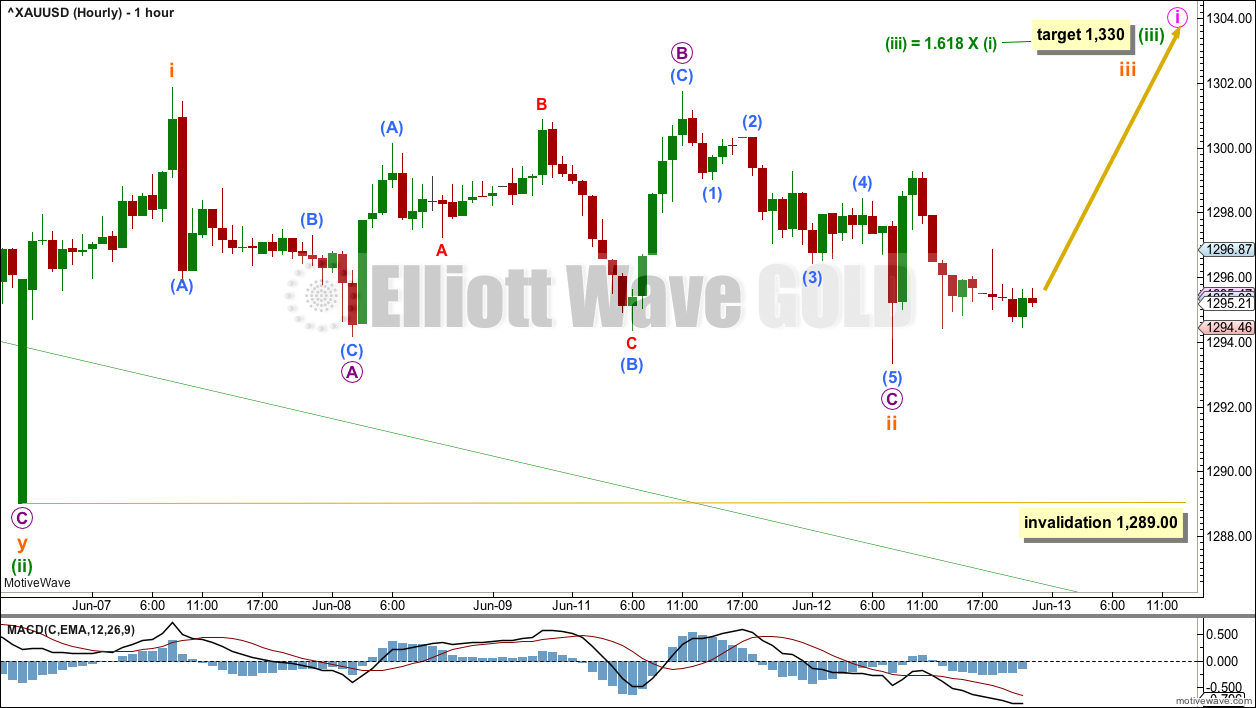
Minuette wave (ii) will fit now as a complete double zigzag. It may have been over at the last low at the spike down.
Upwards movement has breached the upper edge of the channel.
The target for minuette wave (iii) is calculated using the most common Fibonacci ratio to minuette wave (i).
This wave count now sees two first and second waves complete. It still expects an imminent increase in upwards momentum.
If subminuette wave ii continues lower, then it may not move beyond the start of subminuette wave i below 1,289.00.
ALTERNATE FIRST DAILY CHART
Click chart to enlarge.
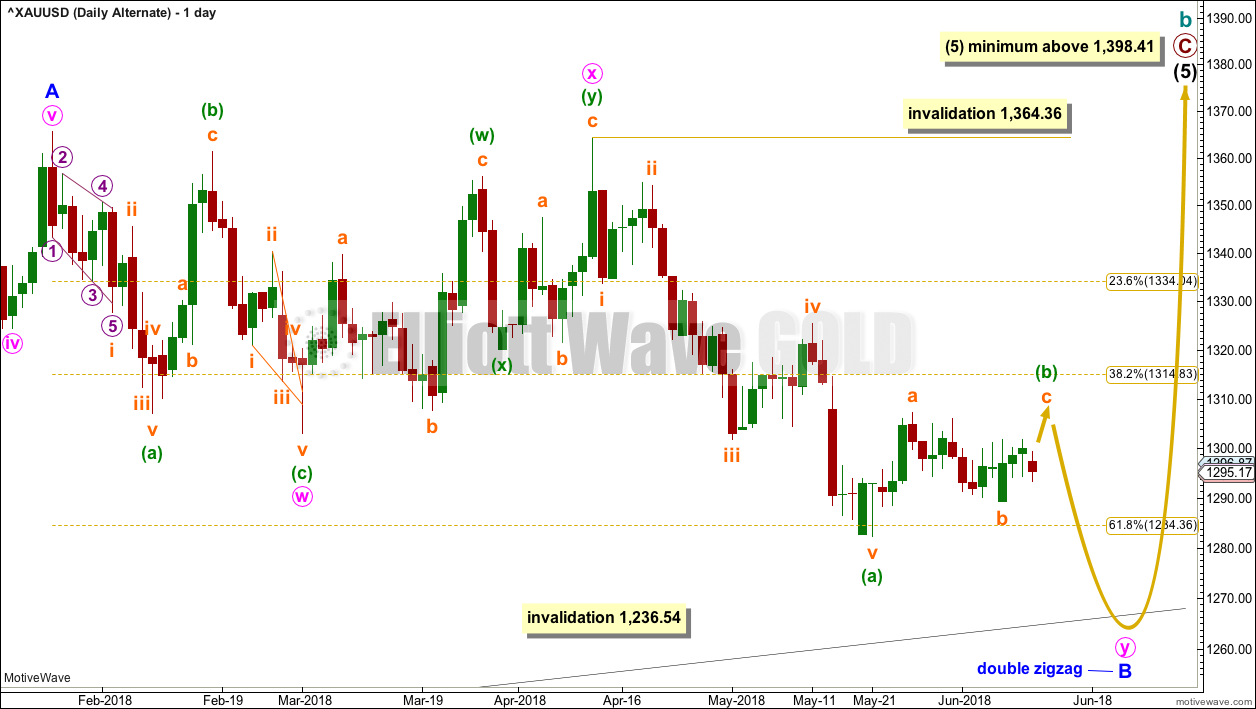
Minor wave B may be a double zigzag, which may be close to completion.
The first zigzag in the double is labelled minute wave w. The double is joined by a three in the opposite direction, a double zigzag labelled minute wave x. The second zigzag in the double is labelled minute wave y, and it is deepening the correction, which is the purpose of second zigzags.
Minute wave y may end at support at the lower black (2)-(4) trend line, which is copied over here from the weekly chart. This is the lower diagonal trend line.
Minuette wave (b) within minute wave y may still be incomplete. Within minuette wave (b), subminuette wave c would be very likely to make at least a slight new high above subminuette wave a at 1,307.34 to avoid a truncation. Thereafter, a final thrust downwards to find support at the lower black (2)-(4) trend line may unfold for minuette wave (c).
The problem with this wave count is the depth of minute wave x. X waves within double zigzags are almost always brief and shallow, particularly shallow. This is because multiple zigzags should have a strong slope against the prior trend, and to achieve a strong slope their X waves should be shallow. When their X waves are deep and time consuming, as this one is, they lend more of a sideways look to the structure.
BEARISH ELLIOTT WAVE COUNT
FIFTH WEEKLY CHART
Click chart to enlarge.
There were five weekly charts published in the last historic analysis. This fifth weekly chart is the most immediately bearish wave count, so this is published as a bearish possibility.
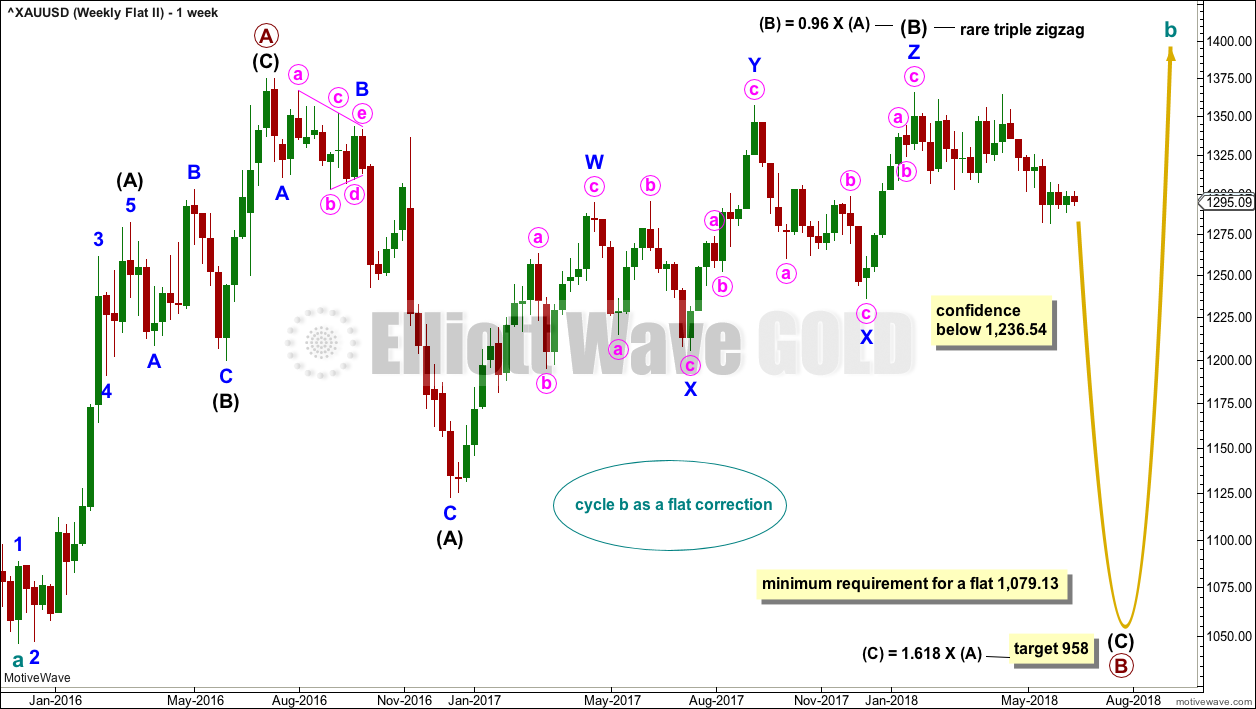
This fifth weekly chart sees cycle wave b as a flat correction.
If cycle wave b is a flat correction, then within it primary wave B must retrace a minimum 0.9 length of primary wave A at 1,079.13 or below. The most common length of B waves within flats is from 1 to 1.38 times the length of the A wave. The target calculated would see primary wave B end within this range.
Primary wave B may be subdividing as a regular flat correction, and within it both intermediate waves (A) and (B) subdivide as three wave structures. Intermediate wave (B) fits as a triple zigzag.
I have only seen two triple zigzags before during my 10 years of daily Elliott wave analysis. If this wave count turns out to be correct, this would be the third. The rarity of this structure is identified on the chart.
FIFTH DAILY CHART
Click chart to enlarge.
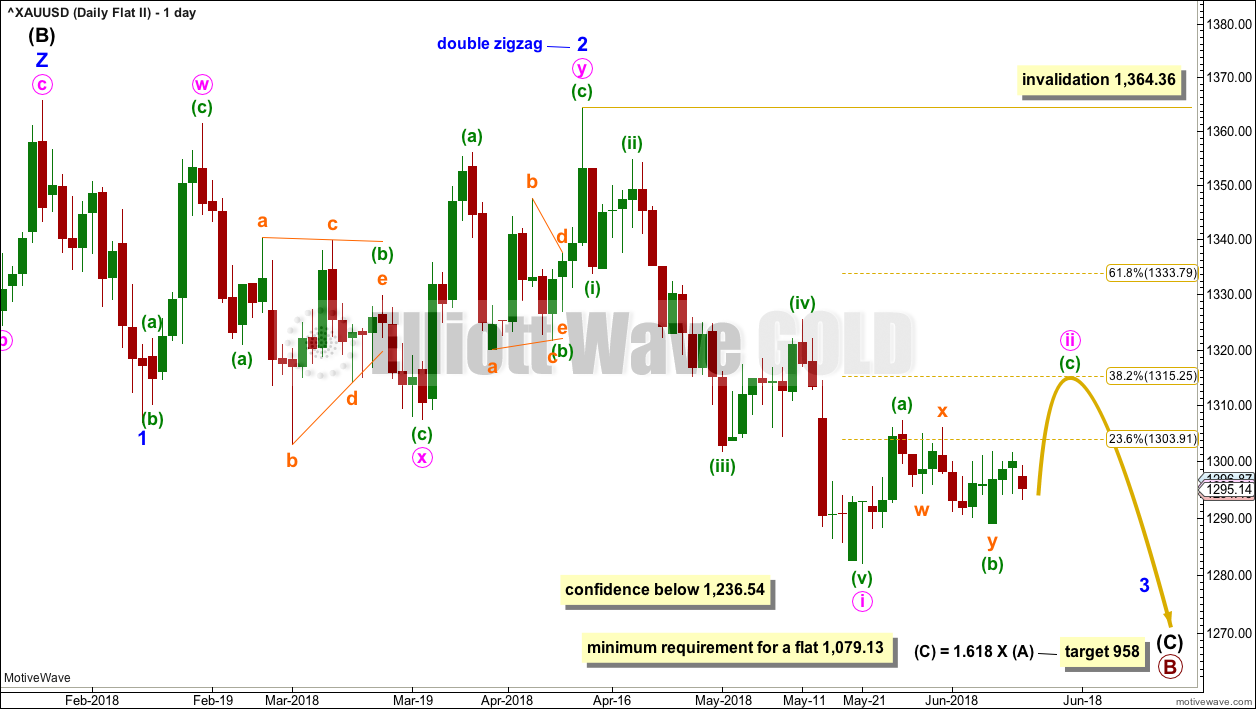
Minor wave 1 may have been a relatively brief impulse over at the low of the 8th of February.
Minor wave 2 may be over at the last high as a double zigzag. All subdivisions fit and all Elliott wave rules are met. The second zigzag in the double does deepen the correction, which is its purpose, although it is not by very much.
It is possible that a third wave, minor wave 3, began at the last high labelled minor wave 2. Minor wave 3 may only subdivide as an impulse.
Within minor wave 3, minute wave i may be over at the last low. Minute wave ii may be a multi day bounce or sideways movement that may end about the 0.382 or 0.618 Fibonacci ratios, but the pull of the middle of a third wave down may now force it to be more shallow than second wave corrections usually are; the 0.382 Fibonacci ratio may be slightly favoured.
Minute wave ii may not move beyond the start of minute wave i above 1,364.36.
TECHNICAL ANALYSIS
WEEKLY CHART
Click chart to enlarge. Chart courtesy of StockCharts.com.
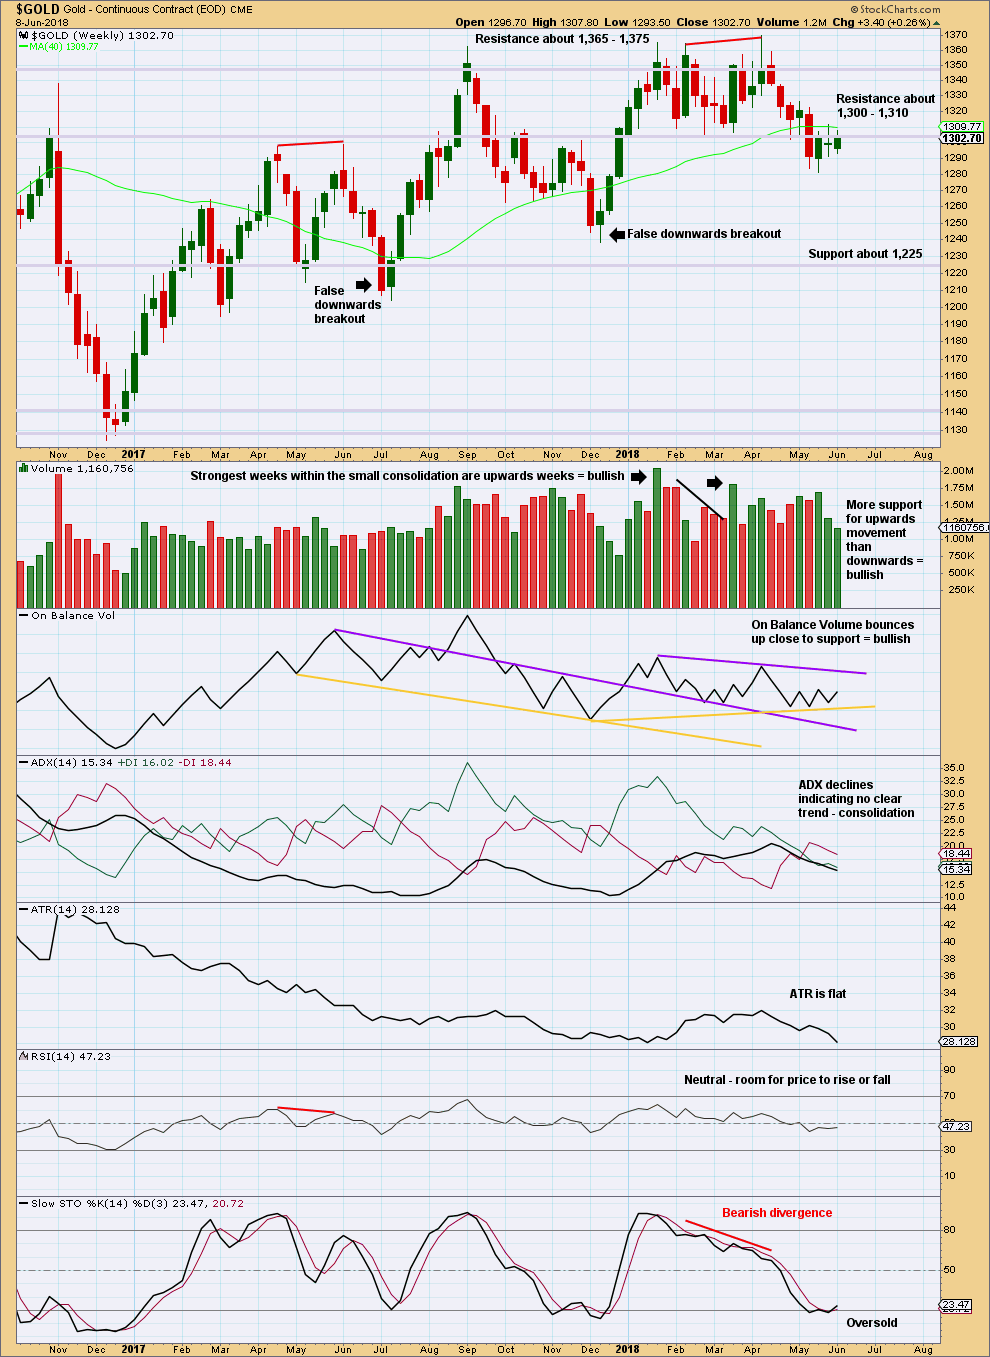
Price remains close to the resistance zone about 1,300 to 1,310. What looked like a possible downwards breakout now looks false. There are two recent examples on this chart, and this may be a third. In all three cases the consolidation prior to the possible downwards breakout had the strongest week as an upwards week, which was the clue that the downwards breakout may turn out to be false.
The strongest week during the last few weeks remains an upwards week. The short term volume profile remains overall bullish despite weak volume for this last week.
The bullish signal from On Balance Volume supports the main Elliott wave count.
DAILY CHART
Click chart to enlarge. Chart courtesy of StockCharts.com.
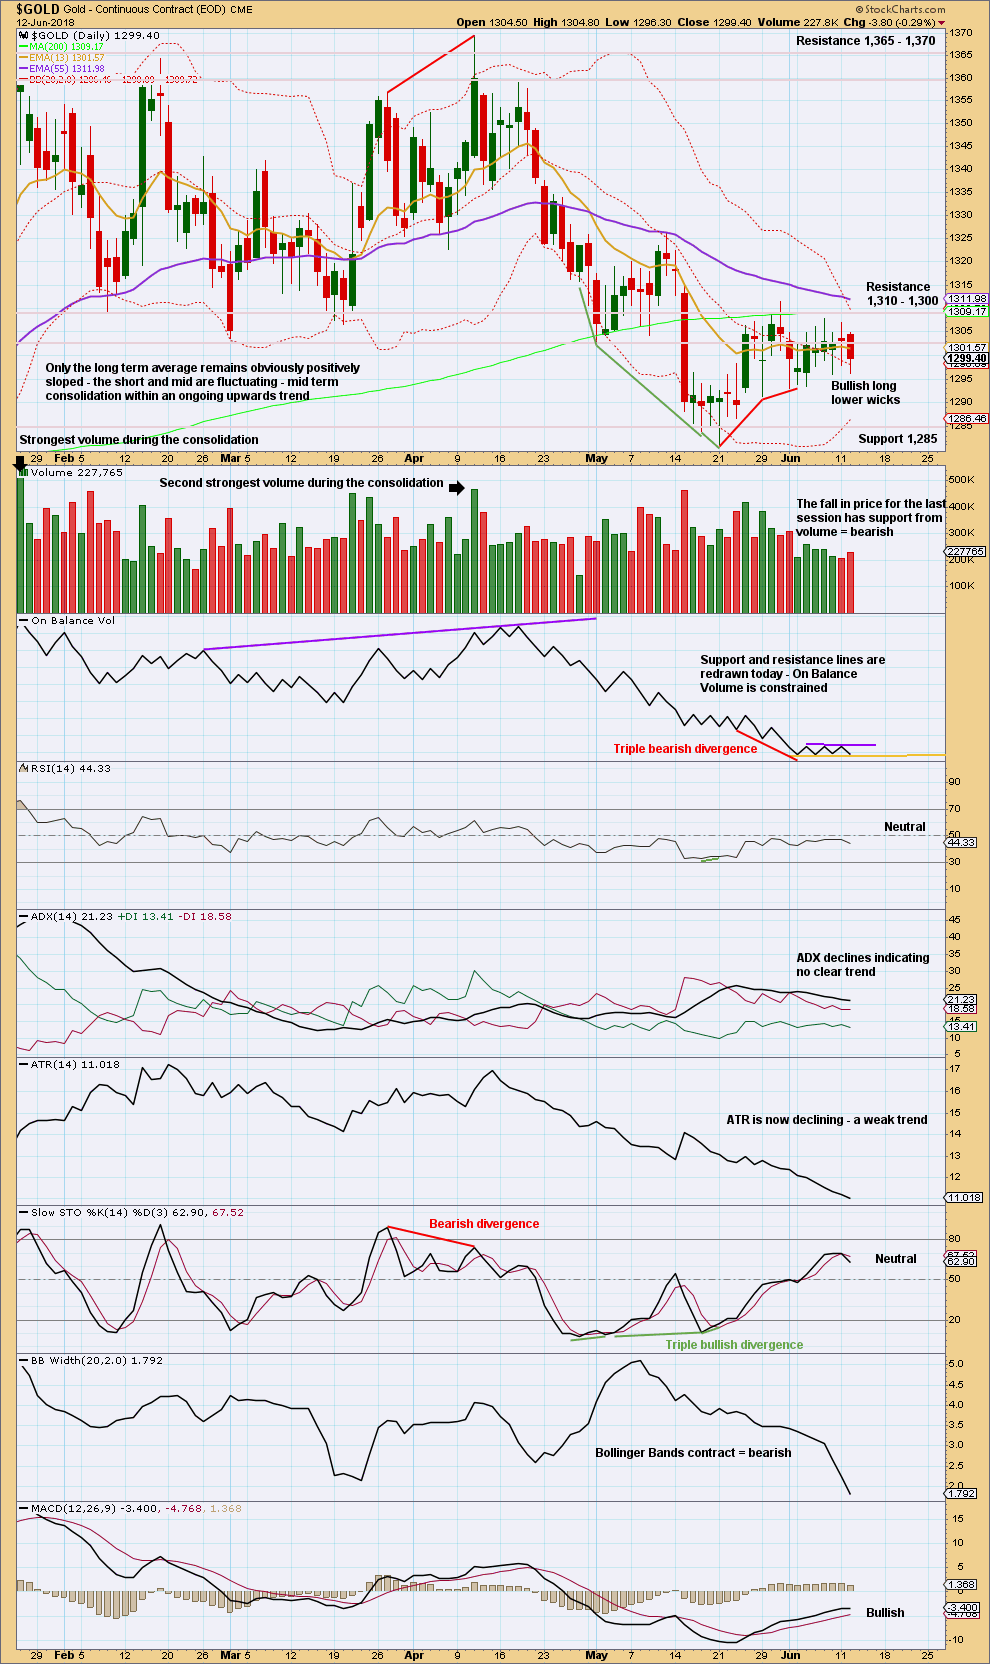
Since the last low now 16 days ago, it is an upwards day which has strongest volume. This suggests there is more support now for upwards movement.
On Balance Volume is judged to be neutral today. On Balance Volume may find support here and this may halt the fall in price. But if tomorrow moves price lower, then On Balance Volume may give a bearish signal.
It looks like the downwards breakout may have been false, but before that can properly be concluded price needs to close back above 1,310. It has not done that yet.
Let us look back at major lows from November 2015 and see how price behaved in the days immediately after.
A major low was found on the 3rd of December, 2015. The following day for the 4th of December saw a strong Bullish Engulfing reversal pattern with support from volume, and it came with strong double bullish divergence between price and both of RSI and Stochastics. That low in hindsight looks fairly strong.
Another reasonable low was found on the 31st of May, 2016. There was no reasonable bullish divergence at the low between price and either of RSI or Stochastics. At the low, the candlestick had a bullish long lower wick (although with a reasonable upper wick, it is not properly a Hammer reversal pattern). The two days following the low for the 1st and 2nd of June were inconclusive; both closed red and could at the time have been considered a potential bear flag pattern developing; both had a balance of volume downwards but showed strongly declining volume. Not until the third day, with a very strong upwards day with support from volume to complete a very strong Bullish Engulfing reversal pattern, was a low set in place.
A major low was found on the 15th of December, 2016. At the low, the candlestick had a somewhat bullish long lower wick; volume for the last downwards day supported the fall in price; and, there was clear and strong bullish divergence between price and RSI and Stochastics. The next two days closed green but did not have support from volume. The following two days closed red and did have support from volume. At that stage, four days out from a major low, the short term volume profile was bearish and it looked like a bear flag pattern may be developing. It was not until seven days after the low on the 27th of December that a reasonable bullish day unfolded, and even then it did not have good support from volume. This low did not look clear.
The next low to study occurred on the 10th of March, 2017. That day was inconclusive, closing green, but the balance of volume was downwards and volume supported that downwards movement. At the low, there was no reasonable bullish divergence between price and either of RSI or Stochastics. It was not until three days after the low on the 15th of March that price bounced strongly to complete a strong Bullish Engulfing reversal pattern, which had good support from volume.
The next low to study occurred on the 9th of May, 2017. On that day RSI reached oversold, but there was no divergence between it and price nor price and Stochastics. Right up until six days after the low the short term volume profile could have been judged to be bearish; rising price did not have support from volume. It was clear a low was in place on the 17th of May as a very strong Bullish Engulfing reversal pattern unfolded with strong support from volume. The small bounce up until that date could have been judged to be a bounce within an ongoing downwards trend.
The next low to study occurred on the 10th of July, 2017. There was no divergence at the low between price and RSI, but there was strong clear bullish divergence between price and Stochastics. There were two candlesticks with bullish long lower wicks at the low, but volume remained lighter than the prior downwards day of the 9th of July. This looks like a selling climax in hindsight, but at the time it could have been judged to support downwards movement. Right up until the 14th of July, five days after the low, it could have been considered a bear flag pattern unfolding. On the 14th of July a strong Bullish Engulfing pattern unfolded with some support from volume.
The last low to study is a very important one on the 12th of December, 2017. This occurred after a downwards breakout below support, which was previously at 1,262. That downwards breakout was short lived; price remained below support for two weeks, and found a low only five days after the breakout. At the low, there was no bullish divergence between price and either of RSI or Stochastics. The first upwards day on the 13th of December had a wide range but a very small real body. It did have good support from volume, but volume remained lighter than most prior downwards days. After that low, price moved steadily higher for weeks, initially on light and declining volume. That low in hindsight was very difficult to pick.
Some conclusions may be drawn in relation to the current situation. The first and strongest conclusion is that lows for Gold (at least for the last two years and five months) are not always very clear at the time. Price can be weak in days immediately following lows; it can remain weak for about five to seven days following lows. Lows do not always come with divergence between price and RSI nor even price and Stochastics, but when they do that offers a clue.
Although the last few days have seen unexpected downwards movement, some suspicion may be had that this is a downwards breakout. ADX at this time indicates a downward trend is in place, but this is a lagging indicator. Look out for at least a short term bounce here, and do not be surprised if it begins to show some strength towards the end of this week. If it remains persistently weak, then short positions may be taken for a downwards trend (the new labelling for the fifth wave count could be correct). If it shows strength, that would support the first wave count; the downwards breakout may have been yet another false breakout.
The last low 16 days ago has triple bullish divergence with price. Considering volume was bullish during the last consolidation, and Gold has a recent history of false downwards breakouts following that set up, the last low may be the end of a false downwards breakout.
GDX WEEKLY CHART
Click chart to enlarge. Chart courtesy of StockCharts.com.
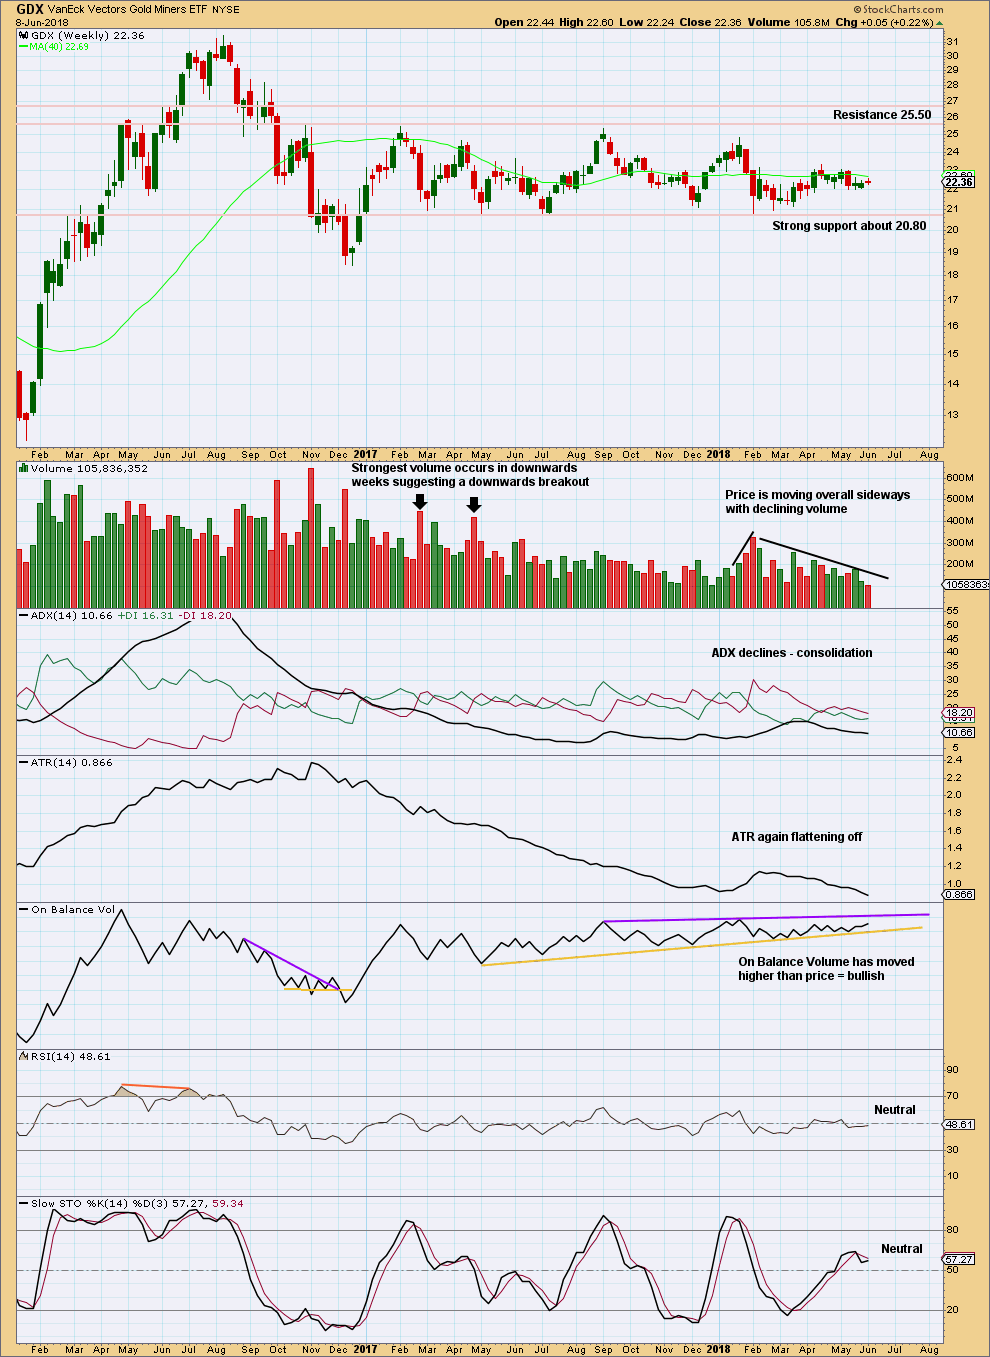
Support about 20.80 has been tested about eight times and so far has held. The more often a support area is tested and holds, the more technical significance it has.
In the first instance, expect this area to continue to provide support. Only a strong downwards day, closing below support and preferably with some increase in volume, would constitute a downwards breakout from the consolidation that GDX has been in for a year now.
Resistance is about 25.50. Only a strong upwards day, closing above resistance and with support from volume, would constitute an upwards breakout.
Overall, a slow upwards swing may be underway. Do not expect it to move in a straight line; it may have downwards weeks within it.
GDX DAILY CHART
Click chart to enlarge. Chart courtesy of StockCharts.com.
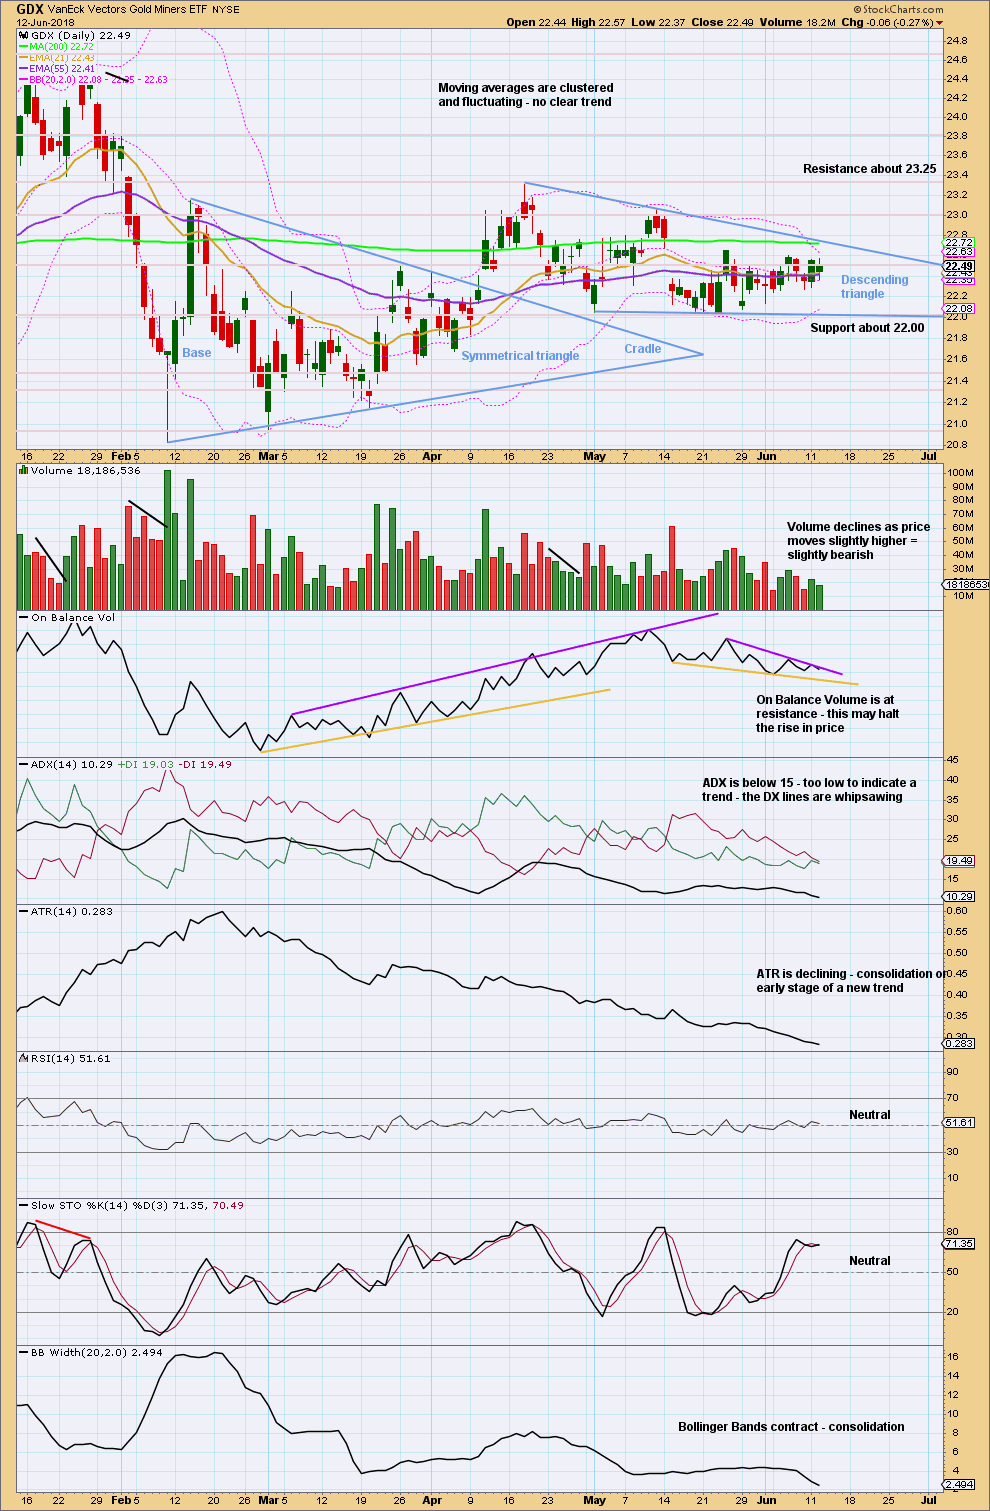
Support here about 22.00 has been tested now five times in recent weeks and has held. The more often a price point is tested for resistance or support and holds, the stronger the technical significance at that point.
A descending triangle may be completing. A break above resistance or below support would signal an end to the triangle and a possible new trend. Watch On Balance Volume carefully for a signal.
During the descending triangle, it is a downwards day that has strongest volume. This suggests a downwards breakout may be more likely than upwards. A measured rule target would be about 20.74.
Published @ 11:57 p.m. EST.
Anyone knows what happened to PMbull.com today? That was my go to for live gold/silver prices
Don’t know. Maybe a temporary issue?
Try Tradingview.com You can use for free and even save a limited # of charts for free. With all the charts I save, I became a member to avoid ads and save more charts.
You can also try Investing.com, but their charts are powered by Trading View.
Or use BarChart.com to follow Lara’s data. I think this links to the symbol she uses.
https://www.barchart.com/forex/quotes/%5EXAUUSD/interactive-chart
The trading session ended today a mixed bag after some small gyrations.
Silver strong, yet Gold and GDX remain constrained with both triangles still valid.
Looks like we need to wait a bit longer to see which way they break.
I did notice GDXJ acted stronger. It had an outside day moving up…
Let’s see if silver and GDXJ have been giving the right signals. I loaded up on GDXJ at the lows today, but ready to get out of it in a snap!
Updated hourly chart:
Dreamer, thanks for you continuous posting of the triangle count. It may be very valid…
I have a feeling the FED might not raise rates as everyone and their grandparents are saying… The economic adviser Larry Kudlow used to say when he had his own show on CNBC to “let her rip…” on the economy, meaning the FED need not to raise as often as they have been. With the tariff talks picking up steam, trouble in EU (Italy), and some housing market soft spots… they might just leave the rates alone this one time.
If rate hike does happen, I can see your triangle forming. If no rate hike, I can see Lara’s count as two second wave corrections powering us to 1330 in short order…
Either way in the medium term precious metals are bullish. Silver and Palladium are leading the way, and with gold being this long of a time (about 3 weeks) under 1300, GDX has been consolidating mostly between 22.20-22.50, and didn’t even come close really to closing under 22…
We’ll see what materializes at 2pm ET. I’m ready to make a move 🙂
Good luck everybody…
PS: I hope this forum picks up after the FED meeting. I miss everyone’s input on here…
So much for my prediction skills. Not only did we get a hike, but also likely 2 more coming :-/
Over the years I have noticed that the activity in comments does directly correspond to market behaviour.
Every time Gold spends a reasonable time (weeks to months) in a consolidation, the activity drops off.
When Gold trends, it picks up again.
This also corresponds to the membership numbers. Lots of people leave when Gold is consolidating, and they come back again when it trends. But when they do that, they miss the end of the consolidation and so they’re not positioned as early as members who stay. If I get the end of the correction analysis correct and the breakout direction correct that is.
Well, I’m happy I’m always here…
🙂
I am too Ari
And here’s the GDX hourly
https://www.tradingview.com/x/XkfUnZ9n/
It looks like the triangles I have been watching for Gold & GDX may be complete today. Perfect timing for the FED meeting. Isn’t it interesting how the timing on these work out?
Looking for a sharp move down to last likely 1-3 days before a significant bottom forms. Let’s see how things play out.
https://www.tradingview.com/x/MtMXOtxC/
Thank you as always Dreamer for sharing your charts.
I agree, it’s really interesting how events like FED meetings fit EW counts perfectly so often. It’d be easier for Gold of course if we had just one high probability count. But we don’t.