

S&P 500
Upwards movement continues exactly as the main Elliott wave count and classic technical analysis expect. When classic technical analysis offers strong support to the Elliott wave count, then confidence may be had in the analysis overall.
Summary: The short term target is at 2,824 or 2,915. The mid to longer term target is at 2,922 (Elliott wave) or 3,045 (classic analysis). The final target for this bull market to end remains at 3,616.
The Elliott wave count has good support from classic technical analysis. Price has support from rising market breadth and declining volatility and rising volume.
Pullbacks are an opportunity to join the trend. An upwards trend is expected to be developing. It is possible that upwards movement may show a further increase in momentum over the next several days.
Always practice good risk management. Always trade with stops and invest only 1-5% of equity on any one trade.
The biggest picture, Grand Super Cycle analysis, is here.
Last historic analysis with monthly charts is here, video is here.
ELLIOTT WAVE COUNT
WEEKLY CHART
Click chart to enlarge.
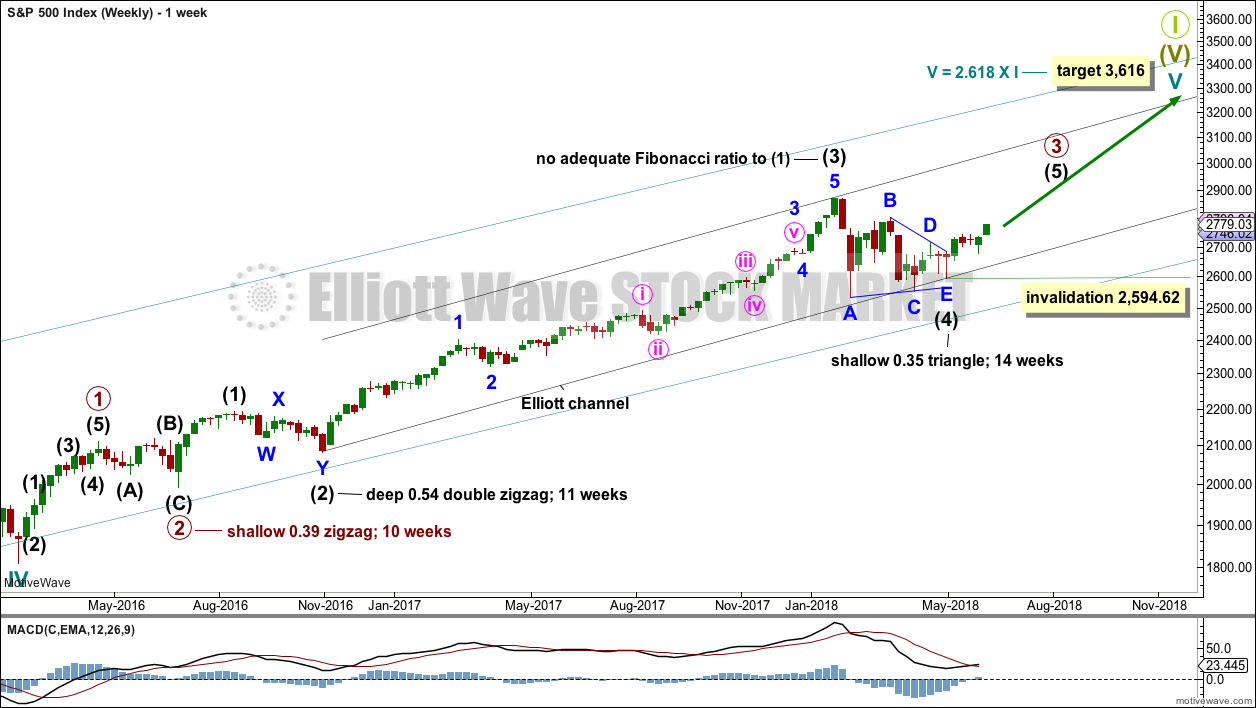
Cycle wave V must complete as a five structure, which should look clear at the weekly chart level and also now at the monthly chart level. It may only be an impulse or ending diagonal. At this stage, it is clear it is an impulse.
Within cycle wave V, the third waves at all degrees may only subdivide as impulses.
Intermediate wave (4) has breached an Elliott channel drawn using Elliott’s first technique. The channel is redrawn using Elliott’s second technique: the first trend line from the ends of intermediate waves (2) to (4), then a parallel copy on the end of intermediate wave (3). Intermediate wave (5) may end either midway within the channel, or about the upper edge.
Intermediate wave (4) may now be a complete regular contracting triangle lasting fourteen weeks, one longer than a Fibonacci thirteen. There is perfect alternation and excellent proportion between intermediate waves (2) and (4).
If intermediate wave (4) were to continue further as either a flat or combination, both possibilities would require another deep pullback to end at or below 2,532.69. With both On Balance Volume and the AD line making new all time highs, that possibility looks extremely unlikely.
If intermediate wave (4) were to continue further, it would now be grossly disproportionate to intermediate wave (2). Both classic technical analysis and Elliott wave analysis now suggest these alternate ideas should be discarded based upon a very low probability.
Within intermediate wave (5), no second wave correction may move beyond the start of its first wave below 2,594.62.
DAILY CHART
Click chart to enlarge.
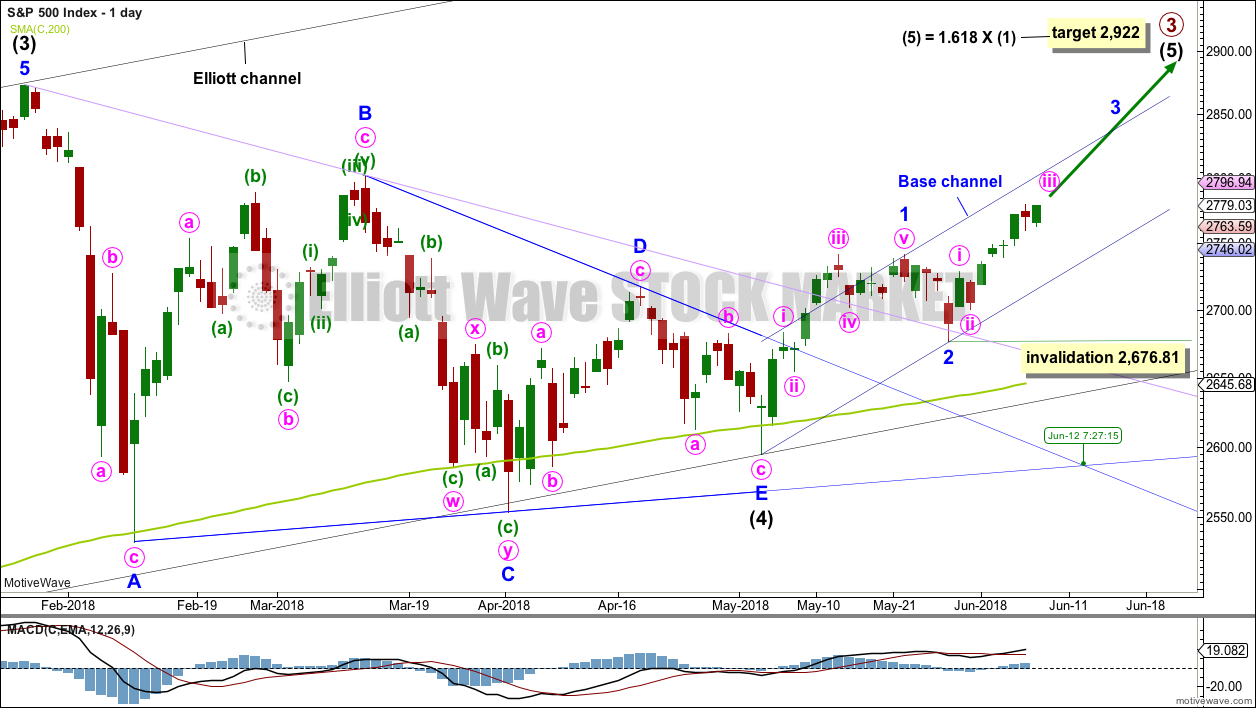
It is possible that intermediate wave (4) is a complete regular contracting triangle, the most common type of triangle. Minor wave E may have found support just below the 200 day moving average and ending reasonably short of the A-C trend line. This is the most common look for E waves of triangles.
Intermediate wave (3) exhibits no Fibonacci ratio to intermediate wave (1). It is more likely then that intermediate wave (5) may exhibit a Fibonacci ratio to either of intermediate waves (1) or (3). The most common Fibonacci ratio would be equality in length with intermediate wave (1), but in this instance that would expect a truncation. The next common Fibonacci ratio is used to calculate a target for intermediate wave (5) to end.
Price has clearly broken out above the upper triangle B-D trend line. This indicates that it should now be over if the triangle is correctly labelled.
A trend line in lilac is added to this chart. It is the same line as the upper edge of the symmetrical triangle on the daily technical analysis chart. Price has found support about this line at the last two small swing lows. The suppport at this line has reasonable technical significance now that it has been tested twice, and this line should be assumed to continue to provide support until proven otherwise.
Sometimes the point at which the triangle trend lines cross over sees a trend change. A trend change at that point may be a minor one or a major one. That point is now about the 12th of June, but may change to the 14th of June on Monday because MotiveWave does not allow for weekends to print no candlesticks.
Minor wave 3 may only subdivide as an impulse, and within it the subdivisions of minute waves ii and iv may show up as one or more red daily candlesticks or doji.
Within minor wave 3, no second wave correction may move beyond the start of its first wave below 2,676.81. Along the way up, any deeper corrections may now find support at the lower edge of the base channel drawn about minor waves 1 and 2. Minor wave 3 may have the power to break above the upper edge of the base channel. If it does, then that upper edge may then provide support.
TECHNICAL ANALYSIS
WEEKLY CHART
Click chart to enlarge. Chart courtesy of StockCharts.com.
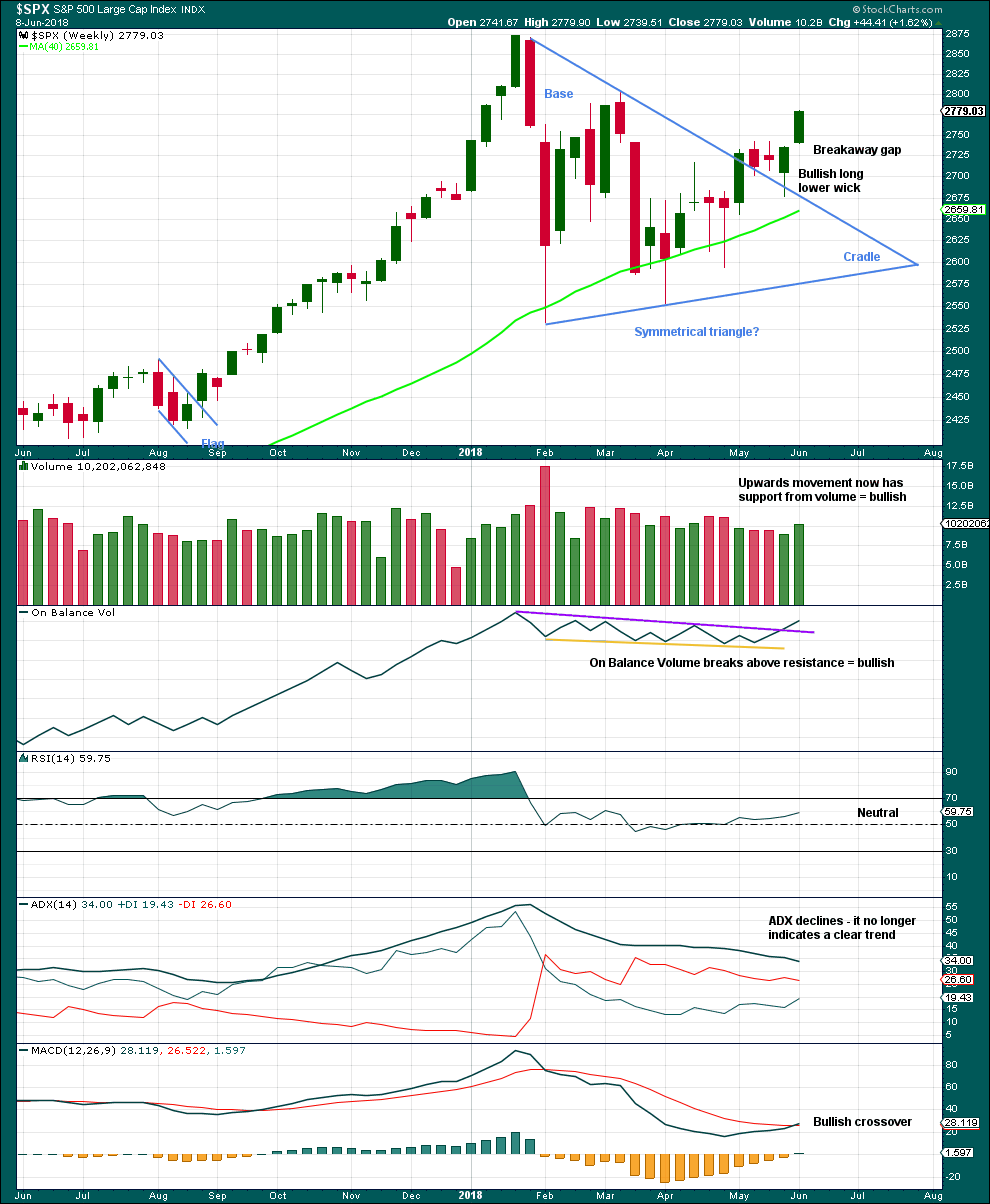
This week closes very bullish with support from volume. The gap open this week moves up from a small three week consolidation, so it may be a breakaway gap; if this is correct, then the lower edge may provide support at 2,736.93.
The bullish signal from On Balance Volume is now very clear. If next week sees On Balance Volume move higher again, then it may make a new all time high; if it does, then that would be a very bullish signal.
Overall, this chart is fairly bullish.
DAILY CHART
Click chart to enlarge. Chart courtesy of StockCharts.com.
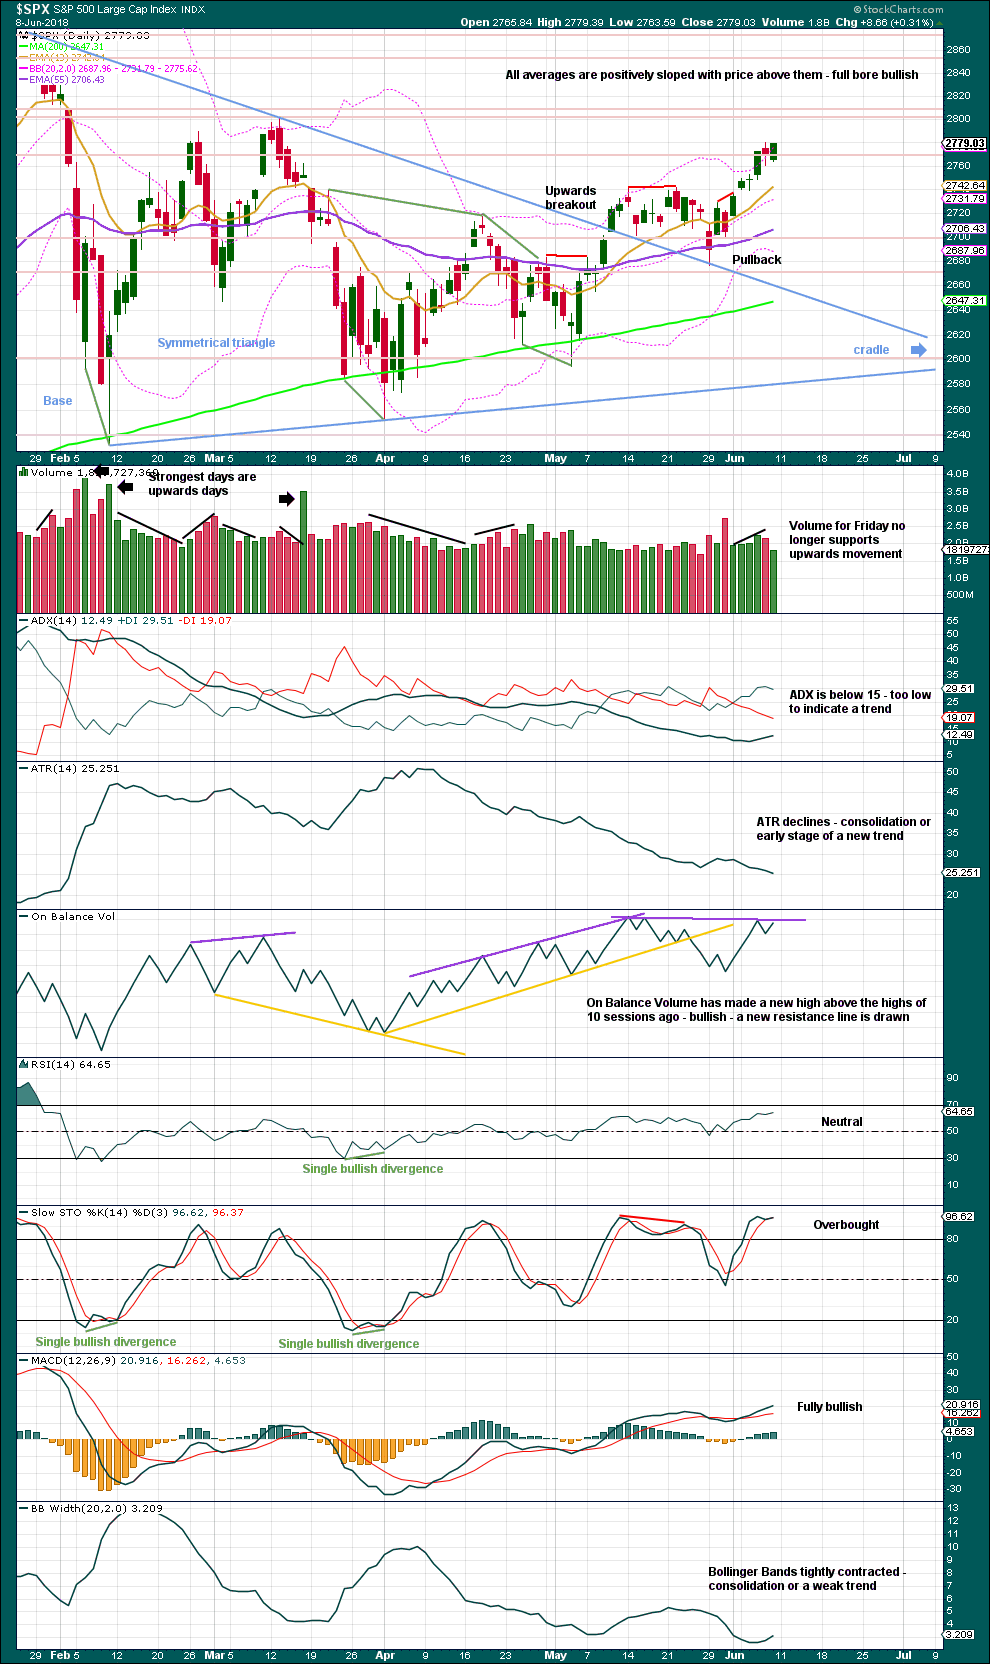
The symmetrical triangle may now be complete, and price has completed an upwards breakout. There may be some small cause for concern that the upwards breakout does not have support from volume. However, in current market conditions only some small concern is had here. Rising price on light and declining volume has been a feature of this market for years, yet price continues to rise.
After an upwards breakout, pullbacks occur 59% of the time. The pullback looks typical. With price now moving up and away from the line, it does look like the pullback may be over.
On Balance Volume made a new all time high on the 14th of May at the daily chart level. This signal remains overall very bullish.
The base distance is 340.18. Added to the breakout point of 2,704.54 this gives a target at 3,044.72. This is above the Elliott wave target at 2,922, so the Elliott wave target may be inadequate.
On Balance Volume remains slightly bearish for the short term as it still has not made a new high above the prior swing high of the 14th of May while price has, but the difference for On Balance Volume is so very slight no weight will be given to this in today’s analysis.
There is no new divergence between price and On Balance Volume. Friday’s candlestick is very bullish.
Stochastics may remain overbought for a reasonable period of time during a bull trend for this market.
VOLATILITY – INVERTED VIX CHART
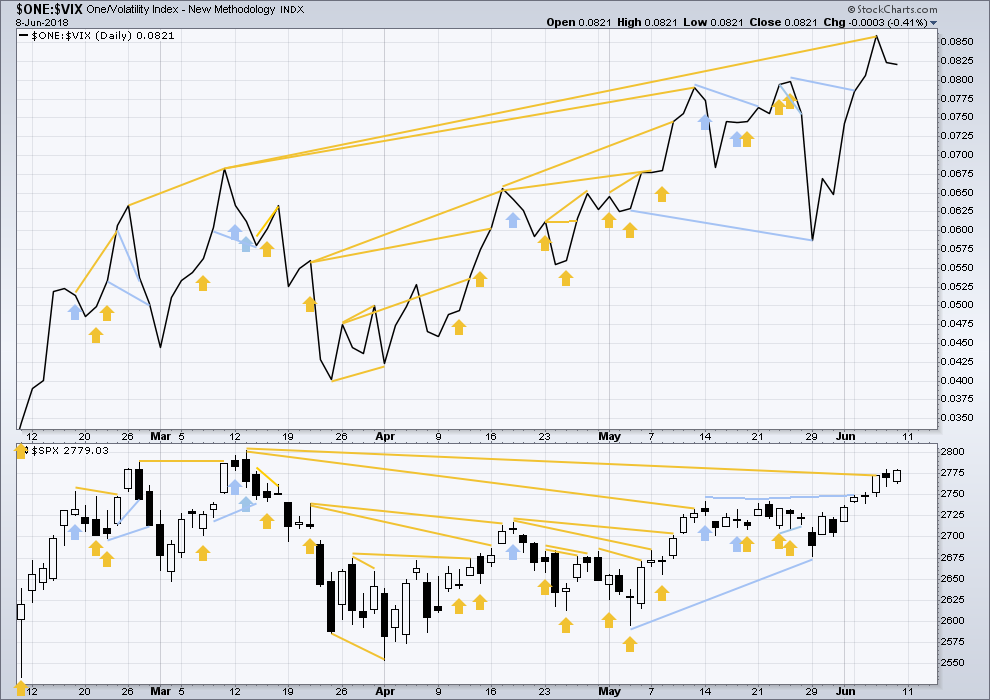
Click chart to enlarge. Chart courtesy of StockCharts.com. So that colour blind members are included, bearish signals
will be noted with blue and bullish signals with yellow.
Normally, volatility should decline as price moves higher and increase as price moves lower. This means that normally inverted VIX should move in the same direction as price.
Inverted VIX has made a new high above the prior swing high of the 9th of March, but price has not made a corresponding new swing high about the same point yet. This divergence is bullish. Inverted VIX is still a little way off making a new all time high.
There is no new divergence today.
BREADTH – AD LINE
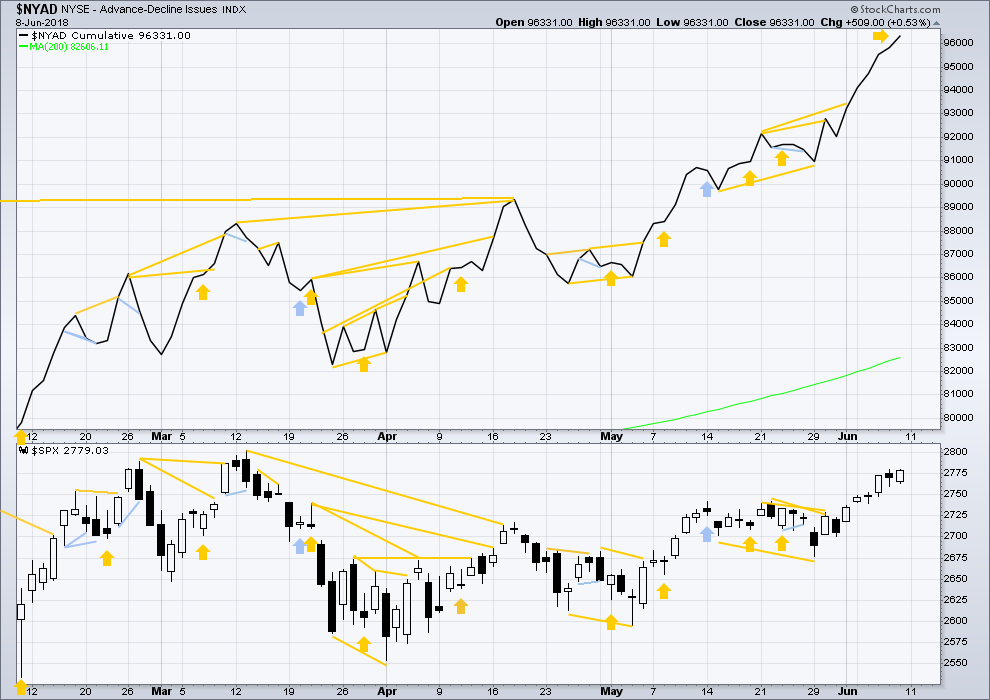
Click chart to enlarge. Chart courtesy of StockCharts.com.
There is normally 4-6 months divergence between price and market breadth prior to a full fledged bear market. This has been so for all major bear markets within the last 90 odd years. With no longer term divergence yet at this point, any decline in price should be expected to be a pullback within an ongoing bull market and not necessarily the start of a bear market. New all time highs from the AD line means that any bear market may now be an absolute minimum of 4 months away. It may of course be a lot longer than that. My next expectation for the end of this bull market may now be October 2019.
Small caps made a new all time high last week. Now mid caps make a new all time high this week. It is large caps that usually lag in the latter stages of a bull market, so this perfectly fits the Elliott wave count. Expect large caps to follow to new all time highs.
Breadth should be read as a leading indicator.
The AD line is daily making new all time highs. This is a very bullish signal and will be given the most weight in today’s analysis. Price is likely to follow within days or a very few weeks.
DOW THEORY
The following lows need to be exceeded for Dow Theory to confirm the end of the bull market and a change to a bear market:
DJIA: 23,360.29.
DJT: 9,806.79.
S&P500: 2,532.69.
Nasdaq: 6,630.67.
Only Nasdaq at this stage is making new all time highs. DJIA and DJT need to make new all time highs for the ongoing bull market to be confirmed.
GOLD
A small inside day closes green. Upwards movement overall fits with expectations for the main Elliott wave count.
Summary: The target is now 1,411. Triple bullish divergence between price and Stochastics suggest a low may be in place here or very soon. There is a breach of the channel about the last downwards sloping movement on the daily chart; this adds a little confidence to the main Elliott wave count.
Price is finding strong resistance at 1,310 – 1,300. If this can be overcome, then a trend may be able to build strength.
Always trade with stops to protect your account. Risk only 1-5% of equity on any one trade.
Grand SuperCycle analysis is here.
Last in-depth historic analysis with monthly and several weekly charts is here, video is here.
There are multiple wave counts at this time at the weekly and monthly chart levels. In order to make this analysis manageable and accessible only two will be published on a daily basis, one bullish and one bearish. This does not mean the other possibilities may not be correct, only that publication of them all each day is too much to digest. At this stage, they do not diverge from the two possibilities below.
BULLISH ELLIOTT WAVE COUNT
FIRST WEEKLY CHART
Click chart to enlarge.
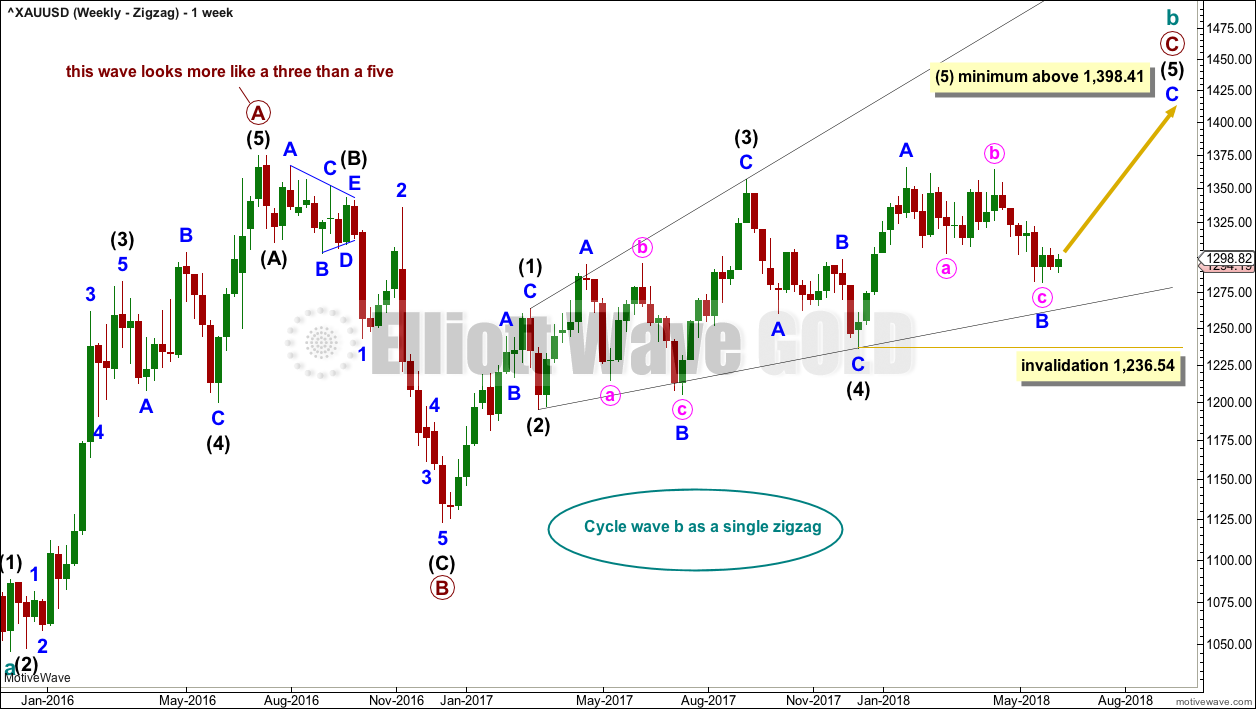
Cycle wave b may be a single zigzag. Zigzags subdivide 5-3-5. Primary wave C must subdivide as a five wave structure and may be either an impulse or an ending diagonal. Overlapping at this stage indicates an ending diagonal.
Within an ending diagonal, all sub-waves must subdivide as zigzags. Intermediate wave (4) must overlap into intermediate wave (1) price territory. This diagonal is expanding: intermediate wave (3) is longer than intermediate wave (1) and intermediate wave (4) is longer than intermediate wave (2). Intermediate wave (5) must be longer than intermediate wave (3), so it must end above 1,398.41 where it would reach equality in length with intermediate wave (3).
Within the final zigzag of intermediate wave (5), minor wave B may not move beyond the start of minor wave A below 1,236.54. However, if it were now to turn out to be relatively deep, it should not get too close to this invalidation point as the lower (2)-(4) trend line should provide strong support. Diagonals normally adhere very well to their trend lines.
Within the diagonal of primary wave C, each sub-wave is extending in price and so may also do so in time. Within each zigzag, minor wave B may exhibit alternation in structure and may show an increased duration.
Within intermediate wave (1), minor wave B was a triangle lasting 11 days. Within intermediate wave (3), minor wave B was a regular flat lasting 60 days. Intermediate wave (5) is expected to be longer in price than intermediate wave (3), and it may also be longer in duration, and so minor wave B within it may also be longer in duration. If minor wave B is over, it would have lasted 82 days.
This first weekly chart sees the upwards wave labelled primary wave A as a five wave structure. It must be acknowledged that this upwards wave looks better as a three than it does as a five. The fifth weekly chart below will consider the possibility that it was a three.
FIRST DAILY CHART
Click chart to enlarge.
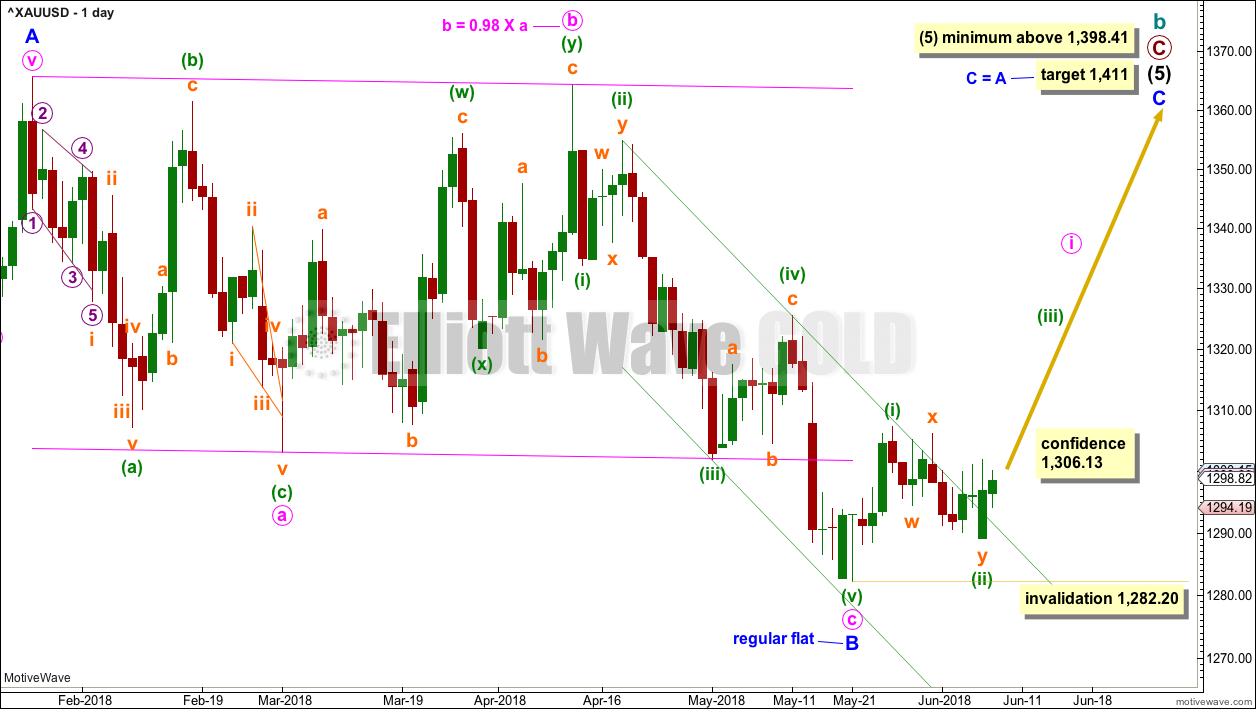
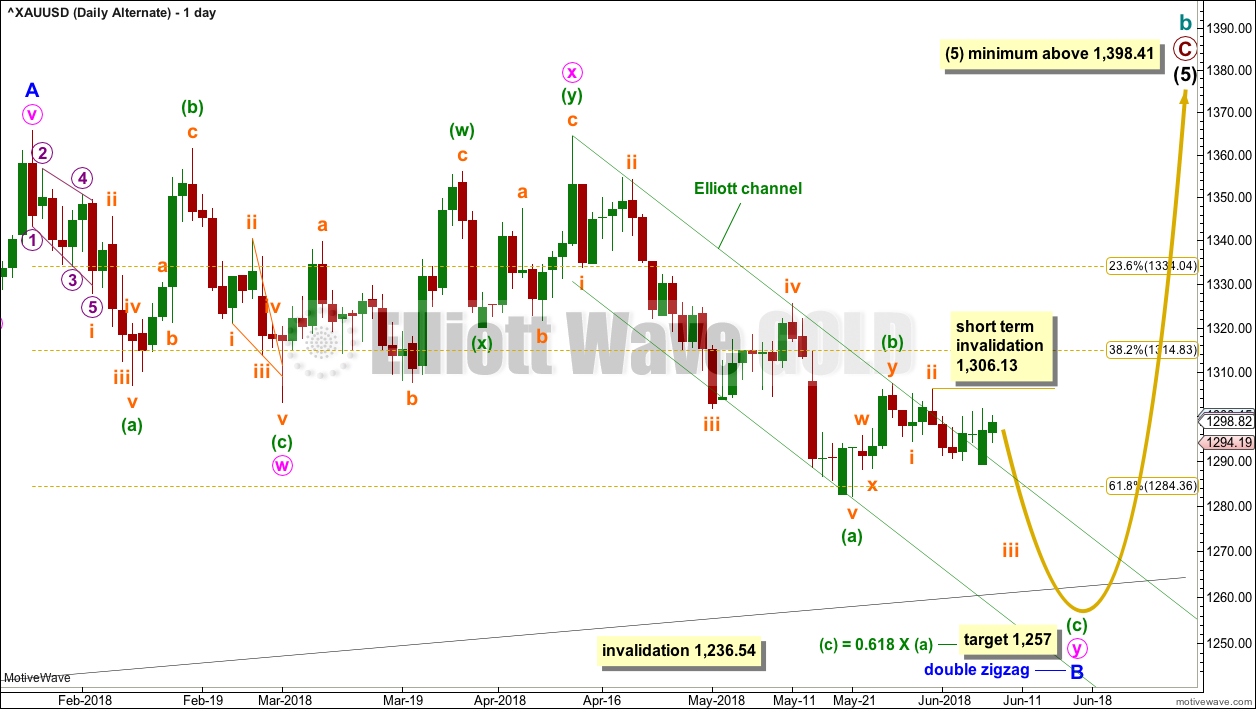
Minor wave B may be a complete regular flat correction. Minute wave c has overshot the lower trend line. Although this is not the most common look for a regular flat, it does sometimes happen. Minute wave c now looks like an obvious five wave structure at the daily chart level.
There is now one full daily candlestick above and not touching the upper edge of the channel which contains minute wave c. This indicates that the downwards wave labelled minute wave c may be over and a new wave upwards may have begun. Within minute wave c, minuette wave (ii) may not move beyond the start of minuette wave (i) below 1,282.20. The channel breach may give some confidence now in this wave count.
A new high above 1,306.13 would invalidate an alternate idea presented below. At that stage, reasonable confidence may be had in this main wave count.
The target for minor wave C is calculated using the most common Fibonacci ratio to minor wave A. This would see intermediate wave (5) reach beyond its minimum required length. All Elliott wave rules would be met.
ALTERNATE FIRST DAILY CHART
Click chart to enlarge.
Minor wave B may be a double zigzag, which may be close to completion.
The first zigzag in the double is labelled minute wave w. The double is joined by a three in the opposite direction, a double zigzag labelled minute wave x. The second zigzag in the double is labelled minute wave y, and it is deepening the correction, which is the purpose of second zigzags.
Minute wave y may end at support at the lower black (2)-(4) trend line, which is copied over here from the weekly chart. This is the lower diagonal trend line.
A target is calculated for minor wave B to end. This target is about where the lower diagonal trend line lies.
Within subminuette wave iii of minuette wave (c), no second wave correction may move beyond its start above 1,306.13.
The problem with this wave count is the depth of minute wave x. X waves within double zigzags are almost always brief and shallow, particularly shallow. This is because multiple zigzags should have a strong slope against the prior trend, and to achieve a strong slope their X waves should be shallow. When their X waves are deep and time consuming, as this one is, they lend more of a sideways look to the structure.
BEARISH ELLIOTT WAVE COUNT
FIFTH WEEKLY CHART
Click chart to enlarge.
There were five weekly charts published in the last historic analysis. This fifth weekly chart is the most immediately bearish wave count, so this is published as a bearish possibility.
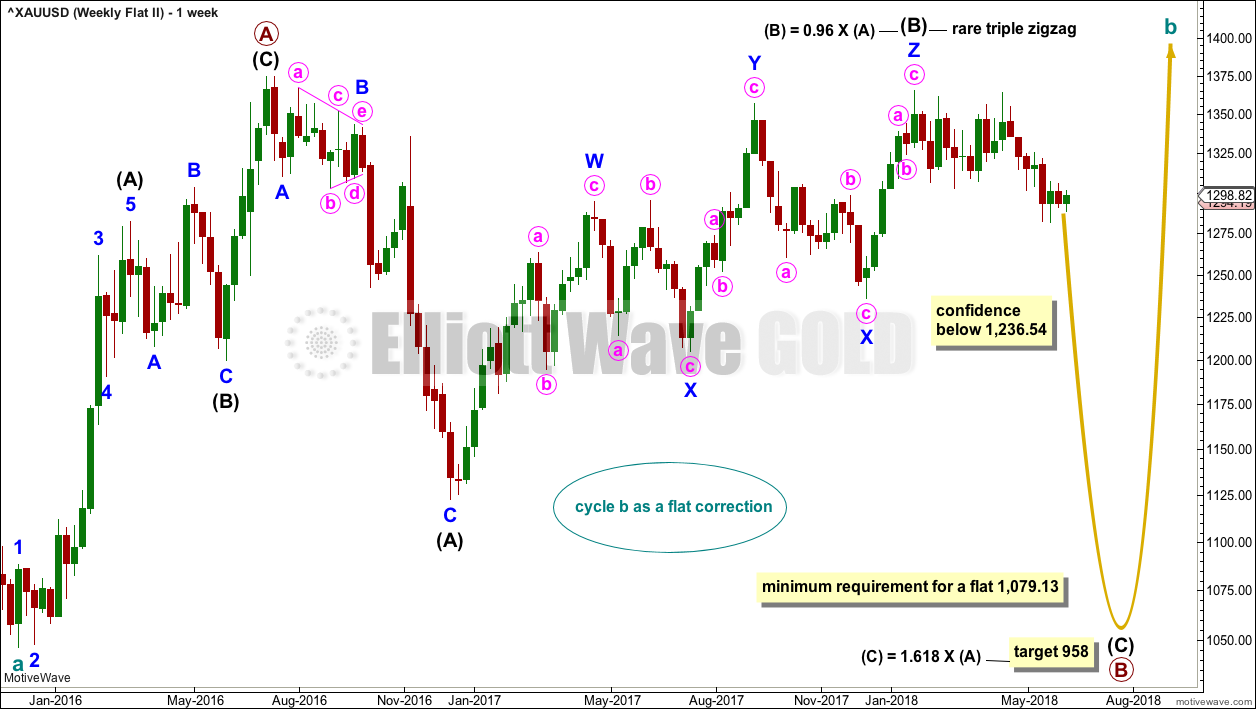
This fifth weekly chart sees cycle wave b as a flat correction.
If cycle wave b is a flat correction, then within it primary wave B must retrace a minimum 0.9 length of primary wave A at 1,079.13 or below. The most common length of B waves within flats is from 1 to 1.38 times the length of the A wave. The target calculated would see primary wave B end within this range.
Primary wave B may be subdividing as a regular flat correction, and within it both intermediate waves (A) and (B) subdivide as three wave structures. Intermediate wave (B) fits as a triple zigzag.
I have only seen two triple zigzags before during my 10 years of daily Elliott wave analysis. If this wave count turns out to be correct, this would be the third. The rarity of this structure is identified on the chart.
FIFTH DAILY CHART
Click chart to enlarge.
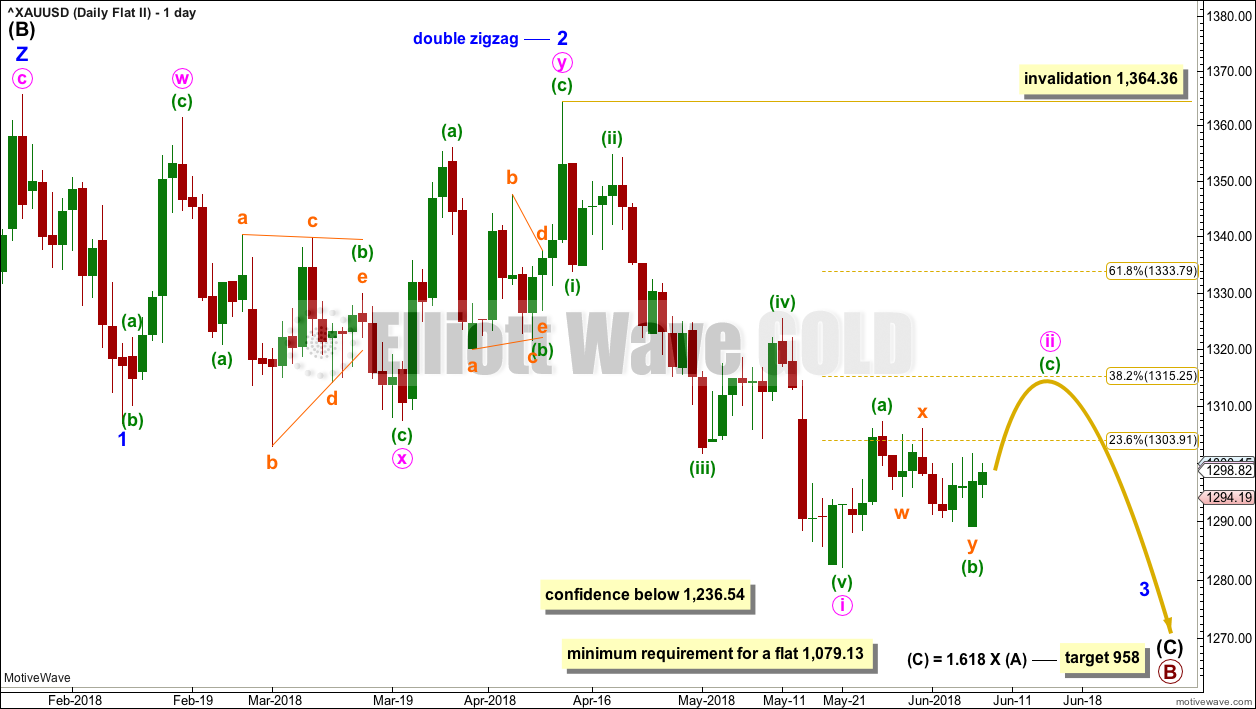
Minor wave 1 may have been a relatively brief impulse over at the low of the 8th of February.
Minor wave 2 may be over at the last high as a double zigzag. All subdivisions fit and all Elliott wave rules are met. The second zigzag in the double does deepen the correction, which is its purpose, although it is not by very much.
It is possible that a third wave, minor wave 3, began at the last high labelled minor wave 2. Minor wave 3 may only subdivide as an impulse.
Within minor wave 3, minute wave i may be over at the last low. Minute wave ii may be a multi day bounce or sideways movement that may end about the 0.382 or 0.618 Fibonacci ratios, but the pull of the middle of a third wave down may now force it to be more shallow than second wave corrections usually are; the 0.382 Fibonacci ratio may be slightly favoured.
Minute wave ii may not move beyond the start of minute wave i above 1,364.36.
TECHNICAL ANALYSIS
WEEKLY CHART
Click chart to enlarge. Chart courtesy of StockCharts.com.
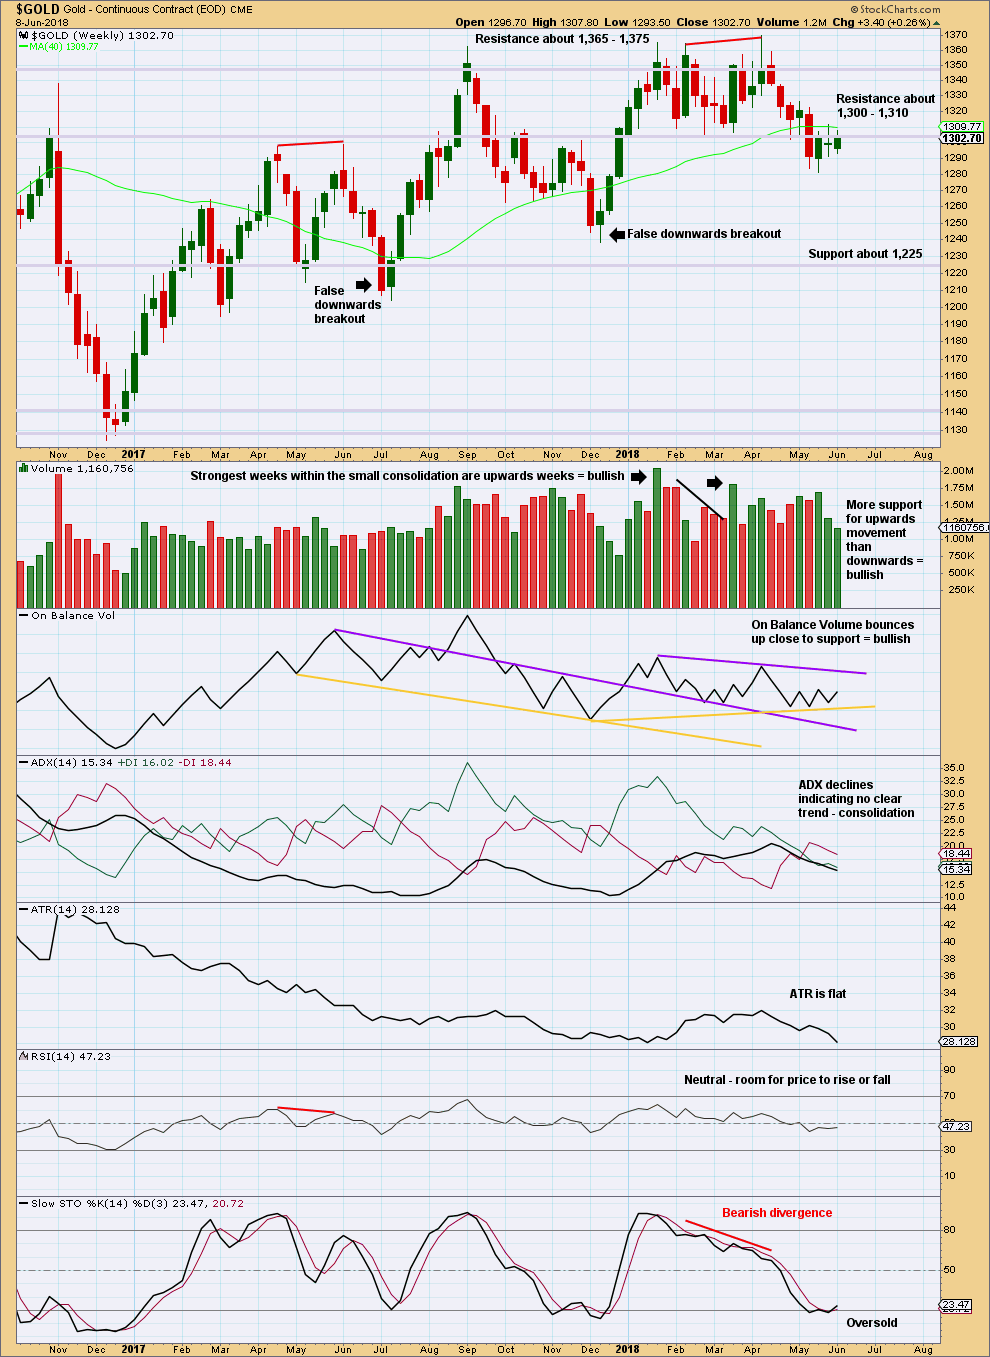
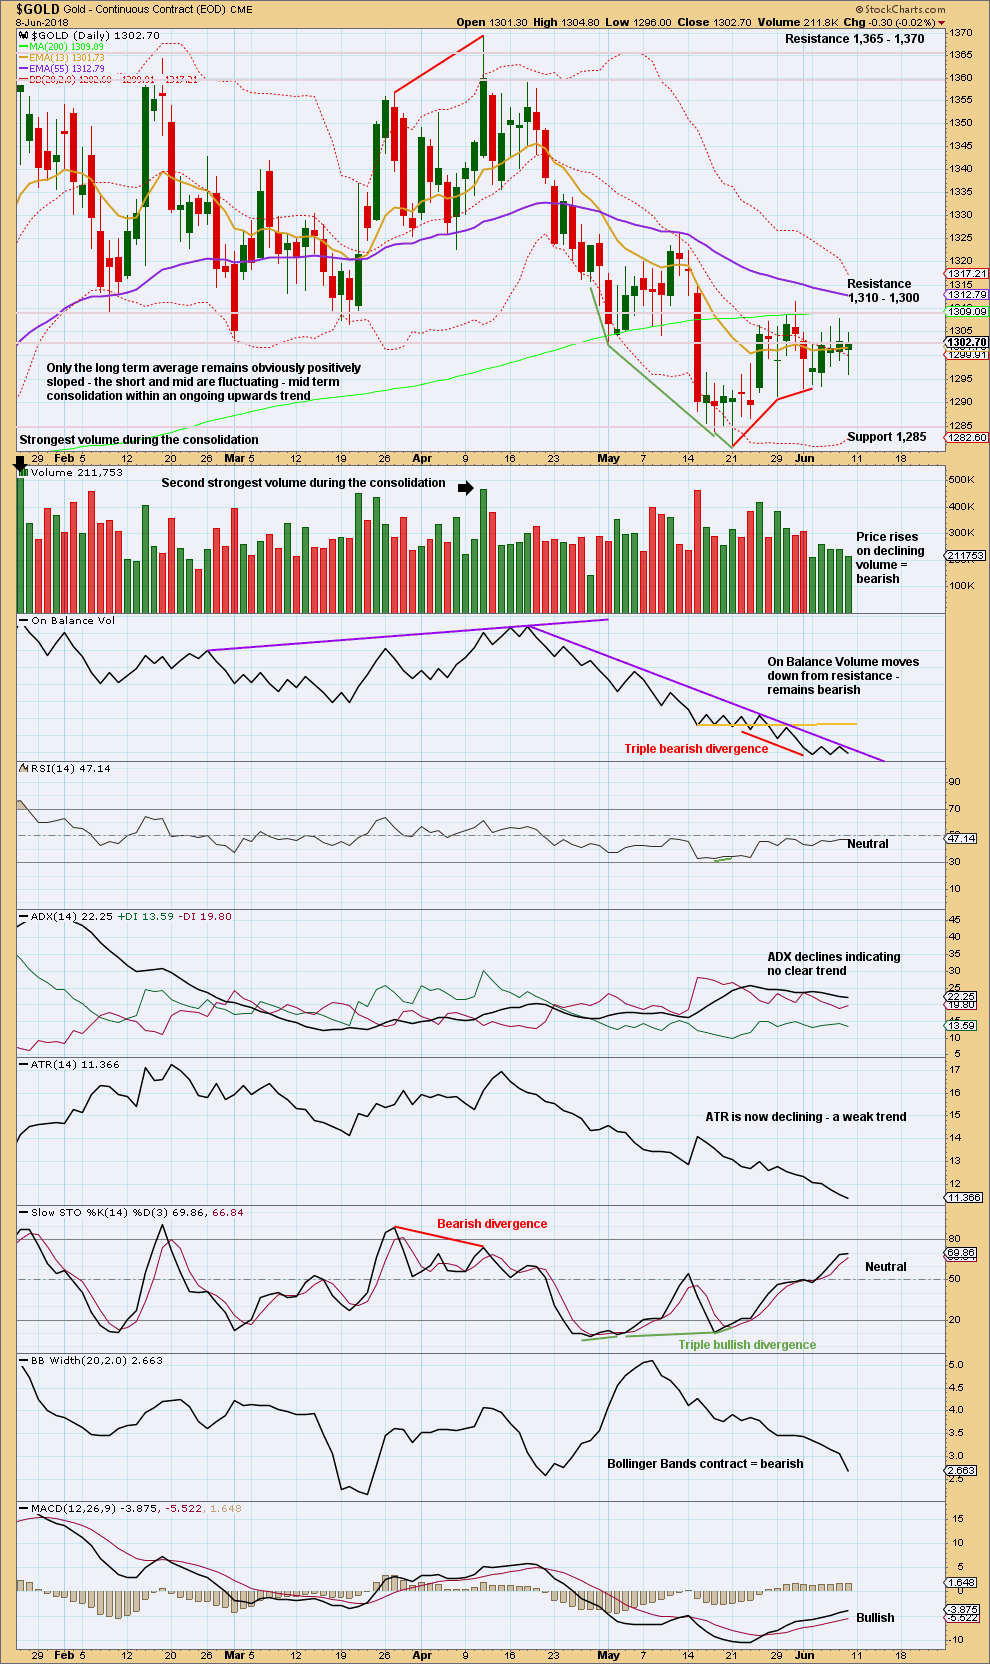
Price remains close to the resistance zone about 1,300 to 1,310. What looked like a possible downwards breakout now looks false. There are two recent examples on this chart, and this may be a third. In all three cases the consolidation prior to the possible downwards breakout had the strongest week as an upwards week, which was the clue that the downwards breakout may turn out to be false.
The strongest week during the last few weeks remains an upwards week. The short term volume profile remains overall bullish despite weak volume for this last week.
The bullish signal from On Balance Volume supports the main Elliott wave count this week.
DAILY CHART
Click chart to enlarge. Chart courtesy of StockCharts.com.
Since the last low now 14 days ago, it is an upwards day which has strongest volume. This suggests there is more support now for upwards movement. Price moved lower and the balance of volume was downwards for Friday. Volume for Friday does not support downwards movement during the session, which is slightly bullish, and in conjunction with the long lower candlestick wick for Friday it looks like Monday may move price higher.
On Balance Volume remains reasonably bearish. This puts some doubt at this time that a low may be in place. If On Balance Volume can break above resistance, that would provide a bullish signal.
It looks like the downwards breakout may have been false, but before that can properly be concluded price needs to close back above 1,310. It has not done that yet.
Let us look back at major lows from November 2015 and see how price behaved in the days immediately after.
A major low was found on the 3rd of December, 2015. The following day for the 4th of December saw a strong Bullish Engulfing reversal pattern with support from volume, and it came with strong double bullish divergence between price and both of RSI and Stochastics. That low in hindsight looks fairly strong.
Another reasonable low was found on the 31st of May, 2016. There was no reasonable bullish divergence at the low between price and either of RSI or Stochastics. At the low, the candlestick had a bullish long lower wick (although with a reasonable upper wick, it is not properly a Hammer reversal pattern). The two days following the low for the 1st and 2nd of June were inconclusive; both closed red and could at the time have been considered a potential bear flag pattern developing; both had a balance of volume downwards but showed strongly declining volume. Not until the third day, with a very strong upwards day with support from volume to complete a very strong Bullish Engulfing reversal pattern, was a low set in place.
A major low was found on the 15th of December, 2016. At the low, the candlestick had a somewhat bullish long lower wick; volume for the last downwards day supported the fall in price; and, there was clear and strong bullish divergence between price and RSI and Stochastics. The next two days closed green but did not have support from volume. The following two days closed red and did have support from volume. At that stage, four days out from a major low, the short term volume profile was bearish and it looked like a bear flag pattern may be developing. It was not until seven days after the low on the 27th of December that a reasonable bullish day unfolded, and even then it did not have good support from volume. This low did not look clear.
The next low to study occurred on the 10th of March, 2017. That day was inconclusive, closing green, but the balance of volume was downwards and volume supported that downwards movement. At the low, there was no reasonable bullish divergence between price and either of RSI or Stochastics. It was not until three days after the low on the 15th of March that price bounced strongly to complete a strong Bullish Engulfing reversal pattern, which had good support from volume.
The next low to study occurred on the 9th of May, 2017. On that day RSI reached oversold, but there was no divergence between it and price nor price and Stochastics. Right up until six days after the low the short term volume profile could have been judged to be bearish; rising price did not have support from volume. It was clear a low was in place on the 17th of May as a very strong Bullish Engulfing reversal pattern unfolded with strong support from volume. The small bounce up until that date could have been judged to be a bounce within an ongoing downwards trend.
The next low to study occurred on the 10th of July, 2017. There was no divergence at the low between price and RSI, but there was strong clear bullish divergence between price and Stochastics. There were two candlesticks with bullish long lower wicks at the low, but volume remained lighter than the prior downwards day of the 9th of July. This looks like a selling climax in hindsight, but at the time it could have been judged to support downwards movement. Right up until the 14th of July, five days after the low, it could have been considered a bear flag pattern unfolding. On the 14th of July a strong Bullish Engulfing pattern unfolded with some support from volume.
The last low to study is a very important one on the 12th of December, 2017. This occurred after a downwards breakout below support, which was previously at 1,262. That downwards breakout was short lived; price remained below support for two weeks, and found a low only five days after the breakout. At the low, there was no bullish divergence between price and either of RSI or Stochastics. The first upwards day on the 13th of December had a wide range but a very small real body. It did have good support from volume, but volume remained lighter than most prior downwards days. After that low, price moved steadily higher for weeks, initially on light and declining volume. That low in hindsight was very difficult to pick.
Some conclusions may be drawn in relation to the current situation. The first and strongest conclusion is that lows for Gold (at least for the last two years and five months) are not always very clear at the time. Price can be weak in days immediately following lows; it can remain weak for about five to seven days following lows. Lows do not always come with divergence between price and RSI nor even price and Stochastics, but when they do that offers a clue.
Although the last few days have seen unexpected downwards movement, some suspicion may be had that this is a downwards breakout. ADX at this time indicates a downward trend is in place, but this is a lagging indicator. Look out for at least a short term bounce here, and do not be surprised if it begins to show some strength towards the end of this week. If it remains persistently weak, then short positions may be taken for a downwards trend (the new labelling for the fifth wave count could be correct). If it shows strength, that would support the first wave count; the downwards breakout may have been yet another false breakout.
The last low 14 days ago has triple bullish divergence with price. Considering volume was bullish during the last consolidation, and Gold has a recent history of false downwards breakouts following that set up, the last low may be the end of a false downwards breakout.
GDX WEEKLY CHART
Click chart to enlarge. Chart courtesy of StockCharts.com.
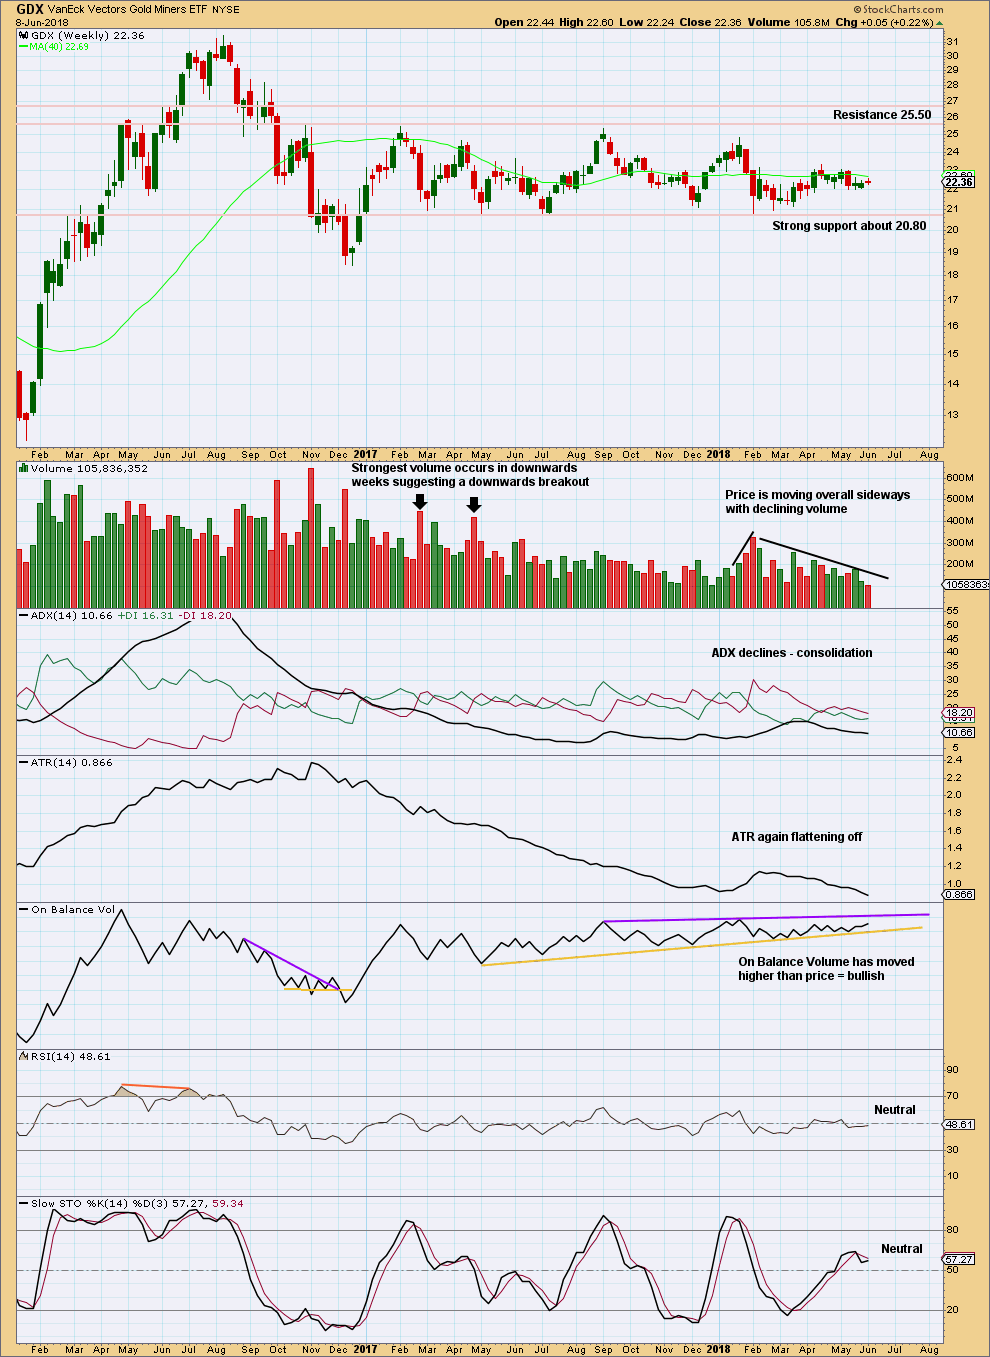
Support about 20.80 has been tested about eight times and so far has held. The more often a support area is tested and holds, the more technical significance it has.
In the first instance, expect this area to continue to provide support. Only a strong downwards day, closing below support and preferably with some increase in volume, would constitute a downwards breakout from the consolidation that GDX has been in for a year now.
Resistance is about 25.50. Only a strong upwards day, closing above resistance and with support from volume, would constitute an upwards breakout.
Overall, a slow upwards swing may be underway. Do not expect it to move in a straight line; it may have downwards weeks within it.
GDX DAILY CHART
Click chart to enlarge. Chart courtesy of StockCharts.com.
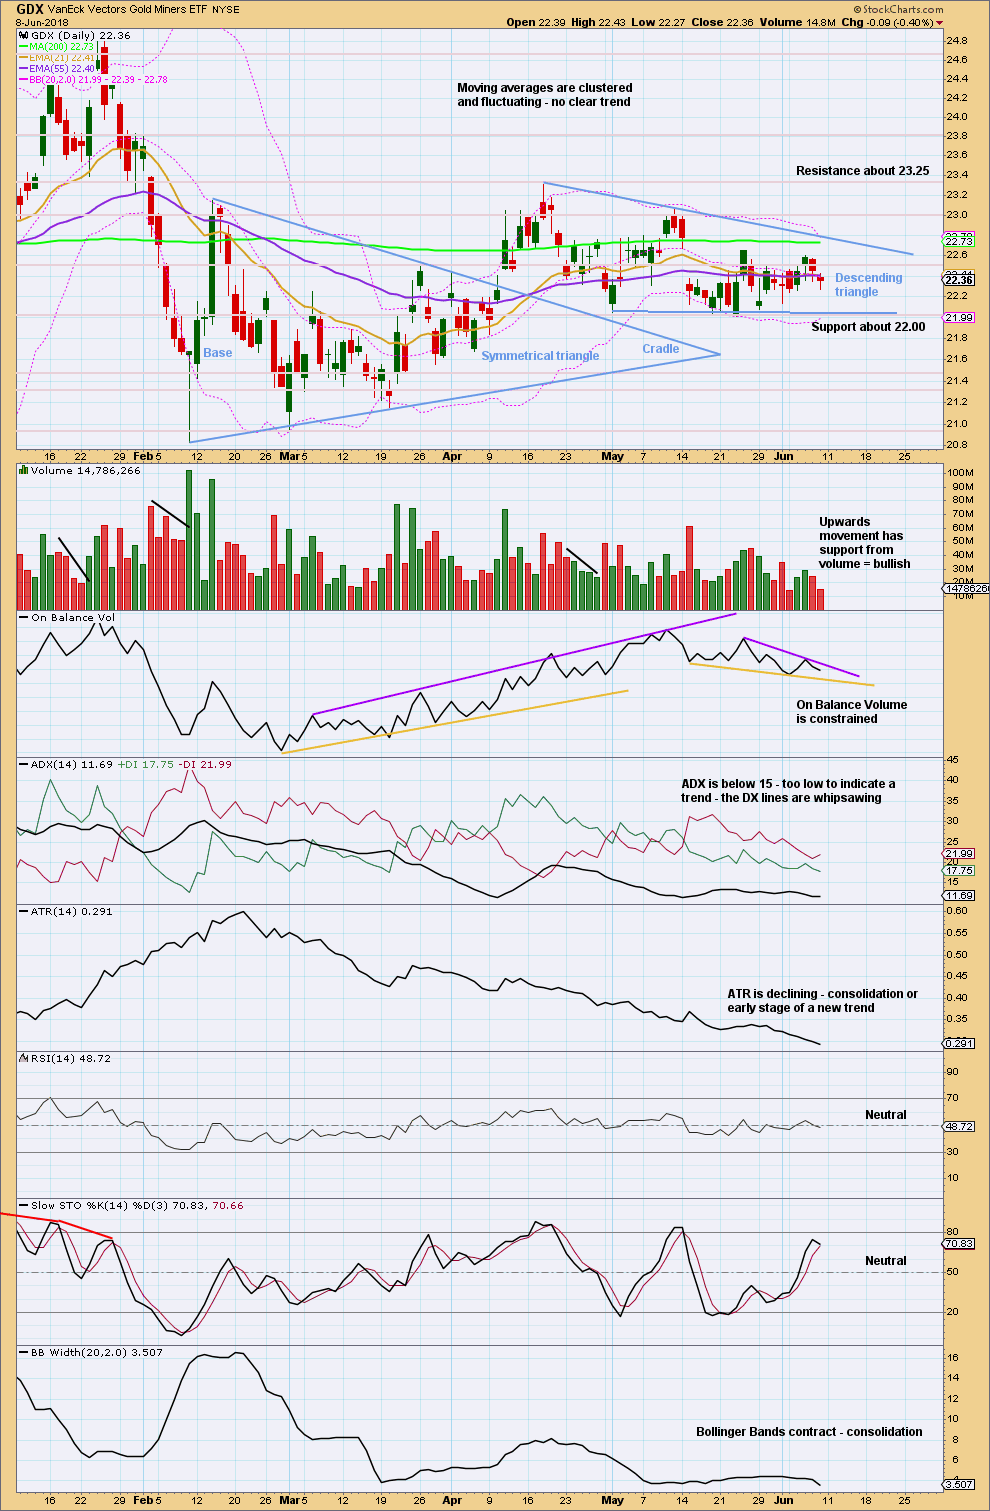
Support here about 22.00 has been tested now five times in recent weeks and has held. The more often a price point is tested for resistance or support and holds, the stronger the technical significance at that point.
A descending triangle may be completing. A break above resistance or below support would signal an end to the triangle and a possible new trend. Watch On Balance Volume carefully next week for a signal.
US OIL
Last week’s analysis expected that US Oil had begun a deeper and longer lasting consolidation. A downwards week with a lower low and a lower high fits this expectation.
Summary: A deeper and longer lasting consolidation may have begun, which may last about 13 to 21 weeks in total. It should remain above 55.24, and the target is about 61.12. The consolidation will not move in a straight line; it may swing from resistance to support and back again in large swings. Once resistance and support are identified, then a swing trading system may be employed by more experienced traders. Support may be about 64.0 and resistance may be as high as 72.5 to 73.0.
Always practice good risk management as the most important aspect of trading. Always trade with stops and invest only 1-5% of equity on any one trade. Failure to manage risk is the most common mistake new traders make.
MAIN WAVE COUNT
MONTHLY CHART
Click chart to enlarge.
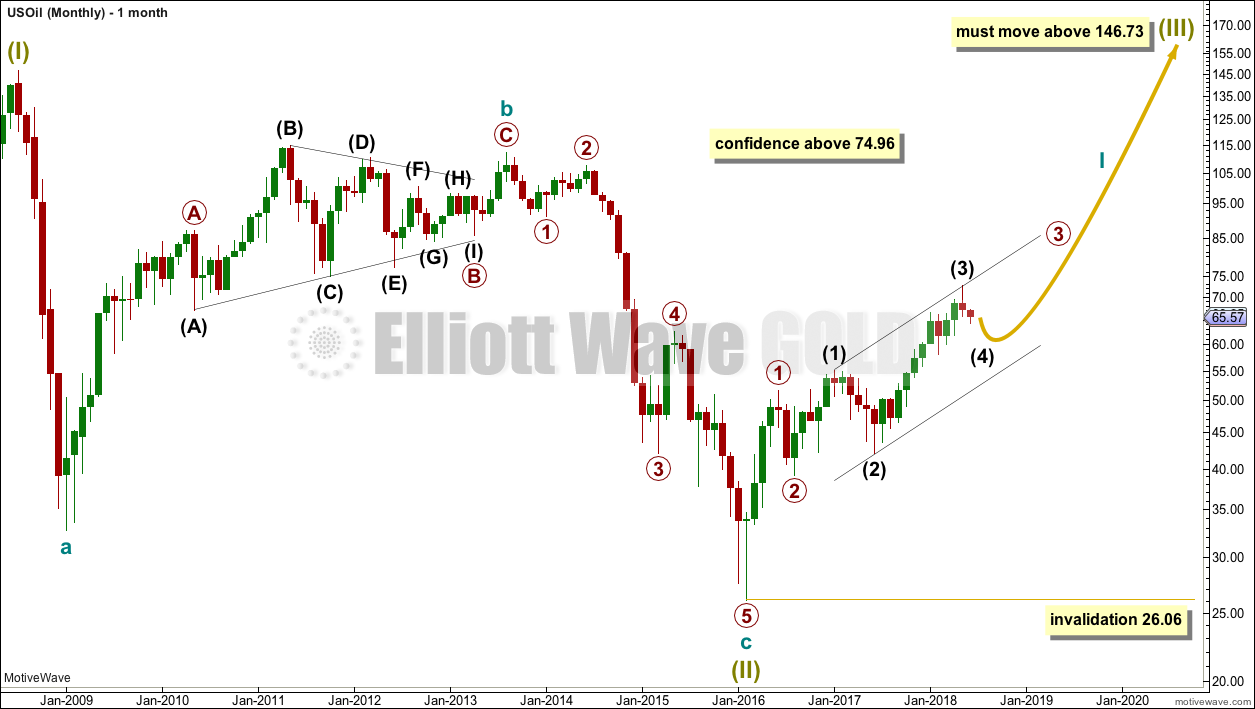
It is possible that the bear market for Oil is over and a new bull market is in the very early stages.
A huge zigzag down to the last low may be complete and is labelled here Super Cycle wave (II).
Cycle wave b must be seen as complete in August 2013 for this wave count to work. It cannot be seen as complete at the prior major swing high in May 2011.
Cycle wave b is seen as a zigzag, and within it primary wave B is seen as a running contracting triangle. These are fairly common structures, although nine wave triangles are uncommon. All subdivisions fit.
Primary wave C moves beyond the end of primary wave A, so it avoids a truncation. But it does not have to move above the price territory of primary wave B to avoid a truncation, which is an important distinction.
If cycle wave b begins there, then cycle wave c may be seen as a complete five wave impulse.
Super Cycle wave (III) must move beyond the end of Super Cycle wave (I). It must move far enough above that point to allow room for a subsequent Super Cycle wave (IV) to unfold and remain above Super Cycle wave (I) price territory.
Cycle wave I may be incomplete. It may be unfolding as an impulse and may have now moved through the middle portion. Commodities have a tendency to exhibit swift strong fifth waves, and this tendency is especially prevalent for third wave impulses. Intermediate wave (5) to end primary wave 3 may be very swift and strong, ending with a blow off top.
When cycle wave I is complete, then cycle wave II may be a deep correction that may not move beyond the start of cycle wave I below 26.06.
Data from FXCM for USOil does not go back to the beginning of Super Cycle wave (I). Without an accurate known length of Super Cycle wave (I) a target cannot be calculated for Super Cycle wave (III) to end using Fibonacci ratios. The target for Super Cycle wave (III) may be calculated when cycle waves I, II, III and IV within it are complete. That cannot be done for many years.
WEEKLY CHART
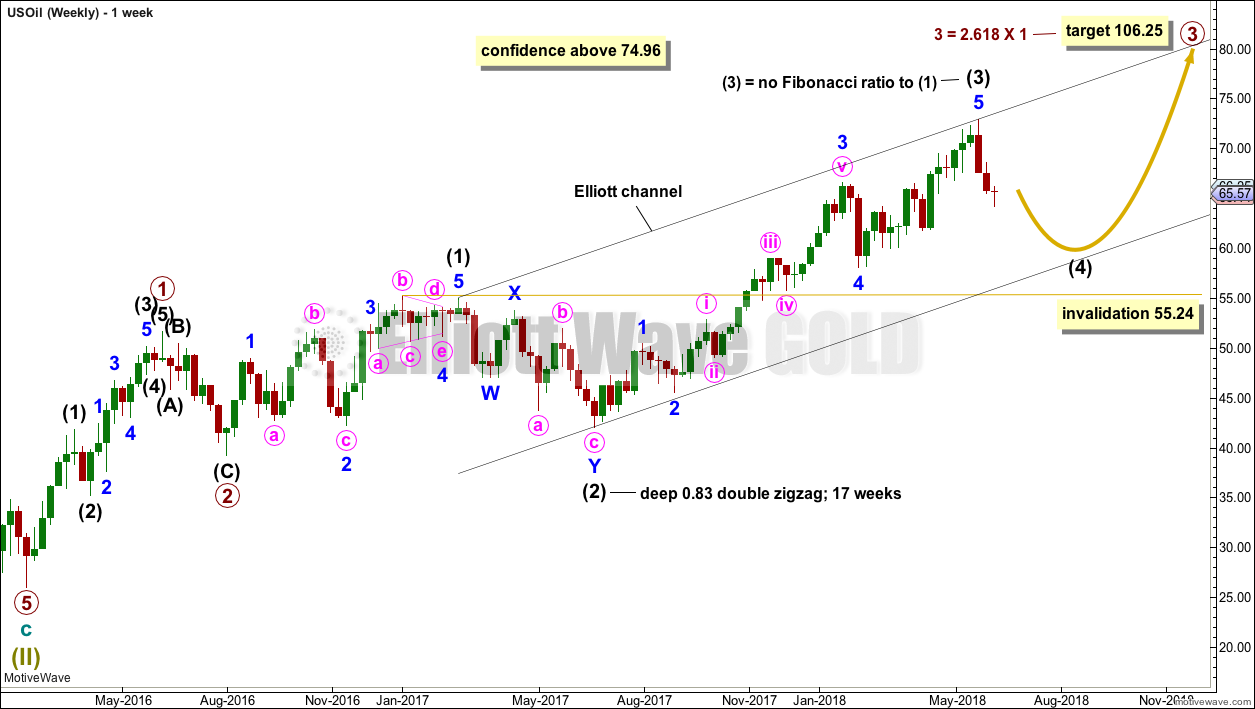
Click chart to enlarge.
Intermediate wave (3) may now be complete. There is no Fibonacci ratio between intermediate waves (1) and (3), and intermediate wave (3) is longer than 1.618 the length of intermediate wave (1).
This wave count fits with classic technical analysis at the monthly and daily chart levels.
Intermediate wave (2) was a deep double zigzag. Given the guideline of alternation, intermediate wave (4) may be expected to most likely be a shallow flat, triangle or combination. It may be about even in duration with intermediate wave (2), or it may be a little longer because triangles and combinations are more time consuming structures.
In the first instance, a Fibonacci 13 weeks may be expected for intermediate wave (4). If about that time the structure is incomplete, then the next Fibonacci number in the sequence at 21 will be expected.
Intermediate wave (4) may find support about the lower edge of the black Elliott channel. It may end within the price territory of the fourth wave of one lesser degree; minor wave 4 has its territory from 66.65 to 59.13.
DAILY CHART
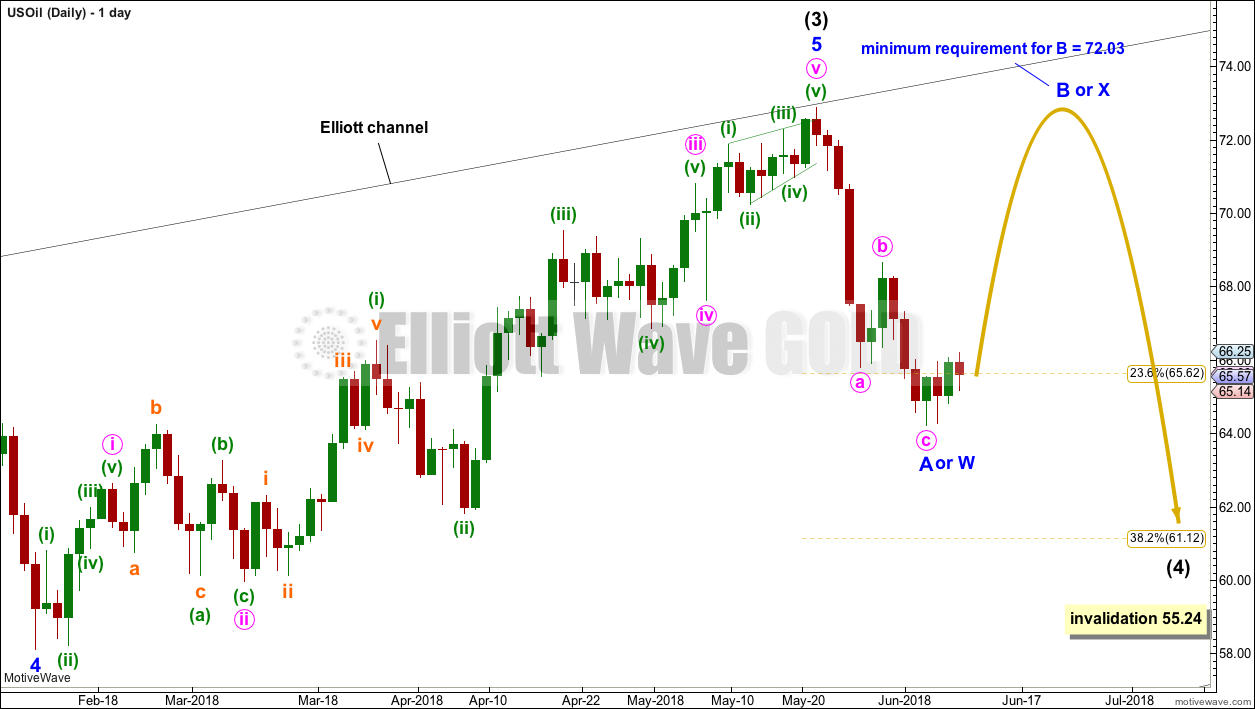
Click chart to enlarge.
If intermediate wave (4) unfolds as a double combination, flat or triangle, then the first wave down within it would be a three wave structure and most likely a zigzag.
All of a flat, combination or triangle may have within them a new high above the start of intermediate wave (4) at 72.90 as in an expanded flat, running triangle or wave X of a double combination. There can be no upper invalidation point for this reason.
This analysis will require alternate daily wave counts over the next few weeks. It is impossible at this stage to tell which of several possible structures intermediate wave (4) may be, only that it is least likely to be a single or multiple zigzag. Focus will be on identifying when intermediate wave (4) may be over.
At this stage, it looks like a zigzag may be now complete at the last low on the 5th of June. This may be minor wave A within a larger flat or triangle, or it may be minor wave W within a combination.
If intermediate wave (4) unfolds as a flat correction, then within it minor wave B must retrace a minimum 0.9 length of minor wave A. The most common length for B waves within flats is from 1 to 1.38 the length of wave A, giving a common range for minor wave B of 72.90 to 76.20.
If intermediate wave (4) unfolds as a triangle, then there is no minimum nor maximum length for minor wave B.
If intermediate wave (4) unfolds as a combination, then there is no minimum nor maximum length for minor wave X, but they are usually relatively deep.
ALTERNATE WAVE COUNT
MONTHLY CHART
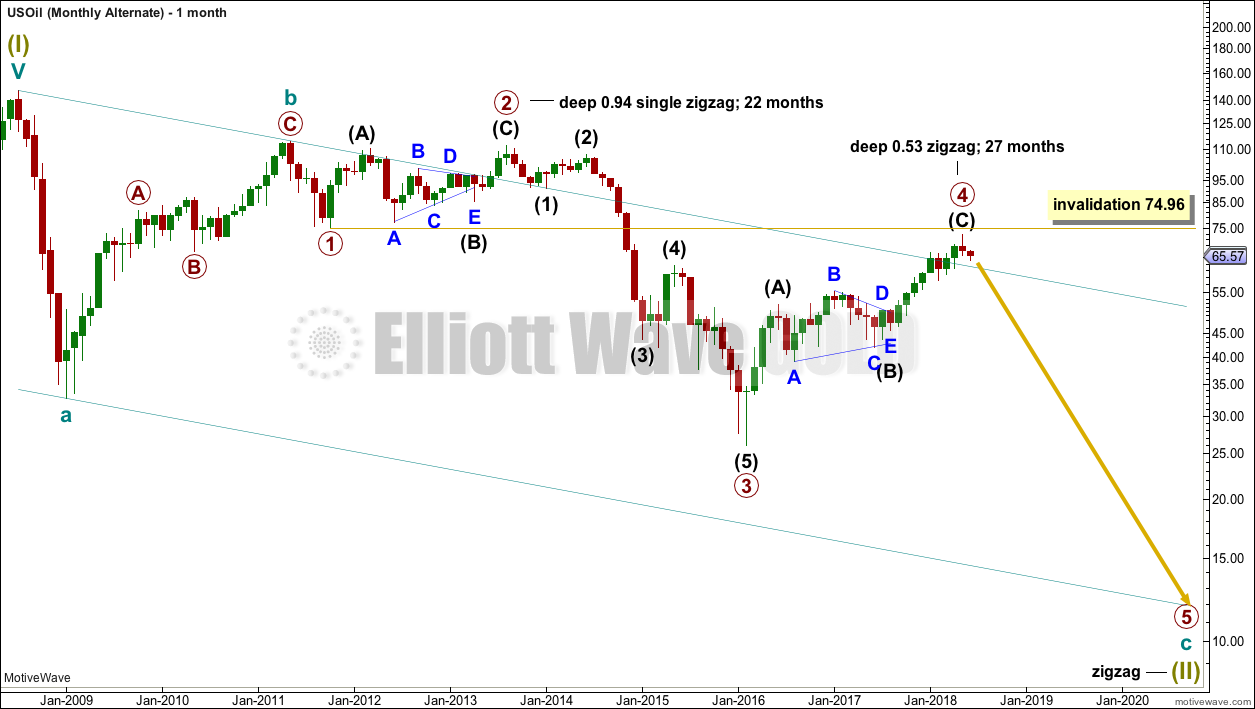
Click chart to enlarge.
Within the bear market, cycle wave b is seen as ending in May 2011. Thereafter, a five wave structure downwards for cycle wave c begins.
Primary wave 1 is a short impulse lasting five months. Primary wave 2 is a very deep 0.94 zigzag lasting 22 months. Primary wave 3 is a complete impulse with no Fibonacci ratio to primary wave 1. It lasted 30 months.
There is now little alternation in depth between primary waves 2 and 4. Primary wave 2 is very deep, but primary wave 4 is also now deep. There is inadequate alternation in structure, both are zigzags. The lack of alternation in this wave count must reduce its probability. So far primary wave 4 has lasted 27 months. At this stage, there is still reasonable proportion between primary waves 2 and 4.
Primary wave 4 may not move into primary wave 1 price territory above 74.96.
The wider Elliott channel (teal) about this whole movement may offer support to primary wave 5.
WEEKLY CHART
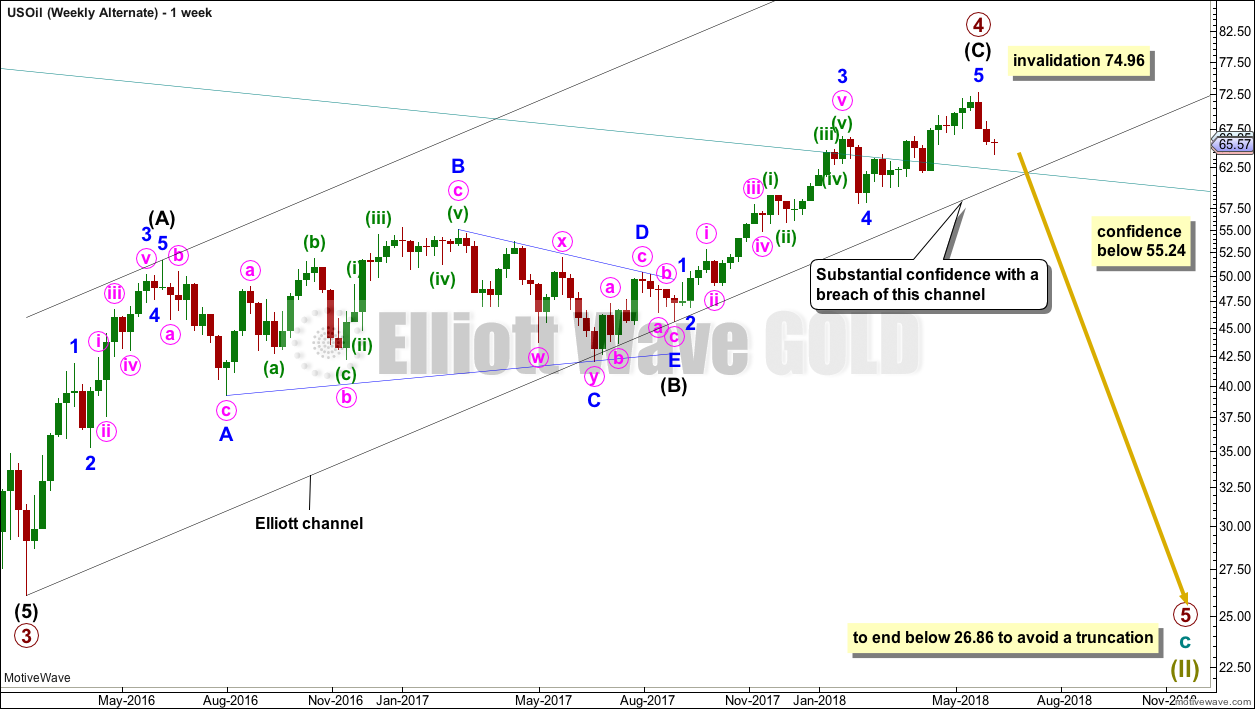
Click chart to enlarge.
This wave count now expects a huge trend change for a new wave down for primary wave 5, which may last about a year or so. Primary wave 5 would be likely to make at least a slight new low below 26.86 to move below the end of primary wave 3 and avoid a truncation.
An Elliott channel is added to this possible zigzag for primary wave 4. A breach of the lower edge of this channel would provide a very strong indication that primary wave 4 should be over and primary wave 5 should be underway. Look out for some support on the way down, perhaps a short term bounce about the lower edge of the channel.
A new low now below 55.24 would invalidate the main wave count and in turn offer some confidence to this alternate.
DAILY CHART
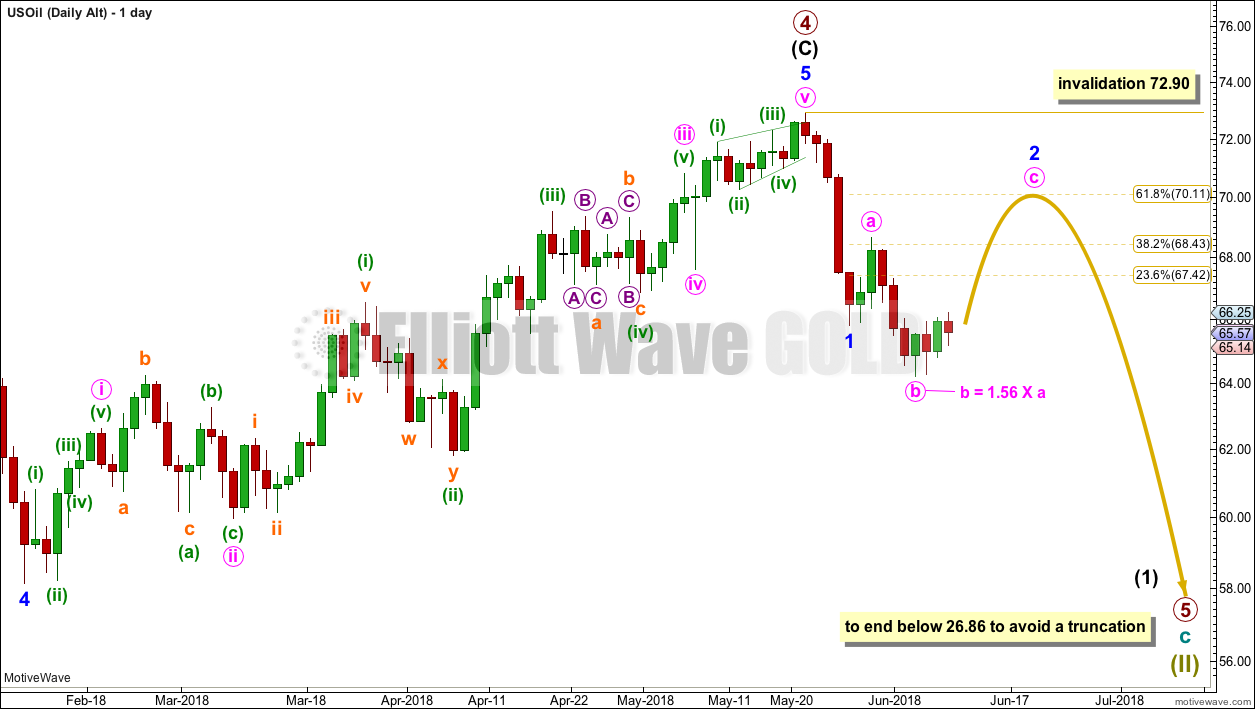
Click chart to enlarge.
This wave count now expects a new wave down at primary degree. That should begin with a five down on the daily chart. Within the new wave down, minor wave 2 may not move beyond the start of minor wave 1 above 72.90.
Minor wave 2 may be unfolding as an expanded flat correction. These are very common structures.
TECHNICAL ANALYSIS
MONTHLY CHART
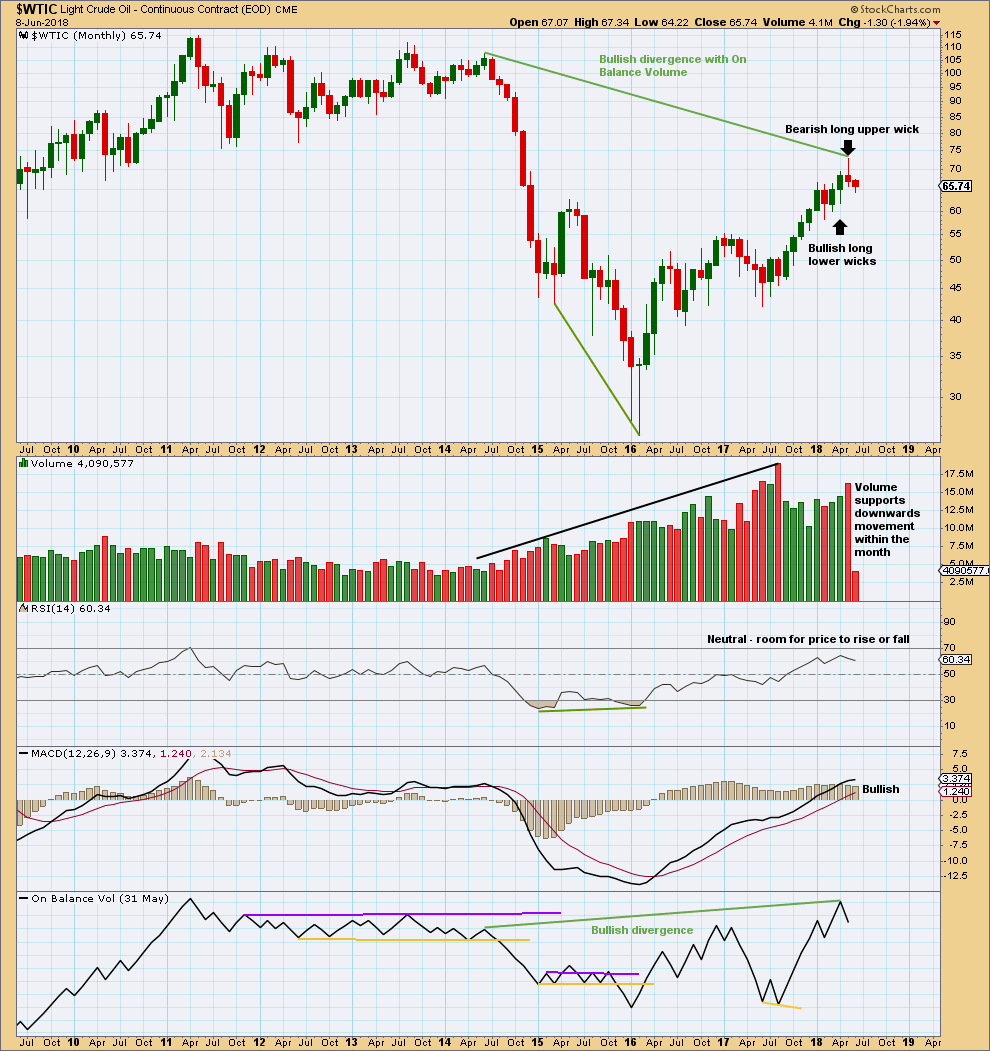
Click chart to enlarge. Chart courtesy of StockCharts.com.
The candlestick now completed for the month of May is very bearish. Although price moved higher, the candlestick closed red and the long upper wick is very bearish. Support from volume for downwards movement within the month is bearish.
However, there remains strong bullish divergence between price and On Balance Volume. With On Balance Volume a leading indicator and making new highs above prior highs back in June 2014, price may be likely to follow with new highs above this date.
The larger trend still may be upward, but here a reasonable consolidation may have begun. It is for this reason that the Elliott wave count expects an intermediate degree correction just beginning.
DAILY CHART
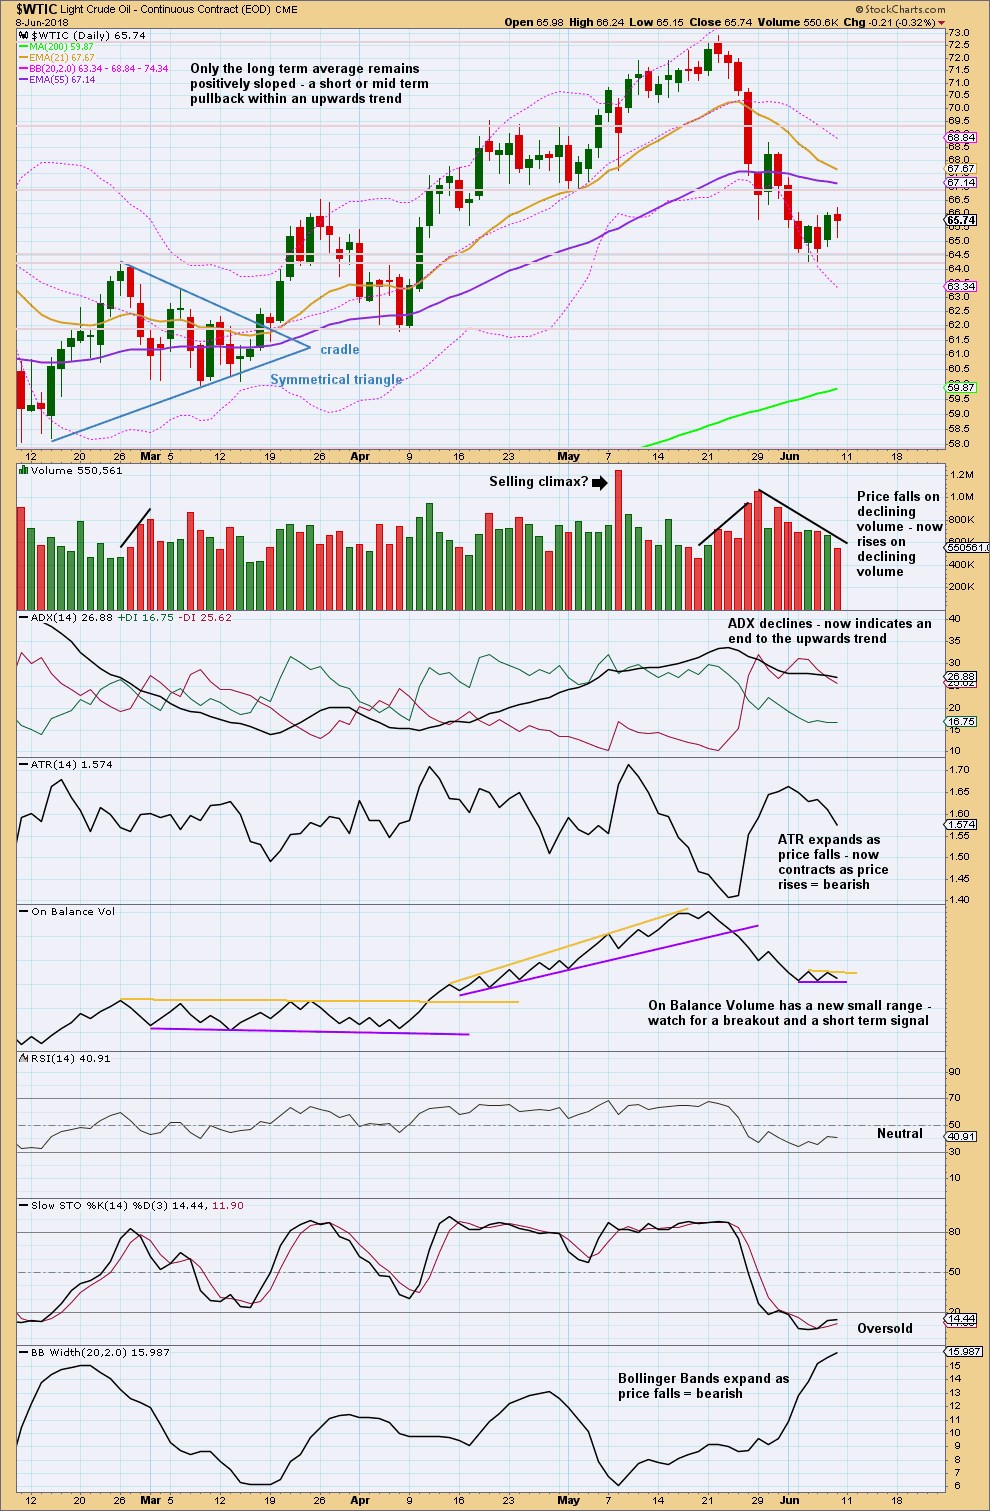
Click chart to enlarge. Chart courtesy of StockCharts.com.
Price has found support here about 64.0.
Declining volume is often a feature of a consolidation. The volume profile looks slightly bullish for the very short term; the last session moved price higher, but the balance of volume was down and the candlestick closed red. Downwards movement within the session had less support from volume than the prior upwards session. In conjunction with the long lower wick on Friday’s candlestick, a green candlestick looks likely for Monday at least.
Stochastics is oversold but does not yet exhibit divergence with price. There is room for price to fall further. Next support is about 62.0.
For the S&P500:
Today there is a new all time high at the daily chart level for On Balance Volume. Along with daily new all time highs for the AD line this is extremely bullish.
Trends do not move in straight lines. There are pullbacks and consolidations along the way up. Today’s Gravestone doji on the daily chart of the S&P suggests a little consolidation about here.
In a bull market, consolidations and pullbacks are opportunities to join the trend or add to long positions.
Lara,
Excellent call on the triangle! I’ve removed that from my chart. I added the idea of a ending diagonal. Which could complete sometime this fall. The more bullish option is still on there. I however need an alternate count as price doesn’t stay outside the bollinger bands long. Maybe we get a turn around Tuesday which would add more time and pull us inside the upper bollinger band.
Yeah, that was a good call. Everyone here subscribing to Lara’s Weekly should now have profitable positions on the S&P500 (if you’re traders, not just here to learn EW).
That’s the value IMO in adding classic TA. I’m confident in new ATH’s for the S&P.
So confident actually, that I’m questioning my confidence daily and wondering “what if?” Is there something I’m missing?
An ending diagonal for intermediate (5) is of course possible. And if overlapping shows it to be the case, I’ll then chart it.