
Last analysis presented a scenario that Bitcoin was most likely in the early stages of a collapse while price stayed below 13,031.04. This still remains the case today.
Summary: A clear breach of a support line, which has seen all price action above it until this point, is a strong indication that Bitcoin is bearish. At this time, Bitcoin may be beginning a third wave down at five degrees; if it is, then it should start to exhibit a strong increase in downwards momentum.
The data used for this analysis now comes from Yahoo Finance BTC-USD.
Updates to this analysis are in bold.
Last analysis may be found here.
FIRST ELLIOTT WAVE COUNT
MONTHLY
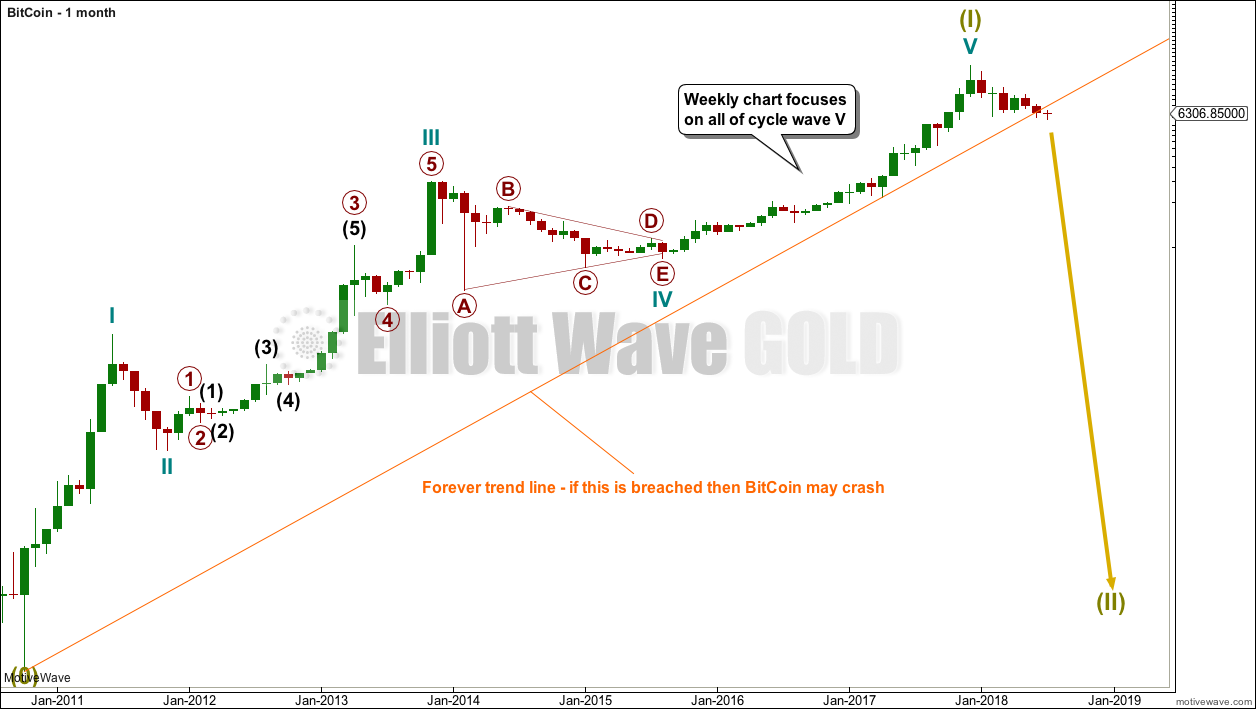
Click chart to enlarge.
It is possible to see a completed five wave impulse upwards for Bitcoin.
I am unable to find reasonable Fibonacci ratios within this wave count. It appears that Bitcoin may not exhibit Fibonacci ratios very often between its waves, so this makes target calculation impossible. Classic technical analysis will then be used to identify a high in place.
What is very clear from this chart is that Bitcoin is in a classic bubble. This looks like an even larger bubble than the Tulip Mania. The only thing about which I am certain is that this bubble will pop and Bitcoin will collapse.
What is uncertain is exactly when it will crash. For that question to be answered Elliott wave analysis may be helpful. Now that the Forever trend line is breached some confidence may be had that Bitcoin may be crashing.
WEEKLY
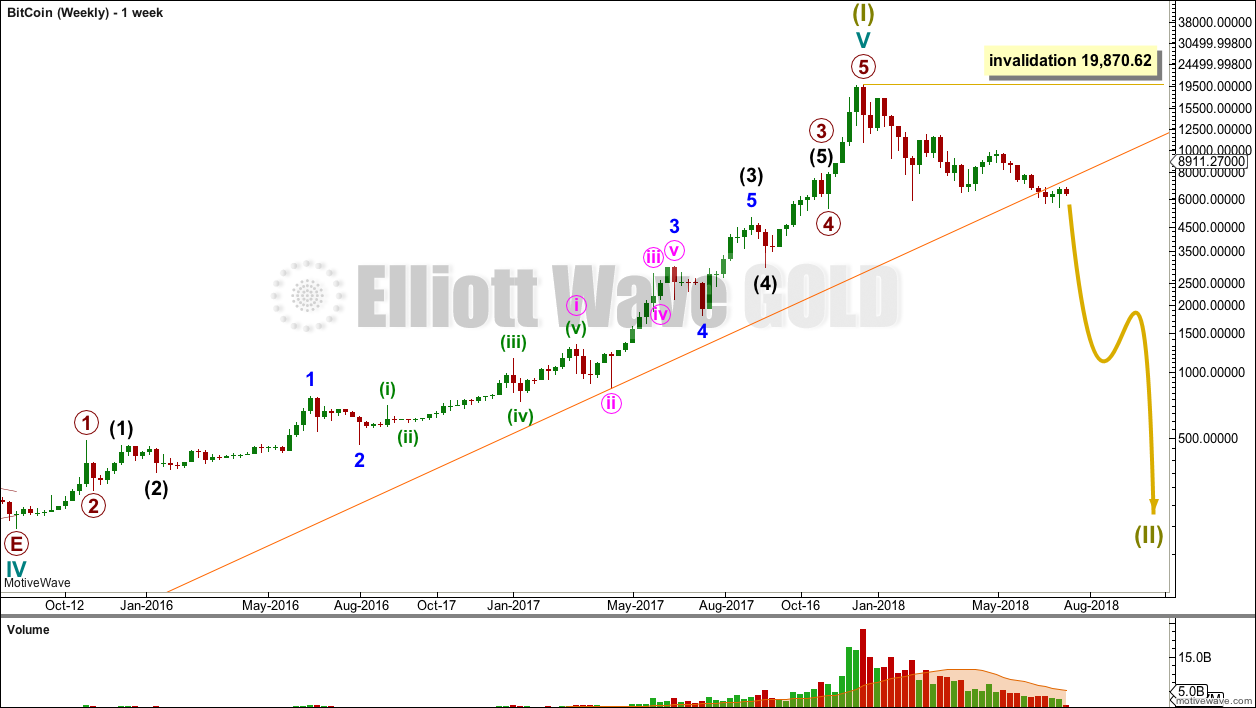
Click chart to enlarge.
Bitcoin tends to behave like an extreme commodity: price moves upwards for about 2 – 4 weeks in a near vertical movement at the end of its rises. Following this vertical movement the resulting downwards movement is very deep (in percentage terms) and often very quick.
The next rise begins slowly with basing action over weeks or months, and then as the rise nears its end another vertical movement completes it. Also, there are volume spikes just before or at the end, which is another feature typical of commodity like behaviour.
This has happened now several times. The most notable instances are the rise up to the week ending 24th November, 2013, and the week ending 5th June, 2011. The following sharp drops were 94% and 93% respectively.
If this current drop continues like the last two examples, then a reasonable target may be about $1,390.94 or below.
DAILY
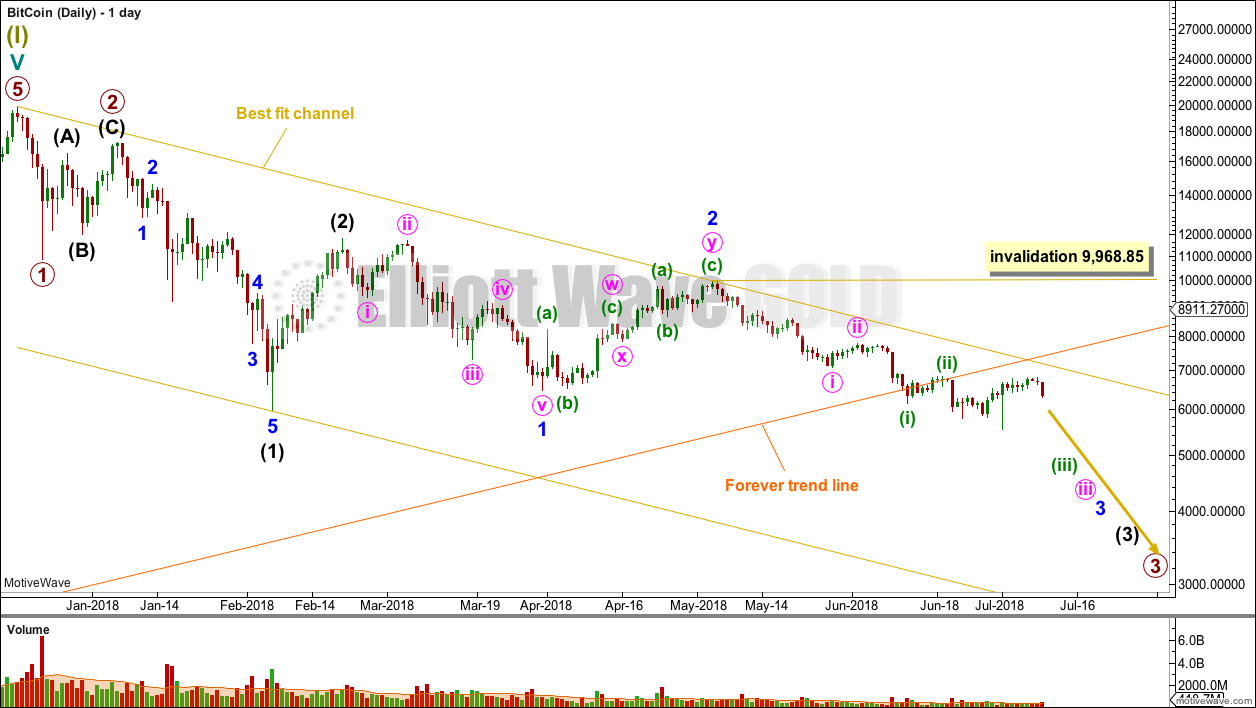
Click chart to enlarge.
If Bitcoin is in the early stages of a huge crash, then a five down structure should develop at the daily chart level. This would still be incomplete.
A third wave down may now be beginning at five degrees. Bitcoin may be still winding up for a spectacular plummet in price. The strongest fall may come towards the end of any one or more of these third waves as Bitcoin exhibits commodity like behaviour. Commodities tend to have their strongest portion of impulses in the fifth waves.
While price remains below the upper edge of the best fit channel, expect bounces to find resistance there. On the other side of the channel, the lower edge should be breached by the strength of one of the ends of any one of the third waves which are unfolding.
SECOND ELLIOTT WAVE COUNT
WEEKLY
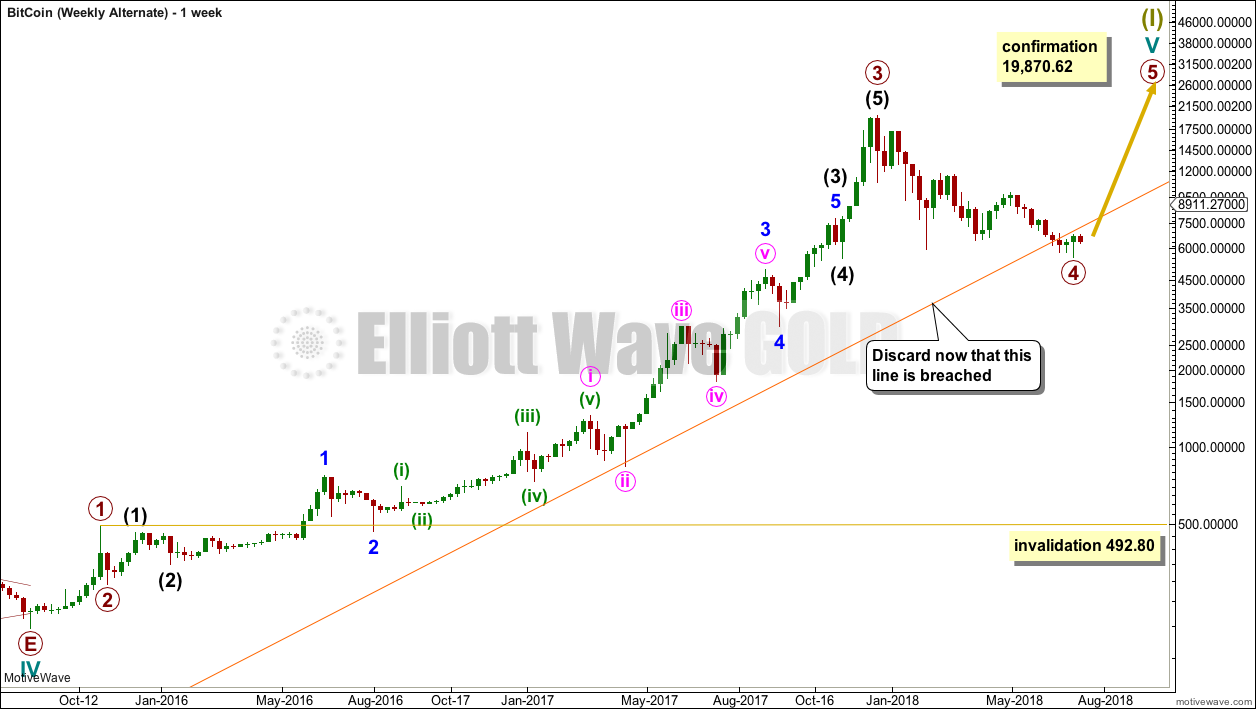
Click chart to enlarge.
It is also still just possible that the rise for Bitcoin is not over. The last blow off top may have only been the end of a third wave, so a still stronger fifth wave may be yet to come.
Primary wave 4 may not move into primary wave 1 price territory below 492.80, but this price point is far away for any usefulness. The Forever trend line is now very clearly breached by three full weekly candlesticks below and not touching it. This may be a relatively early indication that this bullish wave count may be wrong. The probability of it is reduced, so it should be discarded.
TECHNICAL ANALYSIS
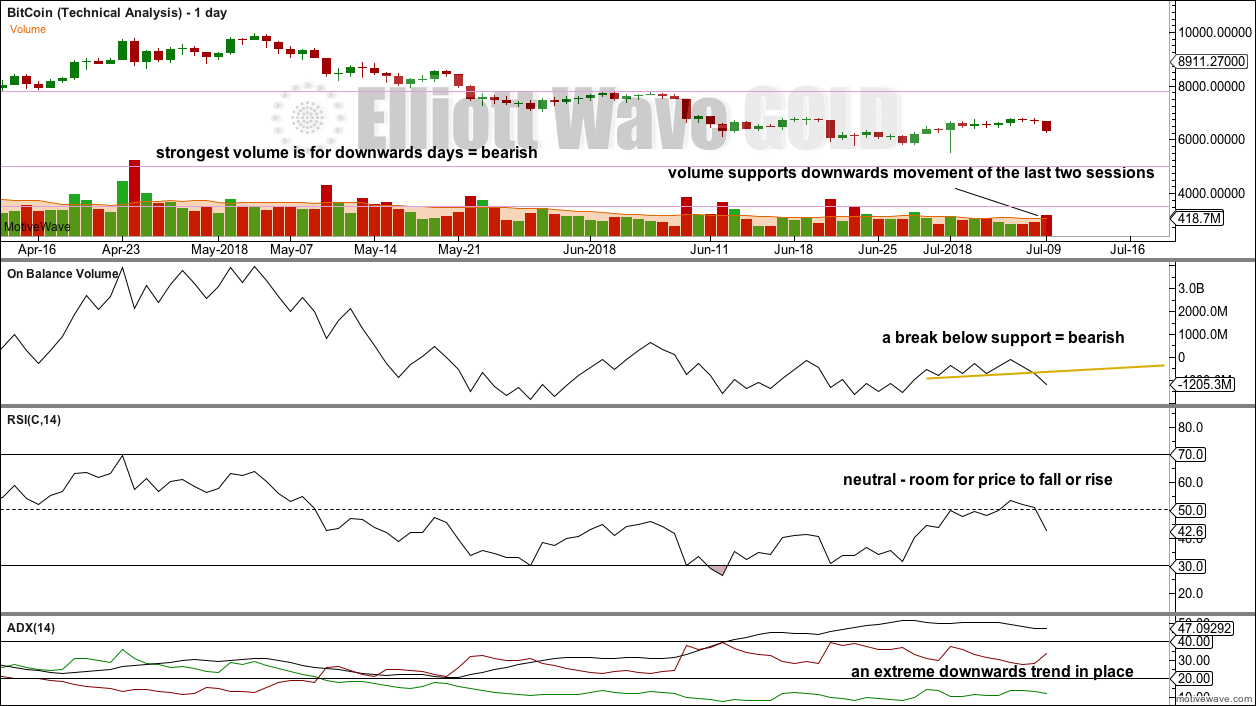
Click chart to enlarge.
Volume is declining (at higher time frames); this market is falling mostly of its own weight. However, looking more closely, daily volume is stronger for downwards days than for upwards days.
Using ADX as a trend indicator, at this time it indicates a very extreme downwards trend, which can continue further. Bitcoin can sustain very extreme trends for very long periods of time.
Published @ 04:37 a.m. EST.
Hi Lara!
Thank you for all your super insights. If you could spare a moment to educate me; why following a five wave is BTC not just one a three corrective right now? Which would place us on a possible ending diagonal C?
Thank you
Because super cycle wave (II) should be much longer lasting than that. To see cycle waves a and b over already, is way too brief.
Lara, Thanks for the update. I’ve never traded Bitcoin, but follow it out of interest.
One question, are you concerned with the potential proportions of the main count? A roughly 70% drop and the count hasn’t even reached the middle of the 3rd wave for the first “A” wave down? Having trouble visualizing how this ends up with a good look.
Thoughts? Thanks
No, I’m not at all concerned, it looks right.
This market is nuts. It doesn’t exhibit Fibonacci ratios often, and when it does they’re very extreme. It exhibits massive blowoff tops, and then it has “corrections” which are over 90%. That’s a crash in anyone’s book.
So I’ll be expecting it to continue to behave true to form, and have a correction here which is likely to be over 90%. And it should last longer than a few months, it should last years.
When you look at it on the weekly chart on a semi log scale, there’s plenty of room below for Super Cycle (II) to continue.
On an arithmetic scale this market looks very strange, but on a semi log scale it looks right.
Here’s the monthly chart on an arithmetic scale. This shows just how extreme this market is.
It looks like as classic a bubble as there ever was, and so a massive crash here looks like a reasonable expectation. The only question at the bottom will be, will bitcoin survive? Or will it go the way of the tulips, never to recover in price?
Very good. Thanks for the reply. Yes, history will tell the story of Bitcoin. The underlying technology, Blockchain, may have a better chance of survival than Bitcoin itself.