
Last analysis of this pair was in January 2017. In that analysis members of Elliott Wave Gold were given specific trading advice to either open long positions, or wait patiently. January 2017 was the last major low for this pair.
ELLIOTT WAVE ANALYSIS
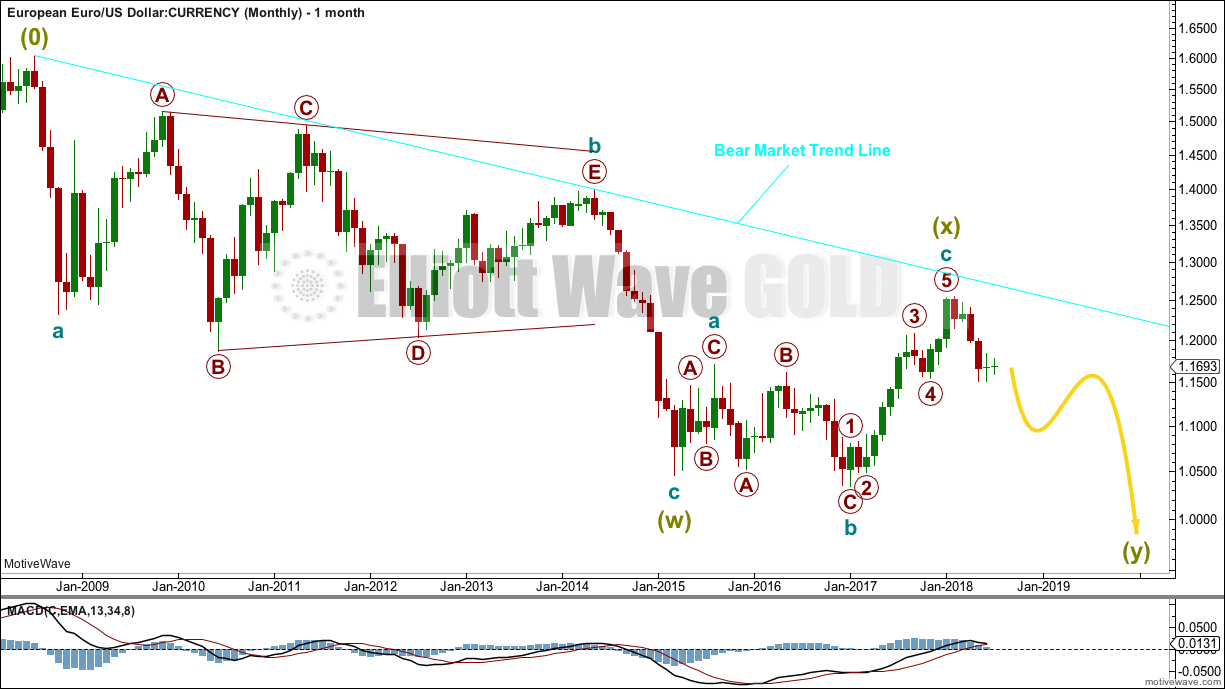
MONTHLY CHART
Click chart to enlarge.
The (0) is from where the wave count begins.
A large zigzag can be seen complete at the low in March 2015. This is labelled Super Cycle wave (w).
A low now below this point indicates that the larger structure downwards is incomplete. The Elliott wave structure that fits best here is a double zigzag.
The first zigzag in the double is complete; it is labelled Super Cycle wave (w). The double is now joined by a complete three in the opposite direction, an expanded flat labelled Super Cycle wave (x). Because Super Cycle wave (x) ends just short of the cyan bear market trend line, it looks like it is over there.
Super Cycle wave (y) is most likely now to unfold as a zigzag.
While double zigzags and double combinations are labelled the same, W-X-Y, they are very different structures.
Double zigzags, like single zigzags, normally have a strong counter trend slope. To achieve this their X waves are usually brief and shallow. The second zigzag in the double usually moves reasonably beyond the end of the first zigzag, so that the whole structure has a strong slope.
Double combinations are sideways movements. To achieve a sideways look their X waves are usually deep and can also often be time consuming. The second structure in the double usually ends about the same level as the first, so that the whole structure takes up time and moves price sideways.
Here, Super Cycle wave (x) is relatively shallow. This indicates a double zigzag is most likely unfolding lower.
The bear market trend line may be expected to continue to provide resistance while the bear market for EURUSD remains intact.
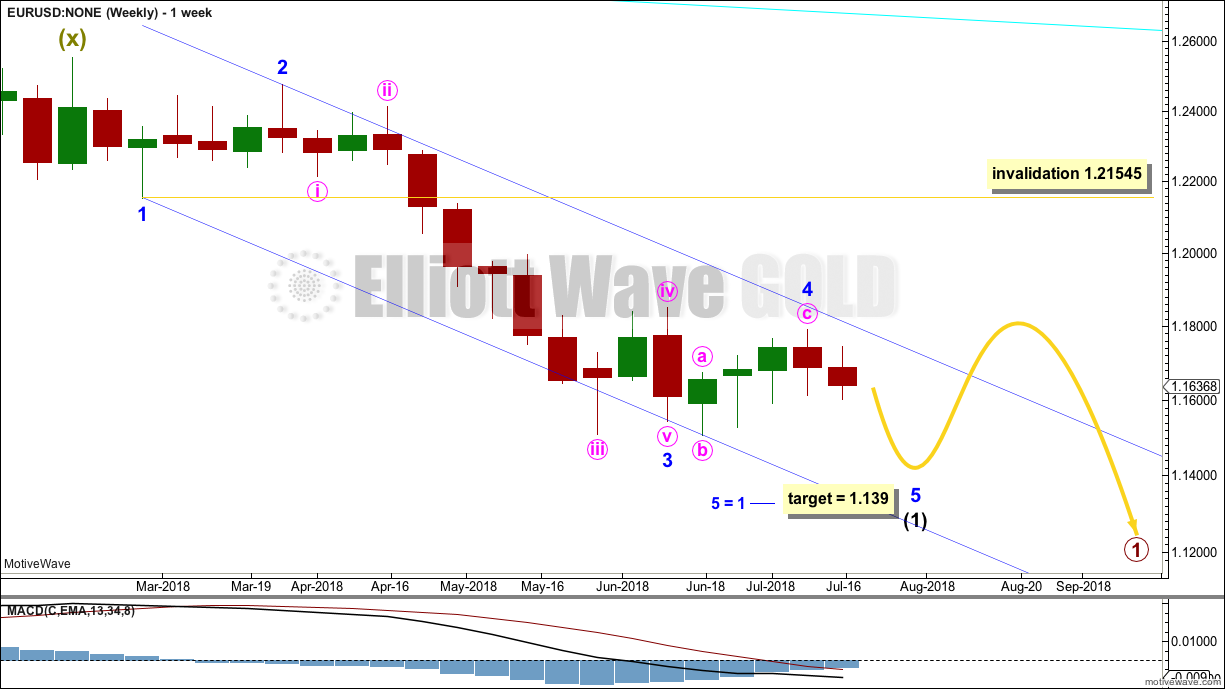
WEEKLY CHART
Click chart to enlarge.
This weekly chart focuses on the start of Super Cycle wave (y).
A zigzag for Super Cycle wave (y) would subdivide 5-3-5. Cycle wave a would subdivide as a five wave structure at primary degree.
Within cycle wave a, primary wave 1 should last several months. It would most likely be an impulse, and would most likely be incomplete.
Within primary wave 1, intermediate wave (1) looks like an almost complete five wave impulse. So far there are no adequate Fibonacci ratios at minor or minute degree within this wave count.
Within intermediate wave (1), minor wave 4 may be complete, remaining within the blue Elliott channel. If minor wave 4 is not over there and continues sideways or higher, then it may not move into minor wave 1 price territory above 1.21545.
When intermediate wave (1) could be seen as a complete five wave impulse with a new low, then the invalidation point must move up to its start at 1.25556. A larger correction would then be expected for intermediate wave (2), which may not move beyond the start of intermediate wave (1).
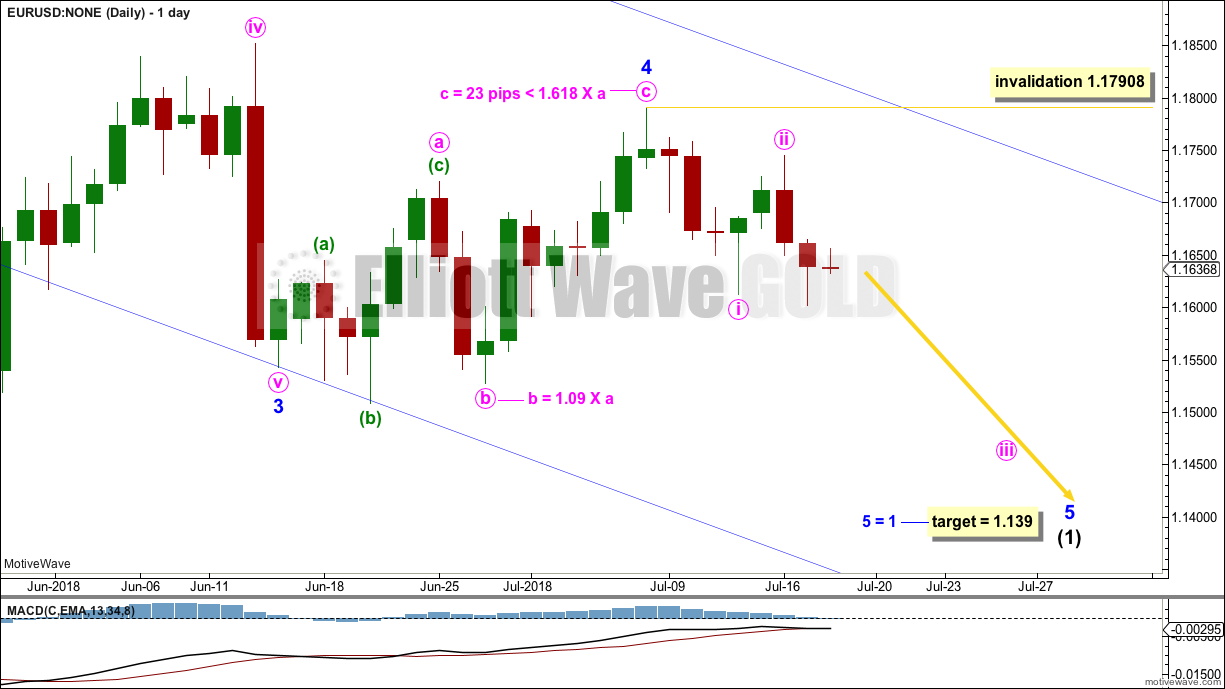
DAILY CHART
Click chart to enlarge.
Minor wave 2 was a single zigzag. Minor wave 4 exhibits alternation as an expanded flat. There is reasonable proportion between these two corrections, giving the wave count the right look at higher time frames.
A target is calculated for the end of minor wave 5, which expects it to exhibit the most common Fibonacci ratio to minor wave 1.
Within minor wave 5, no second wave correction may move beyond the start of its first wave above 1.17908. This allows for the possibility that minute wave ii may not be over and may move higher.
The target is expected to be met in one or a very few more weeks.
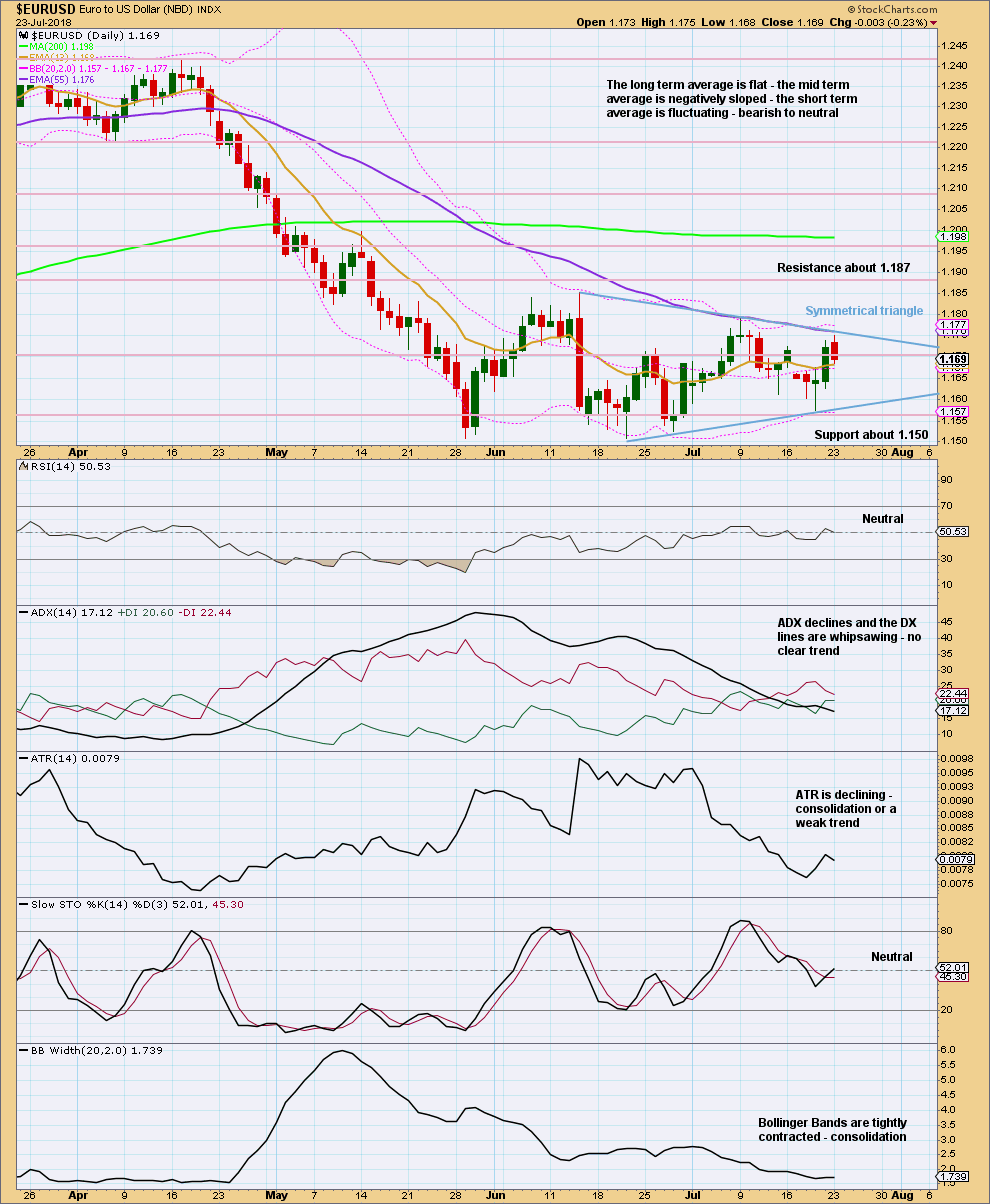
TECHNICAL ANALYSIS
Click chart to enlarge.
A symmetrical triangle may be unfolding (this is too time consuming to be considered a pennant pattern). Breakouts from symmetrical triangles may be in either direction. During the formation volume is strongest for a downwards day suggesting a downwards breakout may be more likely than upwards.
If price breaks out of the triangle on a day with support from volume, then expect the next trend to continue for about the same distance from the breakout point as the widest part of the triangle, which is 342 pips.
The prior downwards trend reached very extreme. The symmetrical triangle has allowed extreme conditions to be relieved; there is again room for a trend to develop.
Currently, this market is consolidating. Watch the triangle trend lines carefully for a breakout.
VOLUME ANALYSIS
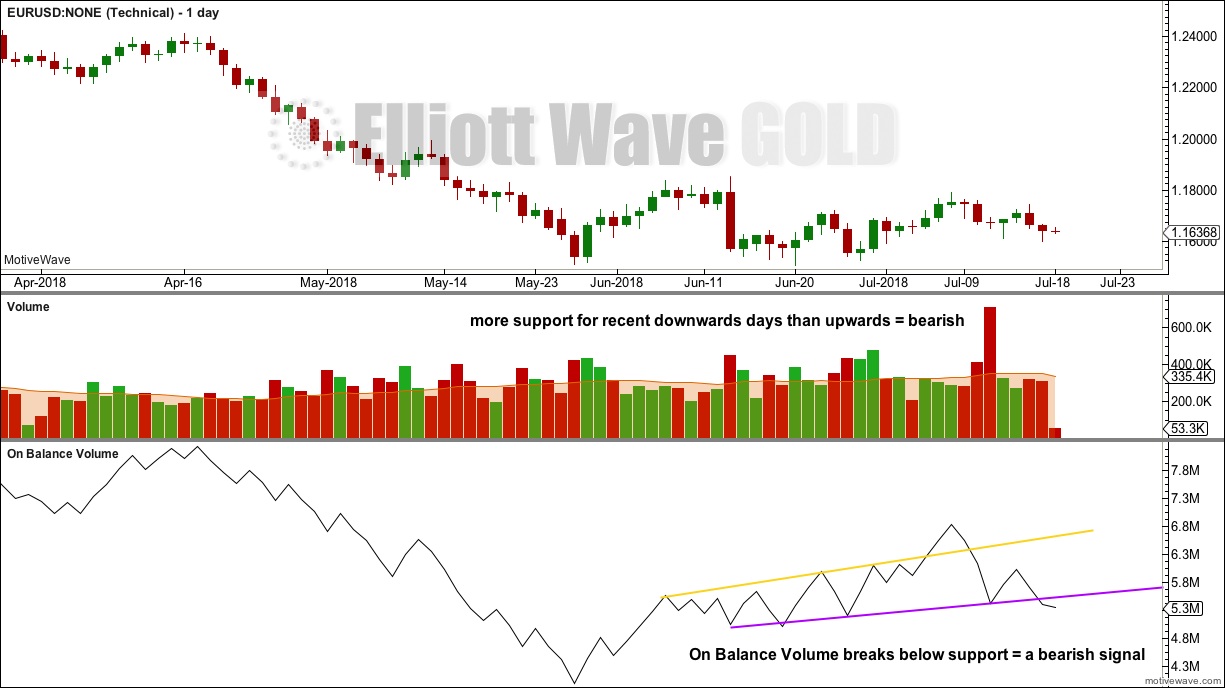
Click chart to enlarge.
Volume and On Balance Volume suggest more support for downwards movement than upwards. The next movement out of the symmetrical triangle looks more likely to be downwards.
This analysis is published @ 10:27 p.m. EST.
This seems to align better with your ultra bullish alternate for the $USD. $USD and $EURUSD have a strong negative correlation.
Seems like a strong USD would be undesirable with the high national debt and budget deficits.
Maybe there is a more bullish count for $EURUSD?
I note that the negative correlation between these two is strong and persistent. I’ll take another look at this tomorrow.