
A new high very slightly above 1,234.67 now adds confidence to the main Elliott wave count.
An alternate Elliott wave count is still considered.
Summary: It still is reasonably likely that a low is in place for Gold for the short to mid term. A bounce up now to about 1,307 is expected to last a few weeks, possibly as long as 21 weeks. It is expected to have a consolidation within it.
It is possible for the very short term that price may pullback here to slightly below 1,218.61, but it should remain above 1,212.11 now.
Always trade with stops to protect your account. Risk only 1-5% of equity on any one trade.
New updates to this analysis are in bold.
Grand SuperCycle analysis is here.
Last historic analysis with monthly charts and several weekly alternates is here, video is here.
Last remaining four weekly wave counts were updated here, and video here.
MAIN ELLIOTT WAVE COUNT
WEEKLY CHART – TRIANGLE
Click chart to enlarge.
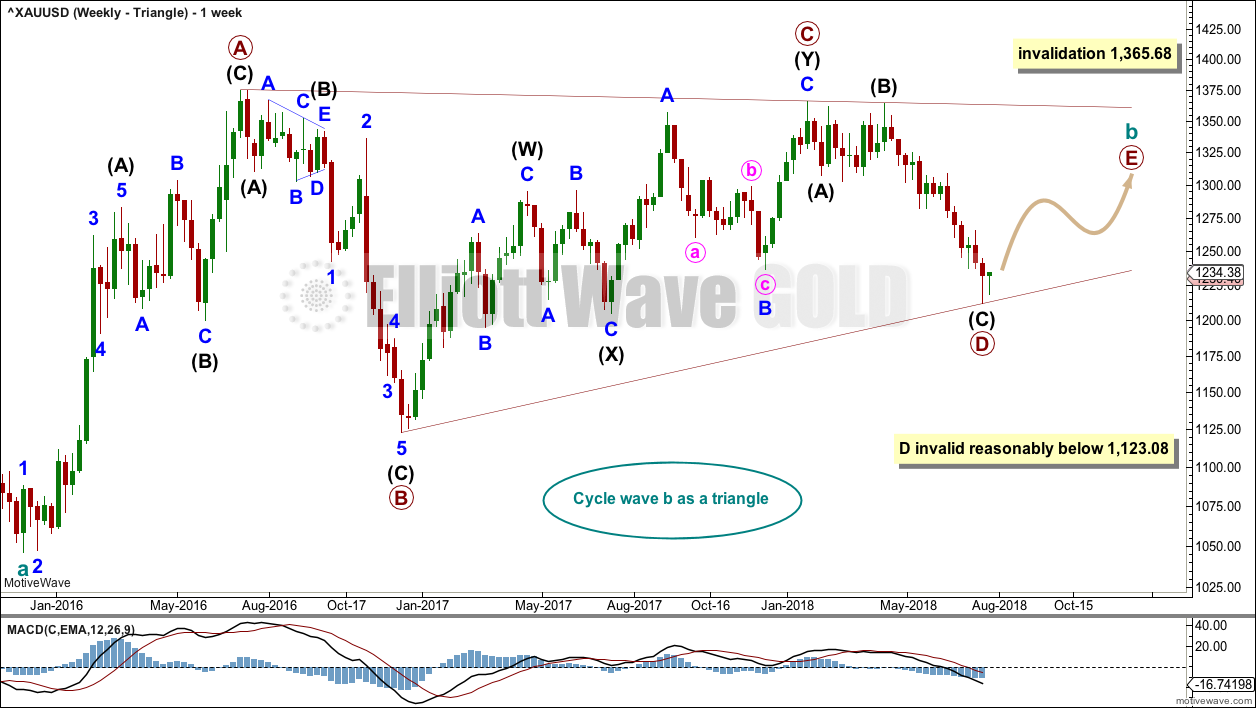
There are four remaining weekly wave counts at this time for cycle wave b: a triangle, flat, combination or double zigzag. At this stage, all four expect a bounce over the next few weeks, and the triangle has the best look.
While the direction does not diverge for these four weekly wave counts, only one weekly wave count shall be published on a daily basis, so that the analysis is manageable for me to publish and for members to digest. Note: This does not mean that the remaining three counts may not be correct.
The triangle so far has the best fit and look.
Cycle wave b may be an incomplete triangle. The triangle may be a contracting or barrier triangle, with a contracting triangle looking much more likely because the A-C trend line does not have a strong slope. A contracting triangle could see the B-D trend line have a stronger slope, so that the triangle trend lines converge at a reasonable rate. A barrier triangle would have a B-D trend line that would be essentially flat, and the triangle trend lines would barely converge.
Within a contracting triangle, primary wave D may not move beyond the end of primary wave B below 1,123.08. Within a barrier triangle, primary wave D may end about the same level as primary wave B at 1,123.08, so that the B-D trend line is essentially flat. Only a new low reasonably below 1,123.08 would invalidate the triangle.
Within both a contracting and barrier triangle, primary wave E may not move beyond the end of primary wave C above 1,365.68.
Four of the five sub-waves of a triangle must be zigzags, with only one sub-wave allowed to be a multiple zigzag. Primary wave C is the most common sub-wave to subdivide as a multiple, and this is how primary wave C for this example fits best.
Primary wave D must be a single structure, most likely a zigzag. It is possible that primary wave D could be over.
One triangle sub-wave tends to be close to 0.618 the length of its predecessor; if primary wave D is over at last week’s low, it is just 3.64 below this point.
There are no problems in terms of subdivisions or rare structures for this wave count. It has an excellent fit and so far a typical look.
DAILY CHART – TRIANGLE
Click chart to enlarge.
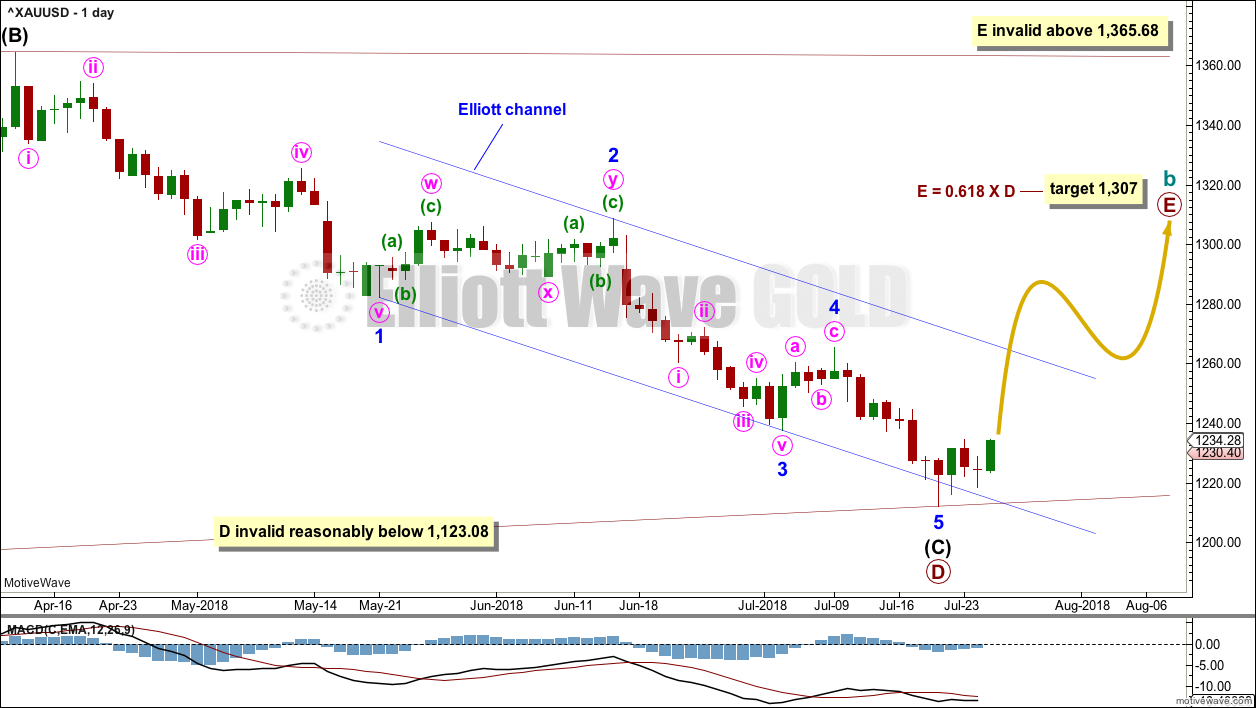
It is possible that primary wave D is over. The structure may be seen complete and technical analysis indicates a low may now be in place.
At this stage, the best target calculation for primary wave E would be 0.618 the length of primary wave D. This yields a target that is within a very strong area of resistance.
When intermediate waves (A) and (B) within primary wave E may be complete, then the ratio between intermediate waves (A) and (C) may be used to add to the target calculation at a second degree. At that stage, it may change or widen to a zone.
Primary wave E would be most likely to fall reasonably short of the A-C trend line.
In the first instance, primary wave E may be expected to last about a Fibonacci 21 weeks. It is also possible that it may not last that long because E waves of a triangle can be relatively quick.
MAIN HOURLY CHART
Click chart to enlarge.
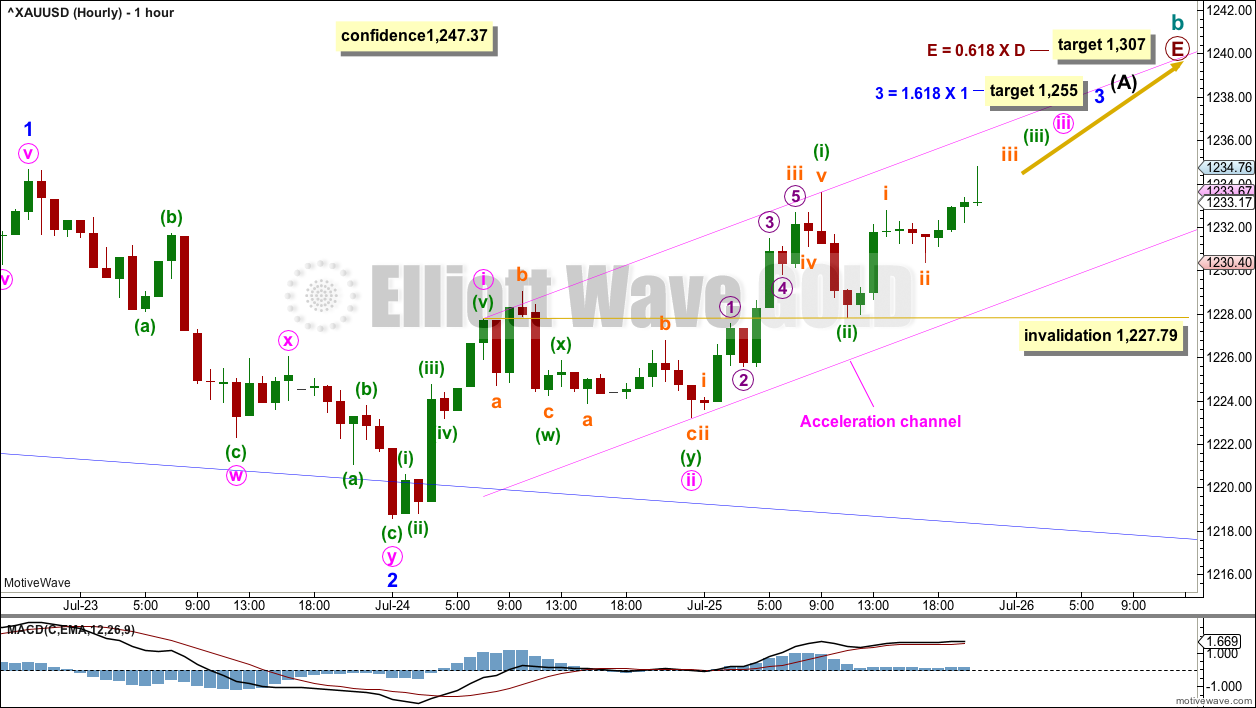
With reasonable support now from classic technical analysis for the idea that a low is in place for Gold, for the mid term at least, both this main wave count and the alternate hourly wave count below will expect that primary wave E has begun.
If primary wave E is beginning, then within it intermediate wave (A) must subdivide as a five wave structure, most likely an impulse. Within the impulse, minor wave 1 may have been over at the last high and minor wave 2 may now be a complete double zigzag.
Upwards movement for the last session may be the start of minor wave 3. A target that expects to exhibit the most common Fibonacci ratio to minor wave 1 is calculated for minor wave 3 to end.
Minor wave 3 may only subdivide as an impulse, and within it minute waves i and ii may be complete. When minute wave iii is complete, then minute wave iv may not move into minute wave i price territory below 1,227.79.
If this wave count is correct for the short term, then price should remain above the lower edge of the acceleration channel. A breach of the lower edge of that channel would see the probability of the alternate hourly wave count below increase.
The alternate idea that primary wave D may yet see one final new low was invalidated at the hourly chart level today with a slight new high above 1,234.67 in the last hour. This idea is now discarded.
ALTERNATE HOURLY CHART
Click chart to enlarge.
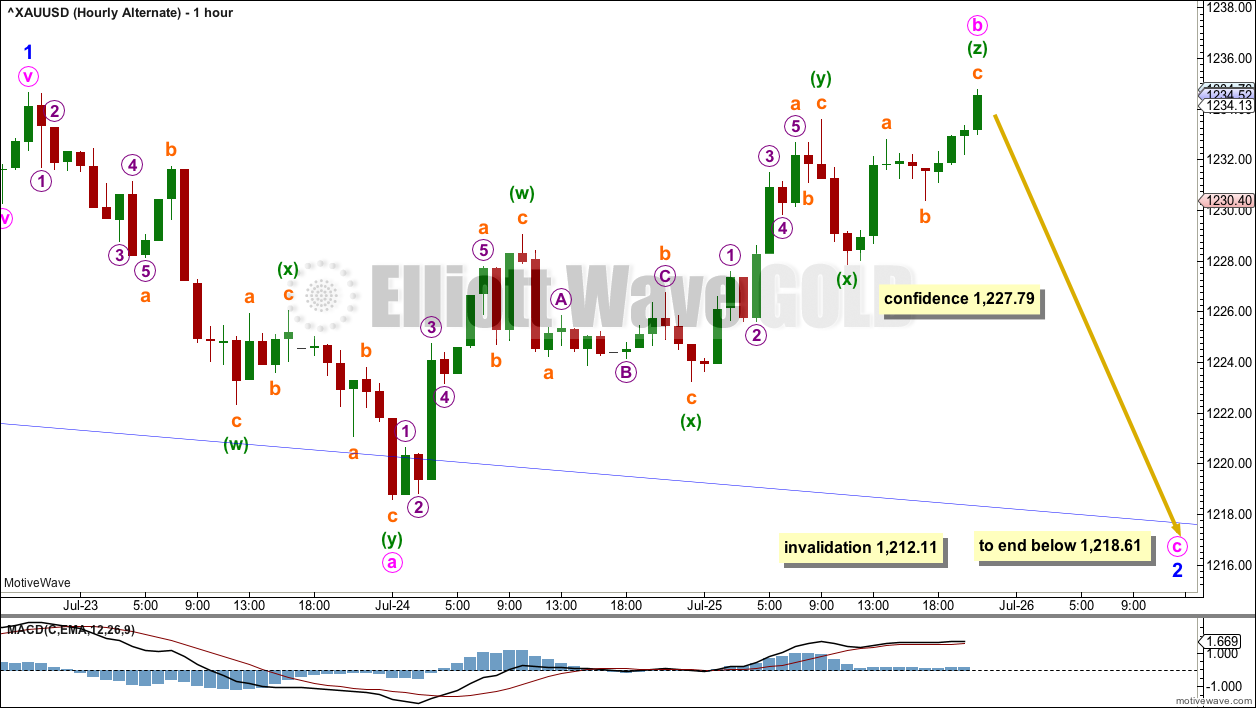
Both hourly wave counts today see primary wave E underway and primary wave D complete, as labelled on the daily chart.
It is possible that minor wave 2 was not over at the last low, that it may continue further as a regular flat correction.
Both waves A and B within a flat must subdivide as corrective structures. Minute wave a may be a double zigzag; if it is over at the last high, then minute wave b may be over as a rare triple zigzag. All subdivisions fit. All Elliott wave rules are met.
A new low now below 1,227.79 would invalidate the main hourly wave count and provide confidence in this alternate. If that happens, then expect more downwards movement to at least slightly below 1,218.61 in order for minute wave c to avoid a truncation.
Minor wave 2 may not move beyond the start of minor wave 1 below 1,212.11.
This alternate wave count is considered today mostly because upwards movement for the last session lacks support from volume, and there is still a bearish signal yesterday from On Balance Volume making a new low. If the last upwards session was a B wave, then it makes sense that it exhibits weakness.
TECHNICAL ANALYSIS
WEEKLY CHART
Click chart to enlarge. Chart courtesy of StockCharts.com.
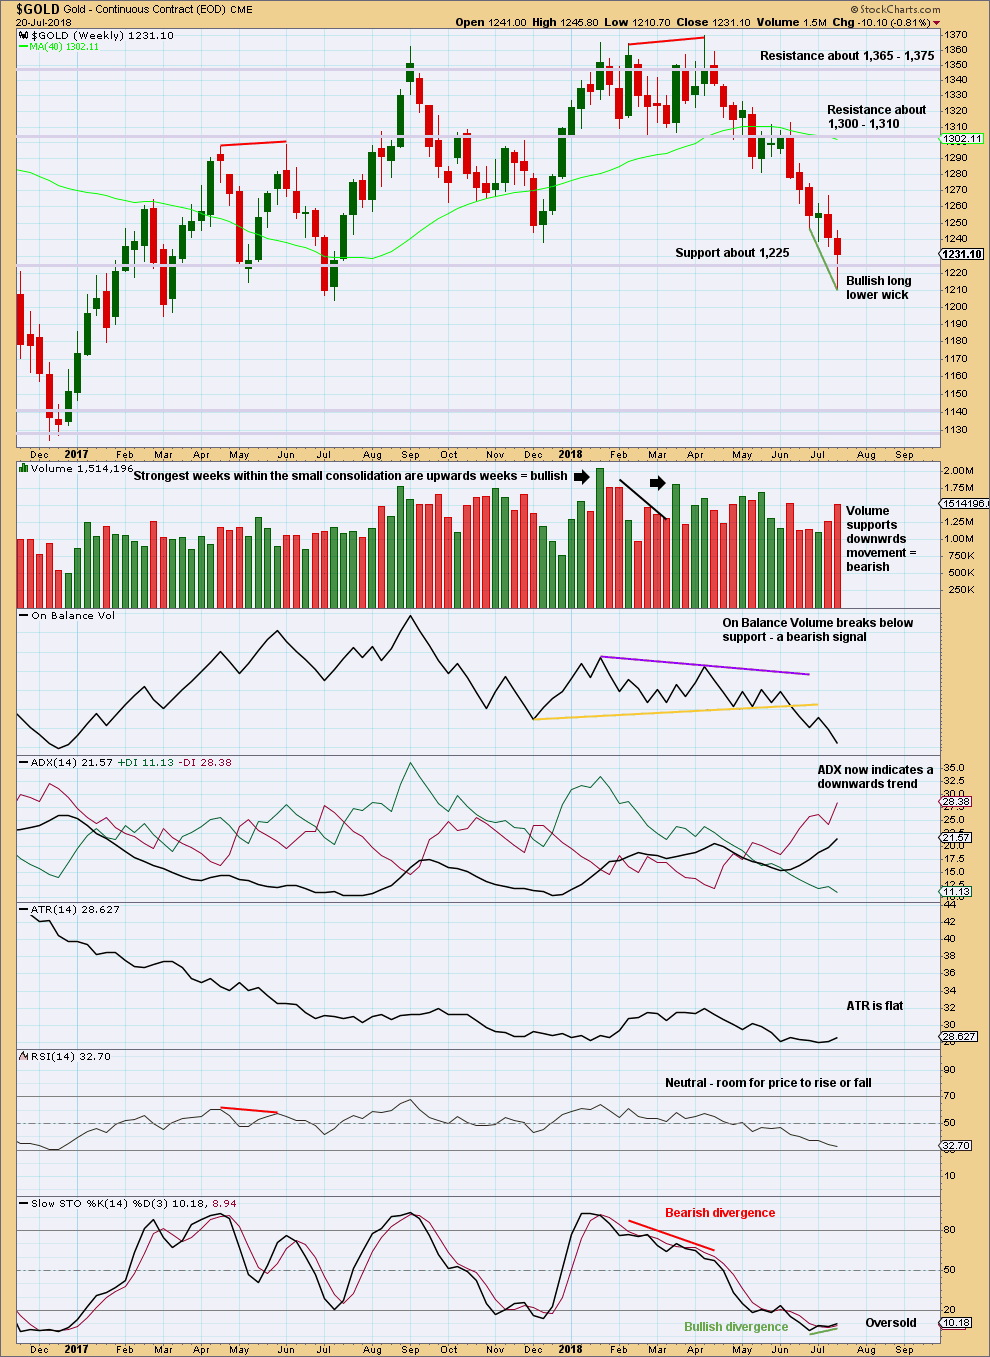
The reasonably long lower wick on the last weekly candlestick is given weight in this analysis. While this is fairly bearish, sometimes more than one long wick develops at price extremes. This week could complete with another long lower wick and a slight new low.
DAILY CHART
Click chart to enlarge. Chart courtesy of StockCharts.com.
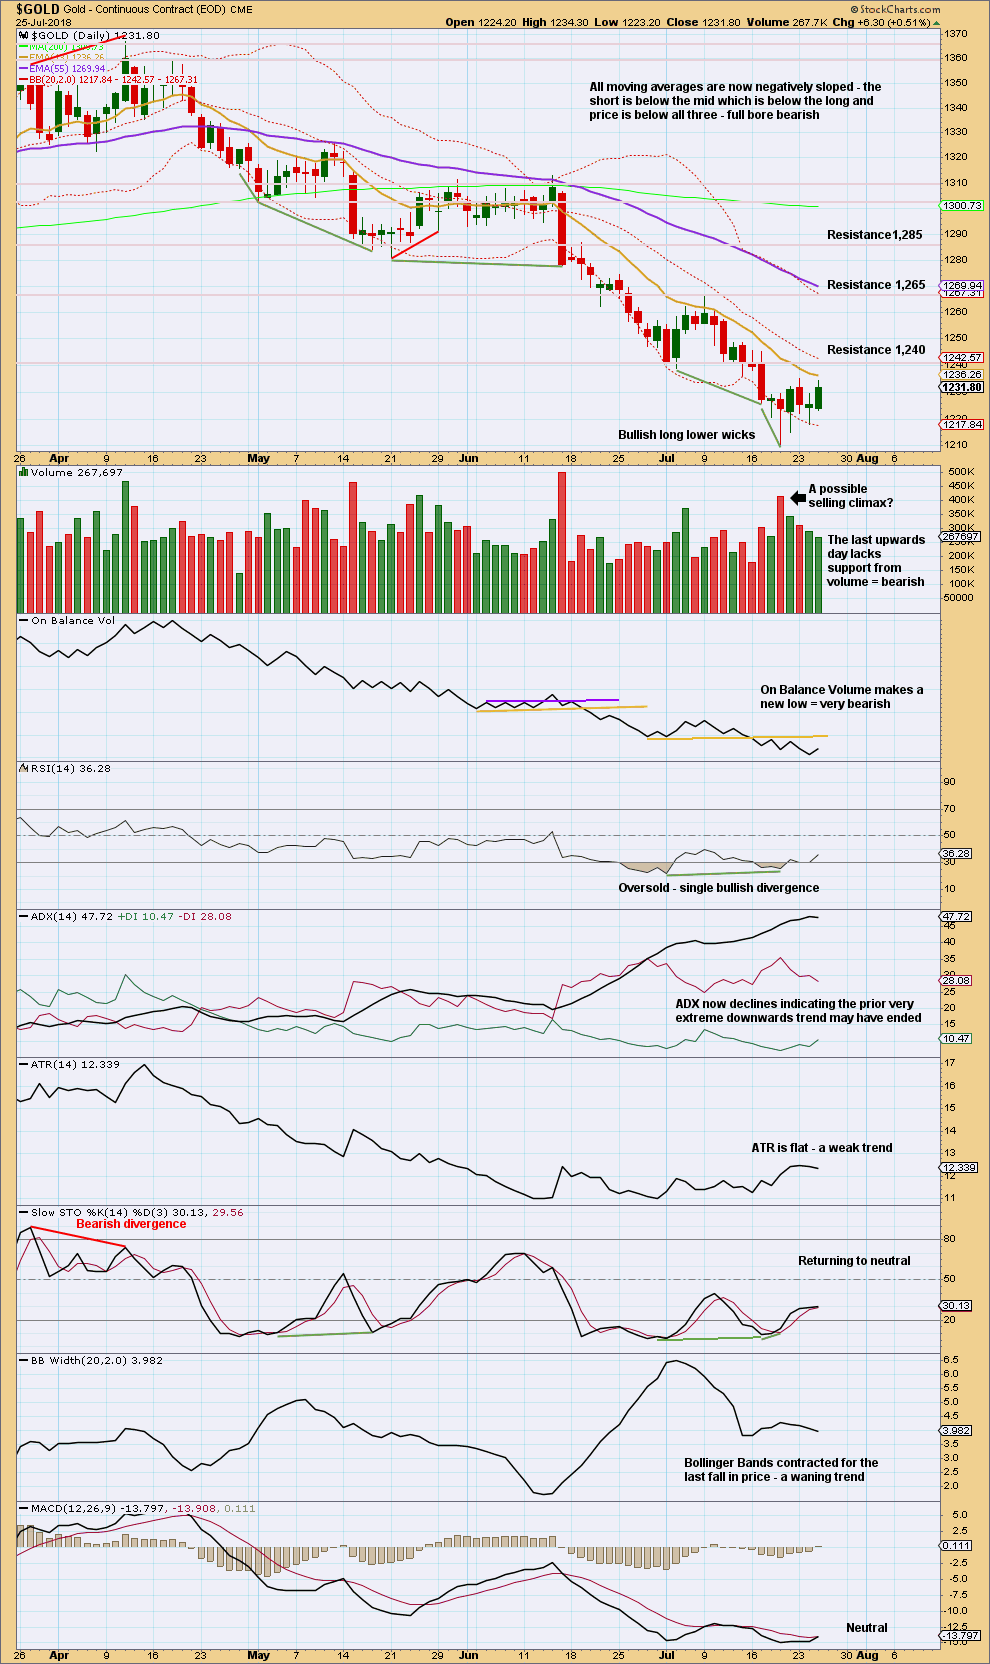
There are now two bullish candlestick reversal patterns at the last low: a Bullish Engulfing pattern and now a Morning Star pattern.
However, there is still a bearish signal yesterday from On Balance Volume making a new low. This contradicts the candlestick patterns.
For the short term, this last session lacks support from volume; it is weak.
The prior downwards trend reached very extreme and oversold levels. Trend changes can be a process and not necessarily a clear pivot, which may be what is happening here.
GDX WEEKLY CHART
Click chart to enlarge. Chart courtesy of StockCharts.com.
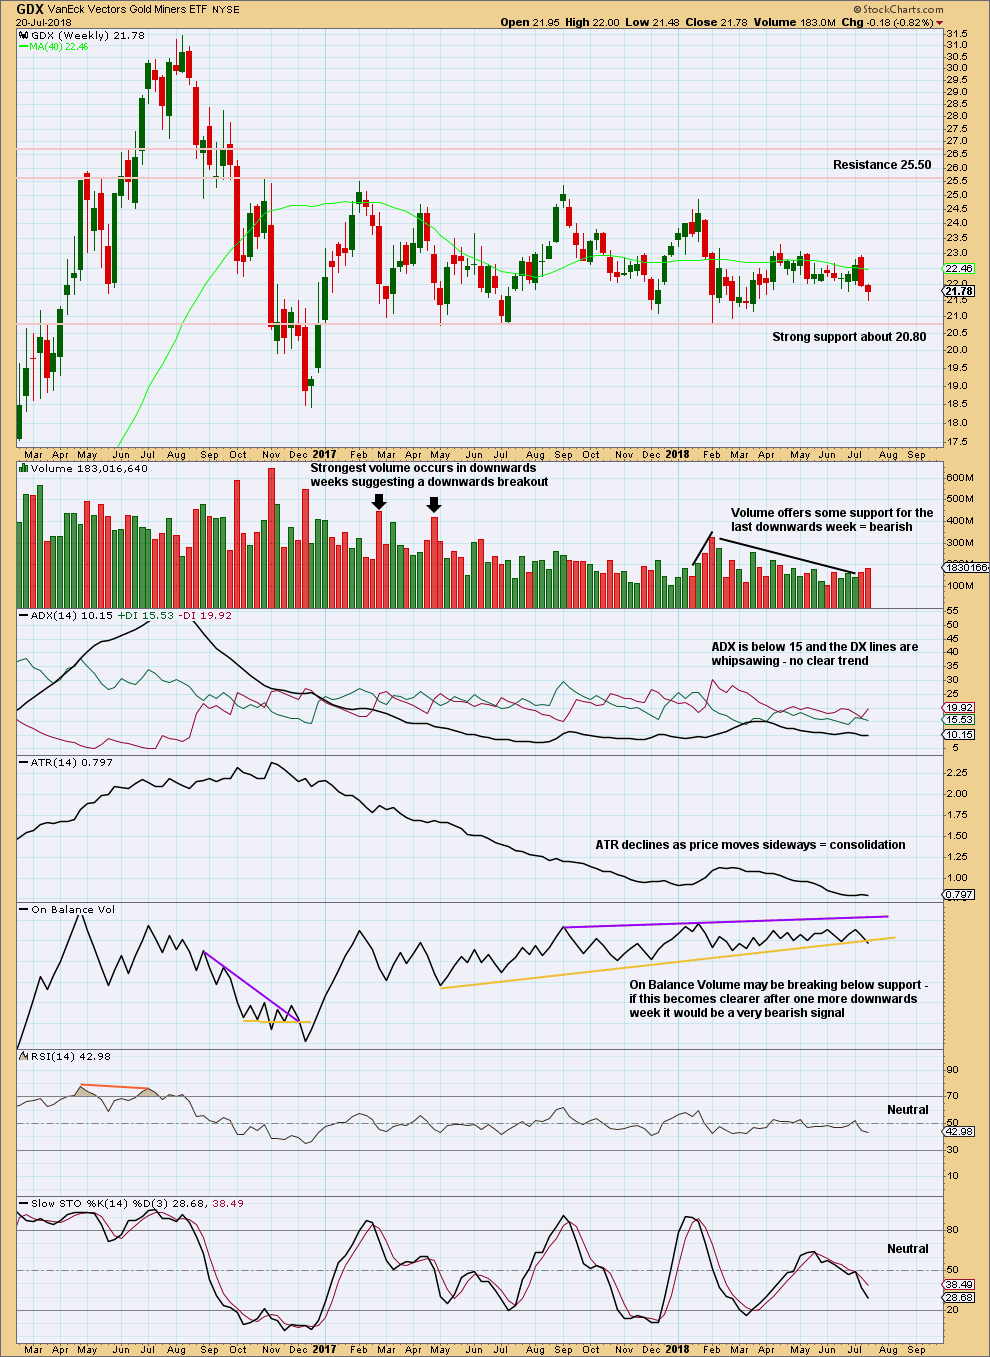
GDX has been range bounce since January 2017. This is a very long sideways consolidation. The longer it continues, the more sustained the eventual breakout will be. Volume suggests the breakout may more likely be downwards.
Support about 20.80 has been tested about eight times and so far has held. The more often a support area is tested and holds, the more technical significance it has.
In the first instance, expect this area to continue to provide support. Only a strong downwards day, closing below support and preferably with some increase in volume, would constitute a downwards breakout from the consolidation.
Resistance is about 25.50. Only a strong upwards day, closing above resistance and with support from volume, would constitute an upwards breakout.
There is again some support this week for downwards movement from volume.
GDX DAILY CHART
Click chart to enlarge. Chart courtesy of StockCharts.com.
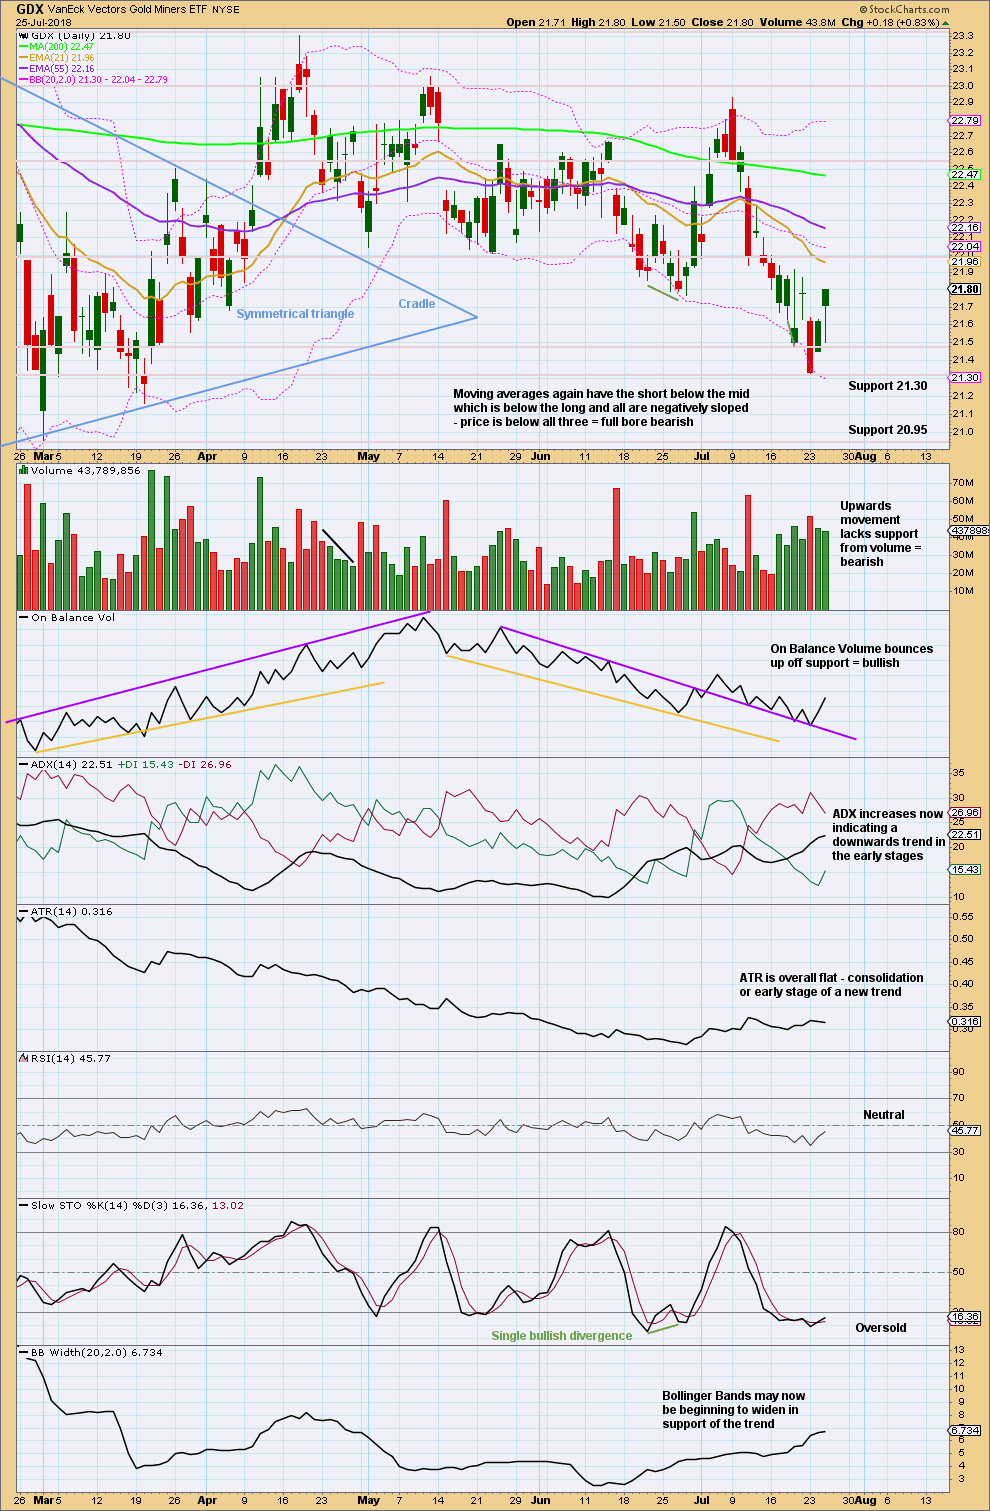
A strong bounce today ends with price close to highs for the session and a long lower wick. This is very bullish. Expect at least some upwards movement in the next session.
However, volume is weak. Although Stochastics is oversold, RSI is not. There is still room for the larger downwards trend to continue.
Published @ 10:47 p.m. EST.
The alternate hourly looks like the one. That weakness in yesterday’s upwards movement does now look like it indicated a B wave.
This structure for minor 2 fits well and looks like a regular flat correction. Regular flats normally have C waves that end only very slightly beyond their A waves, to avoid a truncation (otherwise it’d be a very rare running flat).
It looks like minute c may end when it comes down to touch the lower edge of the wider blue channel.
Lara, with the Fed meeting next week, I’m still looking at the possibility that the bottom of Primary D is not in yet. Thoughts?
https://www.tradingview.com/x/iCYgcy7n/
Similar sentiments here. With a stop in 1240s, imo quite possible to see Gold price break below 1225 and work its self lower for 1217-1208 range to eventually target 1195 in the near term…. Lets see how this pans out.
classic TA points to it being possible.
I’m going to look at strength today within downwards movement, if there is any I’ll consider intermediate (C) incomplete.