
Downwards movement remains above the invalidation point on the hourly Elliott wave count.
Three short term Elliott wave counts are presented today.
Summary: This analysis is bullish at the weekly chart level, but it is possible that a new low to about 1,211 may occur before a trend change.
Always trade with stops to protect your account. Risk only 1-5% of equity on any one trade.
New updates to this analysis are in bold.
Grand SuperCycle analysis is here.
Last historic analysis with monthly charts and several weekly alternates is here, video is here.
Last remaining four weekly wave counts were updated here, and video here.
MAIN ELLIOTT WAVE COUNT
WEEKLY CHART – TRIANGLE
Click chart to enlarge.
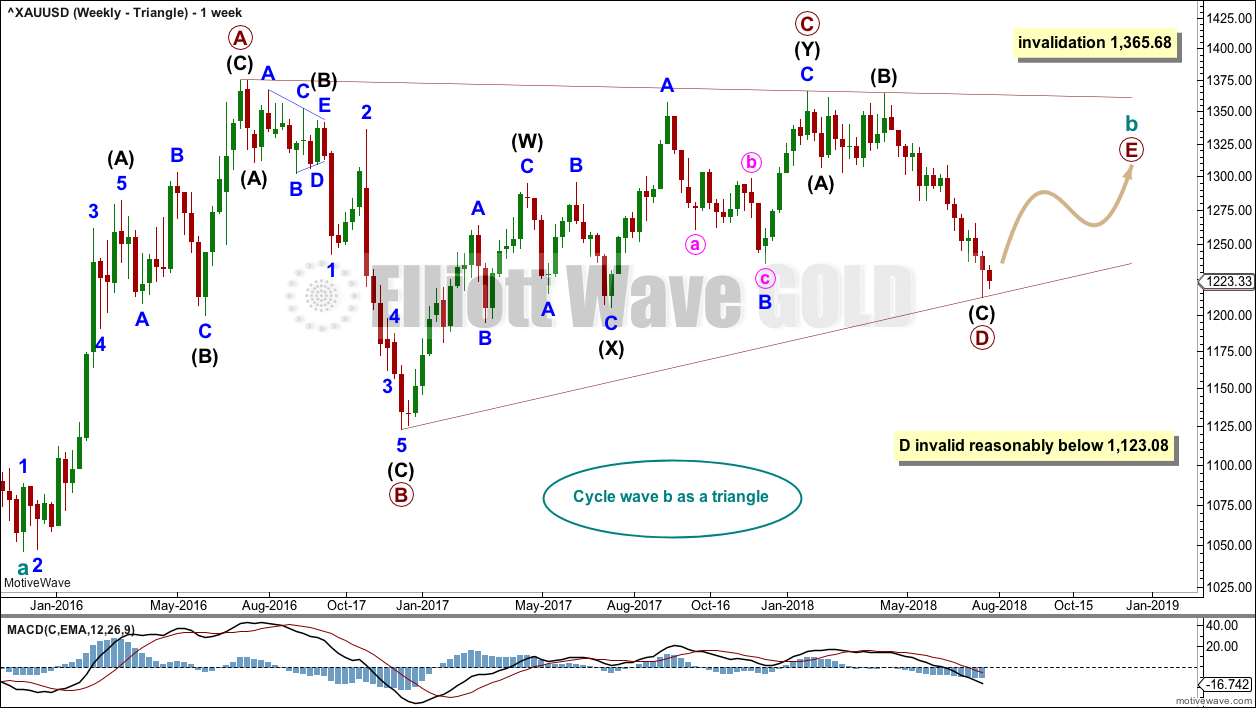
There are four remaining weekly wave counts at this time for cycle wave b: a triangle, flat, combination or double zigzag. At this stage, all four expect a bounce over the next few weeks, and the triangle has the best look.
While the direction does not diverge for these four weekly wave counts, only one weekly wave count shall be published on a daily basis, so that the analysis is manageable for me to publish and for members to digest. Note: This does not mean that the remaining three counts may not be correct.
The triangle so far has the best fit and look.
Cycle wave b may be an incomplete triangle. The triangle may be a contracting or barrier triangle, with a contracting triangle looking much more likely because the A-C trend line does not have a strong slope. A contracting triangle could see the B-D trend line have a stronger slope, so that the triangle trend lines converge at a reasonable rate. A barrier triangle would have a B-D trend line that would be essentially flat, and the triangle trend lines would barely converge.
Within a contracting triangle, primary wave D may not move beyond the end of primary wave B below 1,123.08. Within a barrier triangle, primary wave D may end about the same level as primary wave B at 1,123.08, so that the B-D trend line is essentially flat. Only a new low reasonably below 1,123.08 would invalidate the triangle.
Within both a contracting and barrier triangle, primary wave E may not move beyond the end of primary wave C above 1,365.68.
Four of the five sub-waves of a triangle must be zigzags, with only one sub-wave allowed to be a multiple zigzag. Primary wave C is the most common sub-wave to subdivide as a multiple, and this is how primary wave C for this example fits best.
Primary wave D must be a single structure, most likely a zigzag. It is possible that primary wave D could be over.
One triangle sub-wave tends to be close to 0.618 the length of its predecessor; if primary wave D is over at last week’s low, it is just 3.64 below this point.
There are no problems in terms of subdivisions or rare structures for this wave count. It has an excellent fit and so far a typical look.
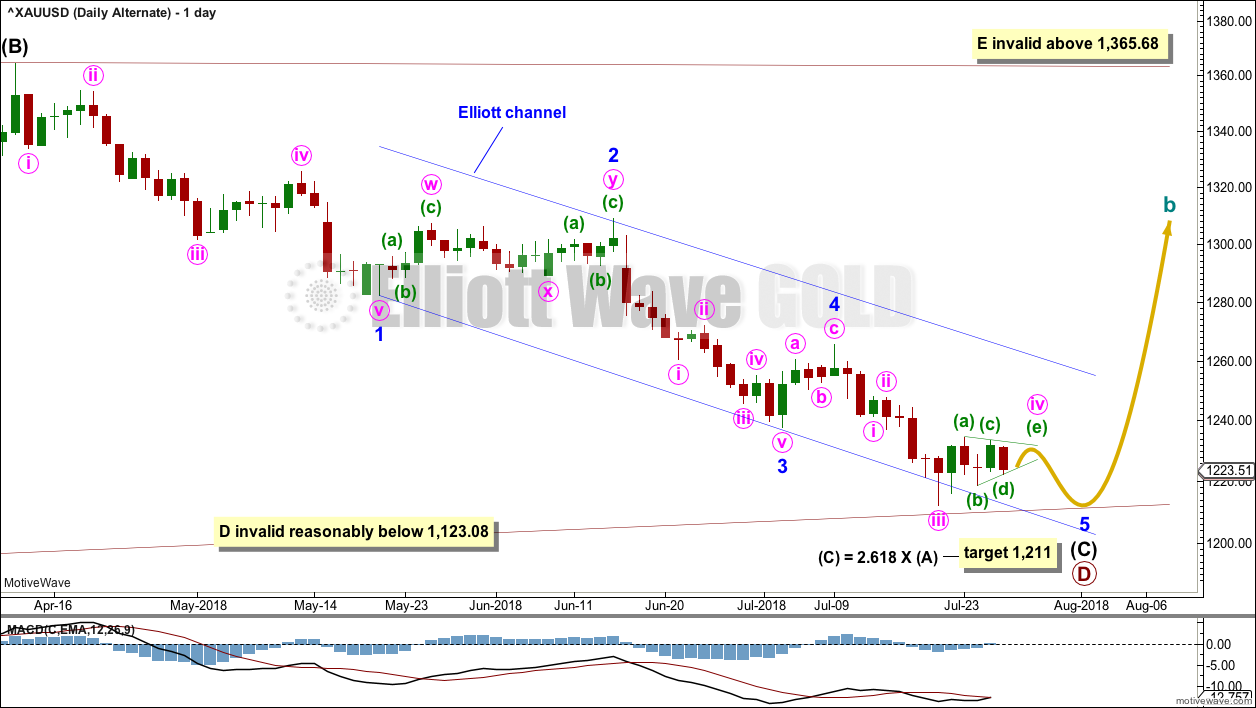
DAILY CHART – TRIANGLE
Click chart to enlarge.
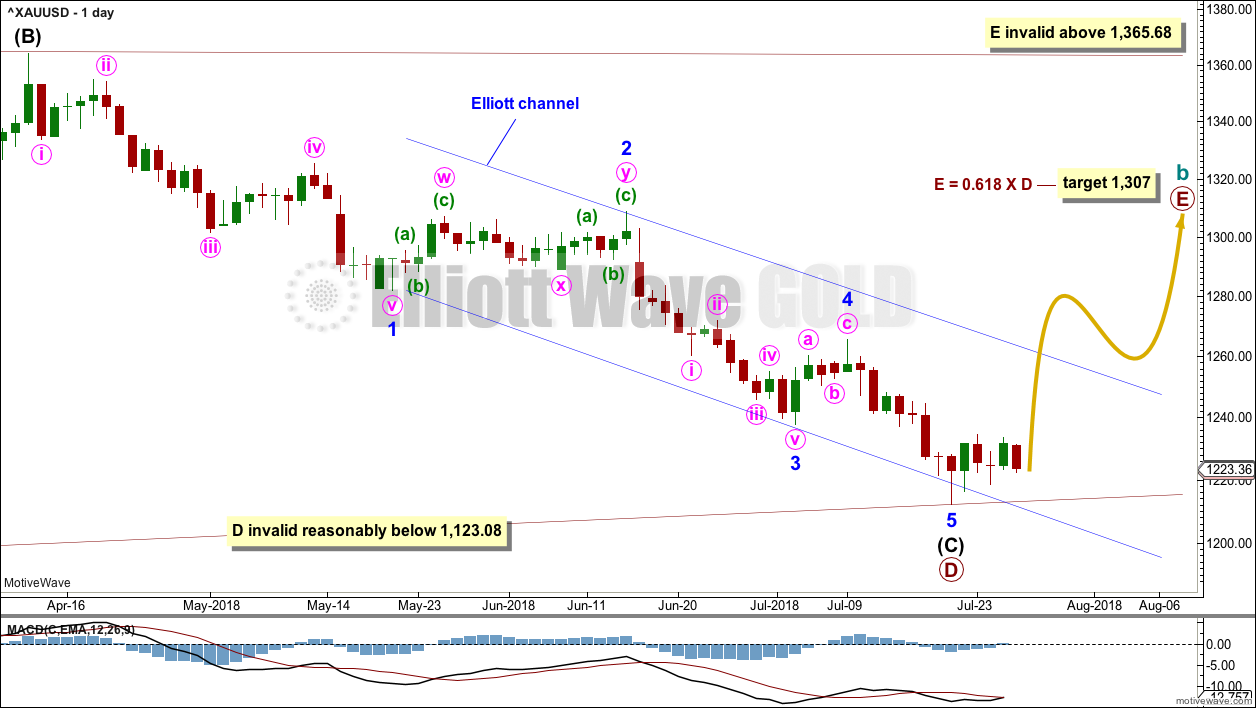
It is possible that primary wave D is over. The structure may be seen complete and technical analysis at the weekly chart level indicates a low may now be in place.
At this stage, the best target calculation for primary wave E would be 0.618 the length of primary wave D. This yields a target that is within a very strong area of resistance.
When intermediate waves (A) and (B) within primary wave E may be complete, then the ratio between intermediate waves (A) and (C) may be used to add to the target calculation at a second degree. At that stage, it may change or widen to a zone.
Primary wave E would be most likely to fall reasonably short of the A-C trend line.
In the first instance, primary wave E may be expected to last about a Fibonacci 21 weeks. It is also possible that it may not last that long because E waves of a triangle can be relatively quick.
MAIN HOURLY CHART
Click chart to enlarge.
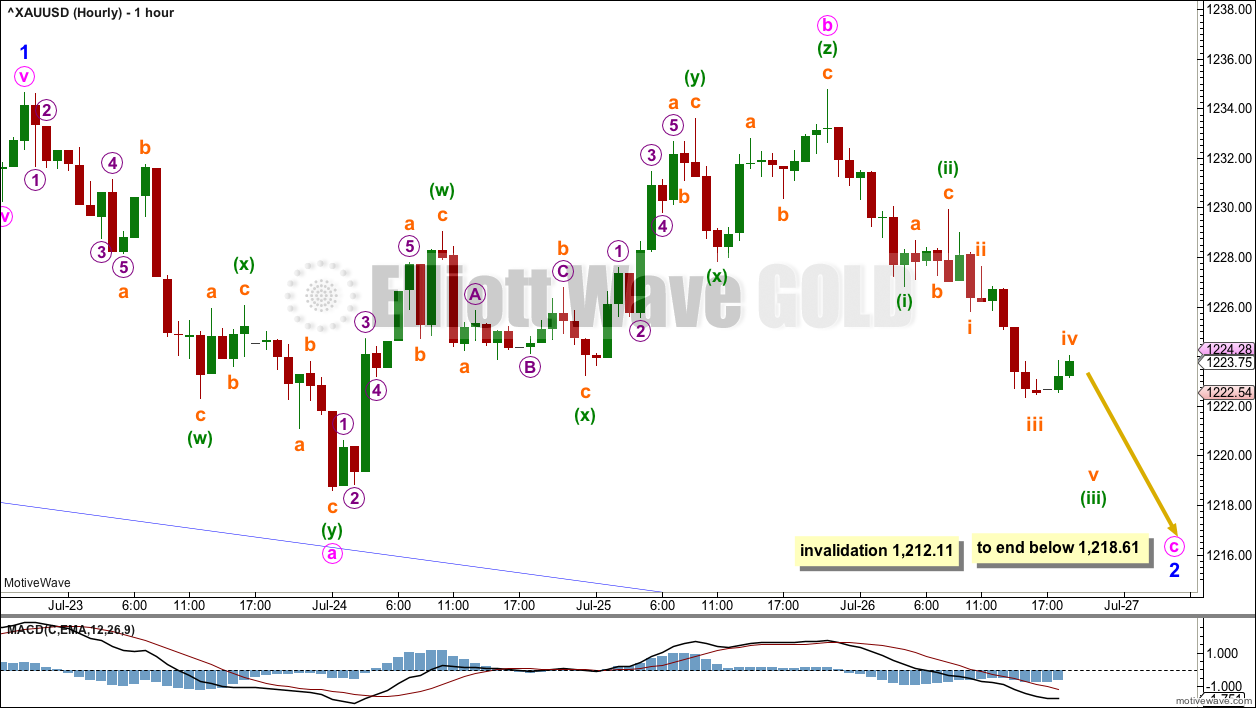
It is possible that minor wave 2 is not over and may complete as a regular flat correction.
Within a flat, both minute waves a and b must subdivide as corrective structures. Here, minute wave a may be a double zigzag and minute wave b may be a rare triple zigzag.
Minute wave c would be extremely likely to make at least a slight new low below the end of minute wave a at 1,218.61 to avoid a truncation and a very rare running flat. Minor wave 2 may not move beyond the start of minor wave 1 below 1,212.11.
Regular flats have C waves that normally end only slightly beyond the end of wave A.
ALTERNATE HOURLY CHART
Click chart to enlarge.
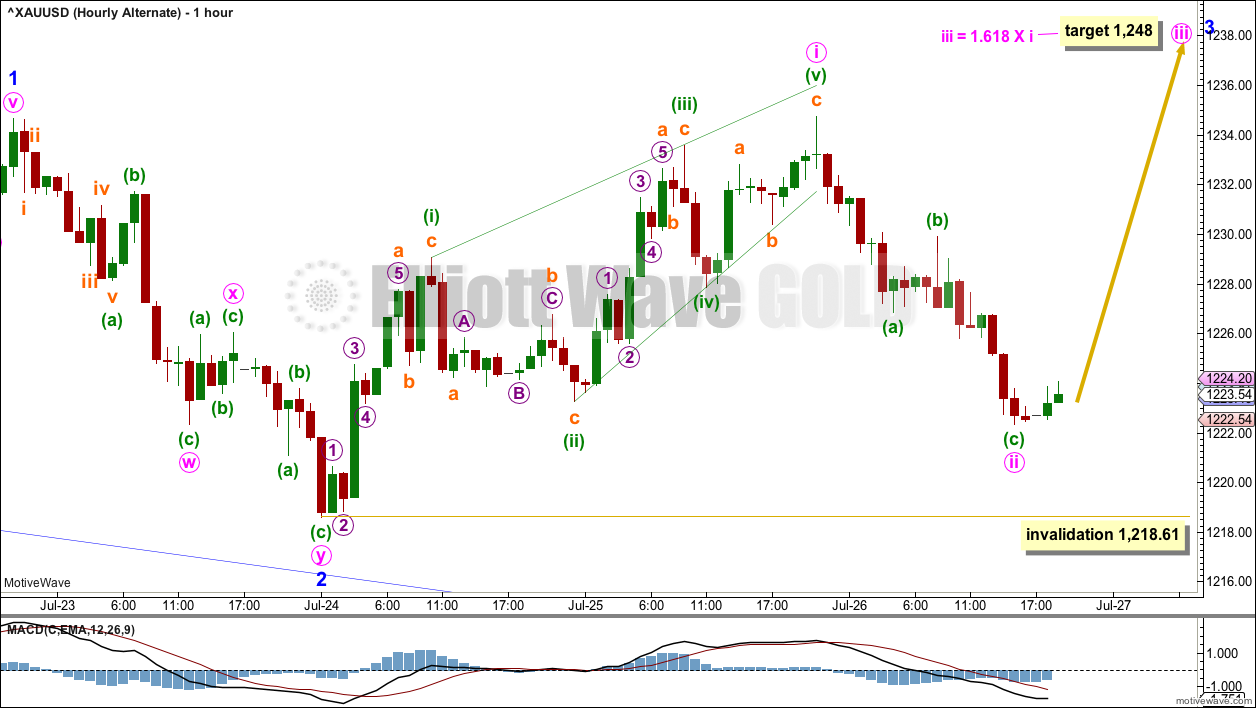
It remains possible that minor wave 2 was over at the last low.
The last upwards wave will subdivide as a leading contracting diagonal, which meets all Elliott wave rules; this is a more common structure than a triple zigzag and has the same subdivisions. In Elliott Wave terms, this wave count has a higher probability than the main hourly wave count; however, because it has less support today from classic technical analysis, it is judged to be an alternate.
Leading diagonals in first wave positions are usually followed by very deep second wave corrections. Minute wave ii is 0.77 of minute wave i, fitting the description of very deep. This wave count follows a common pattern.
A target for minute wave iii is calculated. Minute wave iii of minor wave 3 upwards should exhibit some increase in momentum.
Minute wave ii may not move beyond the start of minute wave i below 1,218.61.
DAILY CHART – TRIANGLE – ALTERNATE
Click chart to enlarge.
It is possible that primary wave D is not over and one final new low may complete it.
Sideways movement of the last five days may be a small regular contracting triangle for minute wave iv within minor wave 5. Although this is now fairly disproportionate to minute wave ii, triangles are usually more time consuming structures than zigzags.
The target for primary wave D expects only a slight new low. The movement out of triangles is often surprisingly short and brief, so this target fits that common pattern.
TECHNICAL ANALYSIS
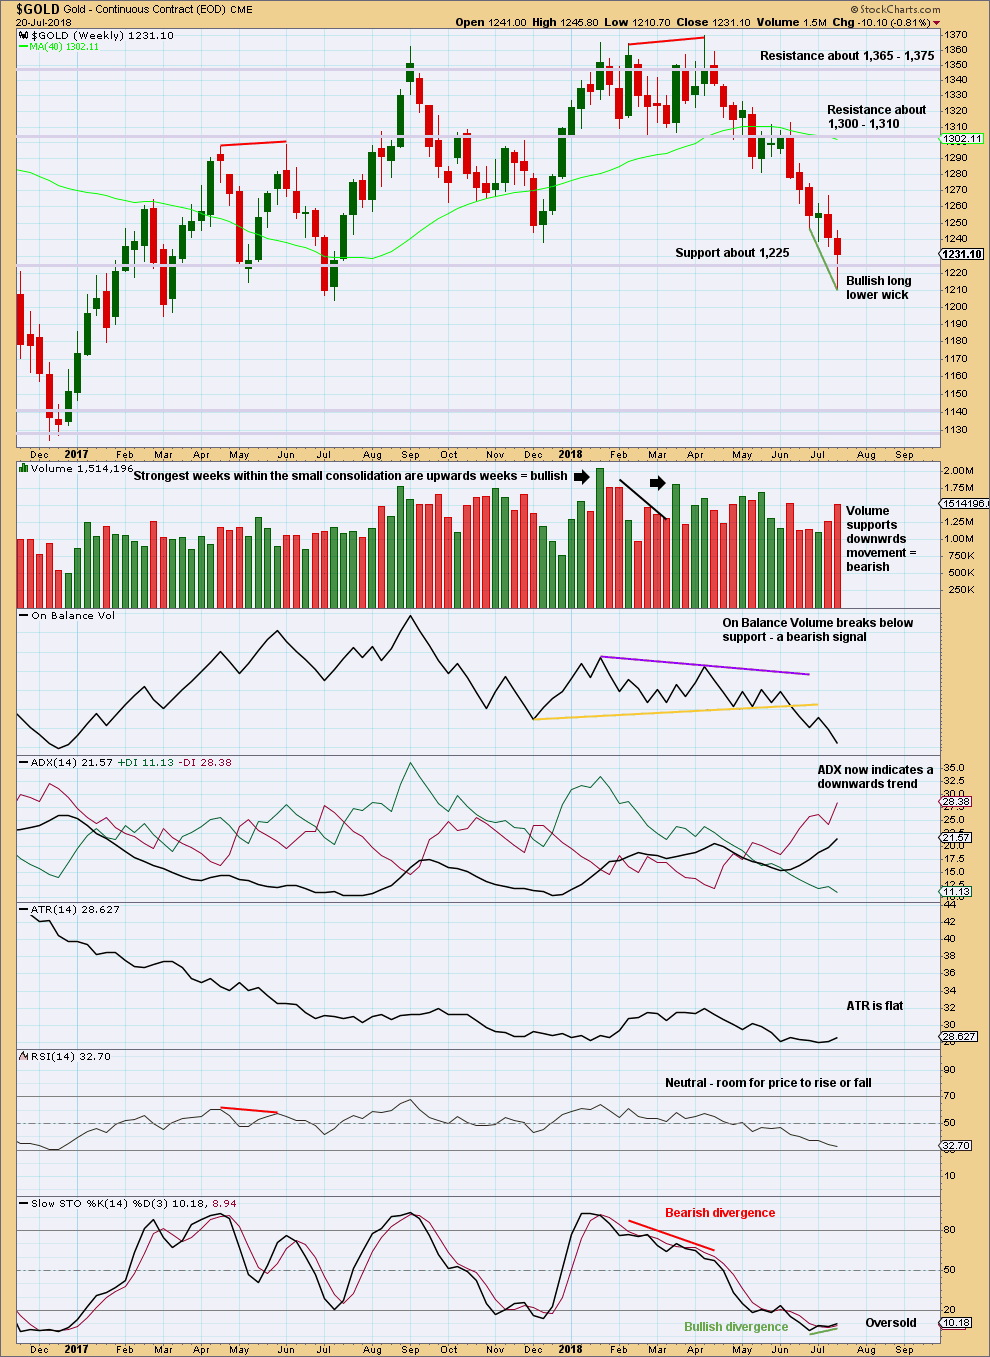
WEEKLY CHART
Click chart to enlarge. Chart courtesy of StockCharts.com.
The reasonably long lower wick on the last weekly candlestick is given weight in this analysis. While this is fairly bearish, sometimes more than one long wick develops at price extremes. This week could complete with another long lower wick and a slight new low.
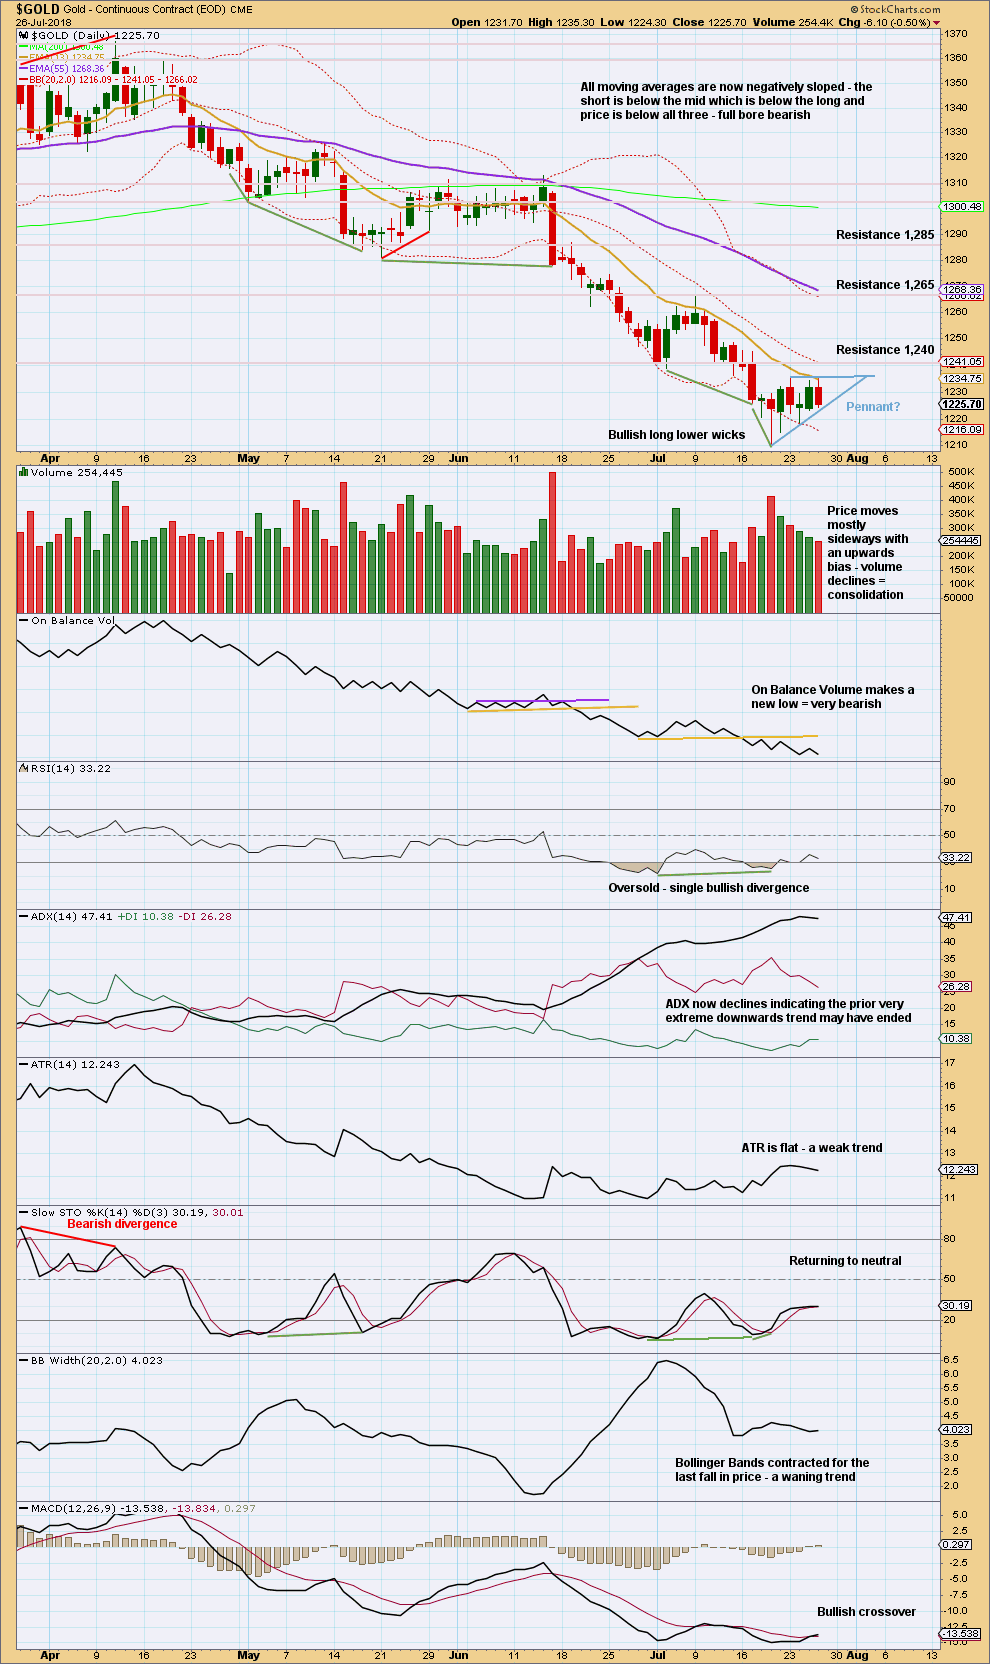
DAILY CHART
Click chart to enlarge. Chart courtesy of StockCharts.com.
The last five sessions now look like a small pennant pattern that may be forming. These are fairly reliable continuation patterns. A target calculated using the measured rule is about 1,167, which may be rather optimistic given how extreme this downwards trend was.
The candlestick reversal patterns are still valid. Candlestick reversal patterns make no comment on the direction of the next trend; it may be either a 180 degree reversal to an opposite direction, or a 90 degree reversal to sideways. Nor do they make any comment on the duration of the next trend. Thus, a candlestick reversal pattern can signal a complete trend change or a small consolidation. A new low is possible prior to an end to this downwards trend and a new upwards trend.
RSI is now back into neutral territory. ADX indicates the prior downwards trend was very extreme and may now have ended.
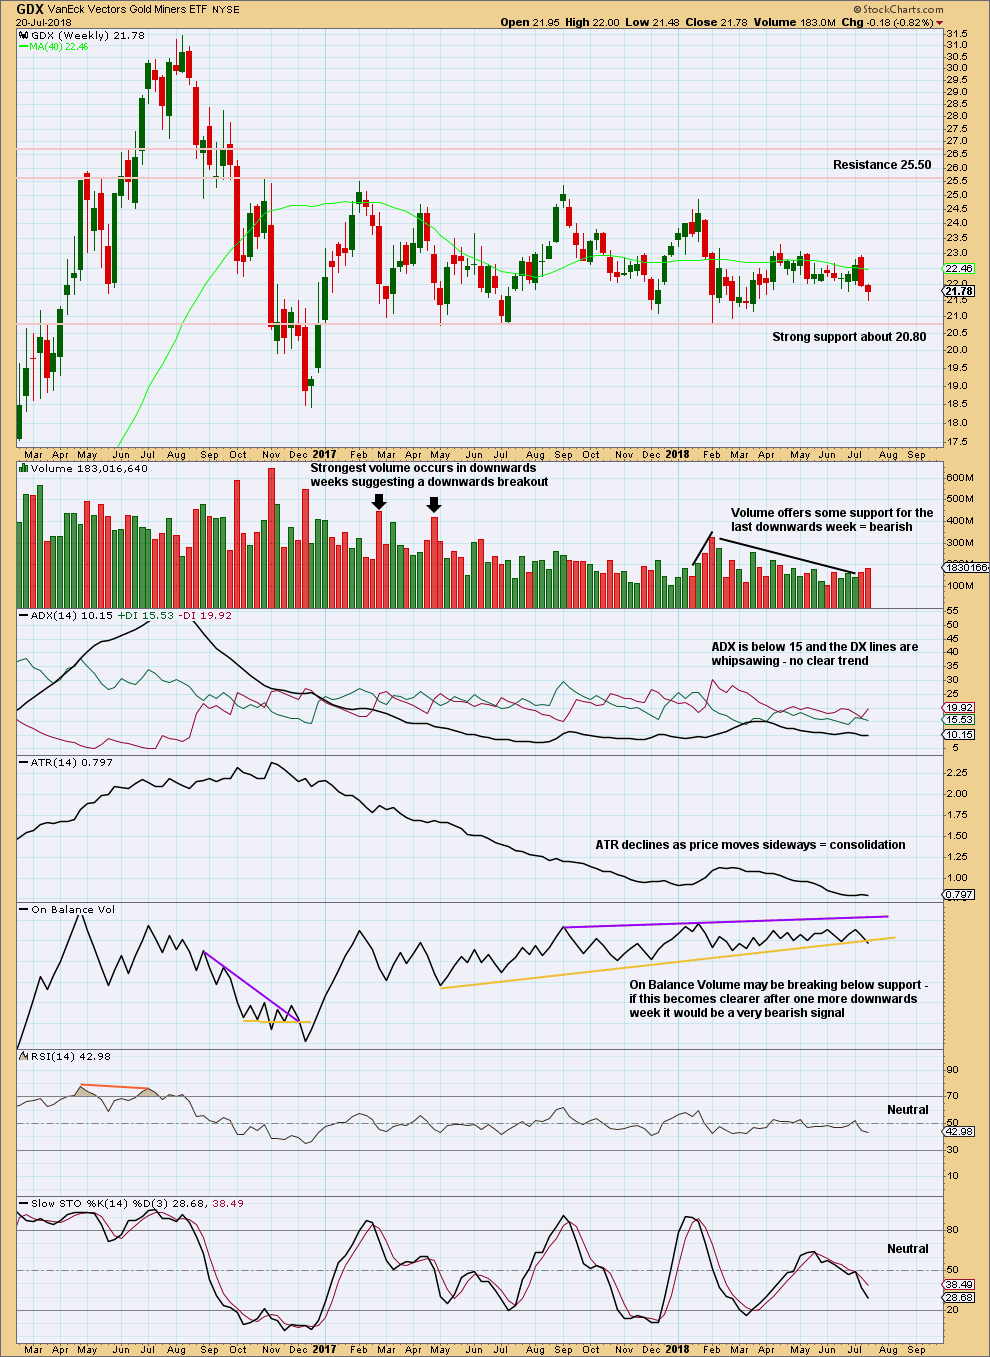
GDX WEEKLY CHART
Click chart to enlarge. Chart courtesy of StockCharts.com.
GDX has been range bounce since January 2017. This is a very long sideways consolidation. The longer it continues, the more sustained the eventual breakout will be. Volume suggests the breakout may more likely be downwards.
Support about 20.80 has been tested about eight times and so far has held. The more often a support area is tested and holds, the more technical significance it has.
In the first instance, expect this area to continue to provide support. Only a strong downwards day, closing below support and preferably with some increase in volume, would constitute a downwards breakout from the consolidation.
Resistance is about 25.50. Only a strong upwards day, closing above resistance and with support from volume, would constitute an upwards breakout.
There is again some support this week for downwards movement from volume.
GDX DAILY CHART
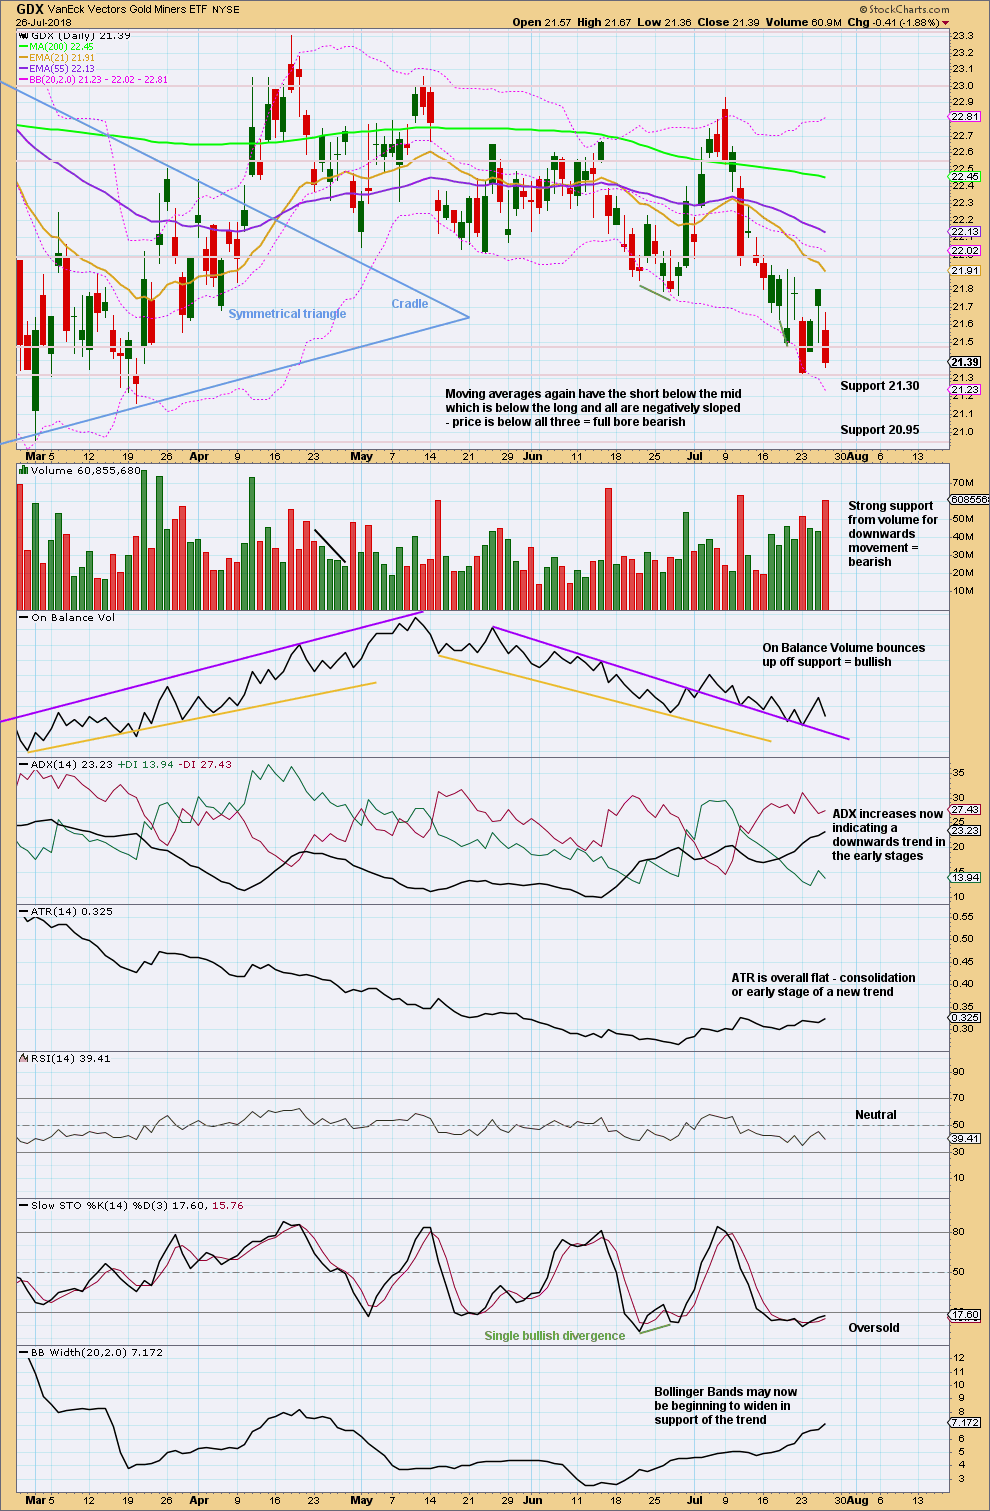
Click chart to enlarge. Chart courtesy of StockCharts.com.
Yesterday’s very bullish daily candlestick was not followed by more upwards movement. Today’s candlestick looks fairly bearish, particularly as it has support from volume.
There is a lot more room below for GDX to move into. If it can break below support about 21.30, then look for strong support below in a zone about 20.95 to 20.80.
Published @ 08:28 p.m. EST.
Hourly chart updated:
If downwards movement today shows more weakness that would support this wave count.
It looks like minor 2 is a compete regular flat. Minor 3 now can have a target calculated.
Looks like a 5 up from the lows below 2118 completed, now a correction on the way.
Mixed signals from miners as GDX is weak but GDXJ has been green all day so far. Will watch GDX closely as a break below today’s lows likely signals gold has more down movement.
But we’re close to a bounce either way
One of the reasons I see either a very deep retrace for Gold or a new low is because of this possible ending diagonal pattern for the USD which expects a slight new high before reversal. A bullish engulfing candle today supports more up in the USD.
Fed meeting next Tues/Wed is another reason for the bottom to come in Gold next week.
https://www.tradingview.com/x/wAMrsdPq/
I agree, the bottom of gold will be in if king dollar forms a meaningful top. Dollar and gold are highly correlated…