More downwards movement for both Gold and GDX has unfolded exactly as expected.
The short term target for GDX was 18.17. A low today for GDX at 18.15 met and slightly exceeded the target.
Summary: With support from volume, GDX has effected a downwards breakout from a very long held consolidation (beginning December 2016). The long term target is at 16.02.
There is still no reversal signal yet from GDX; expect it to keep falling until we can see a bullish candlestick reversal pattern. Alternatively, with the trend now extreme and RSI now deeply oversold, members may like to take some profit for short term trades. Positions opened at the breakout at 20.80 may still be profitable long term.
Measuring gaps may be used to adjust stops as they are rarely closed. Any longer term short positions for GDX which remain open may now have stops moved down to just above 19.74.
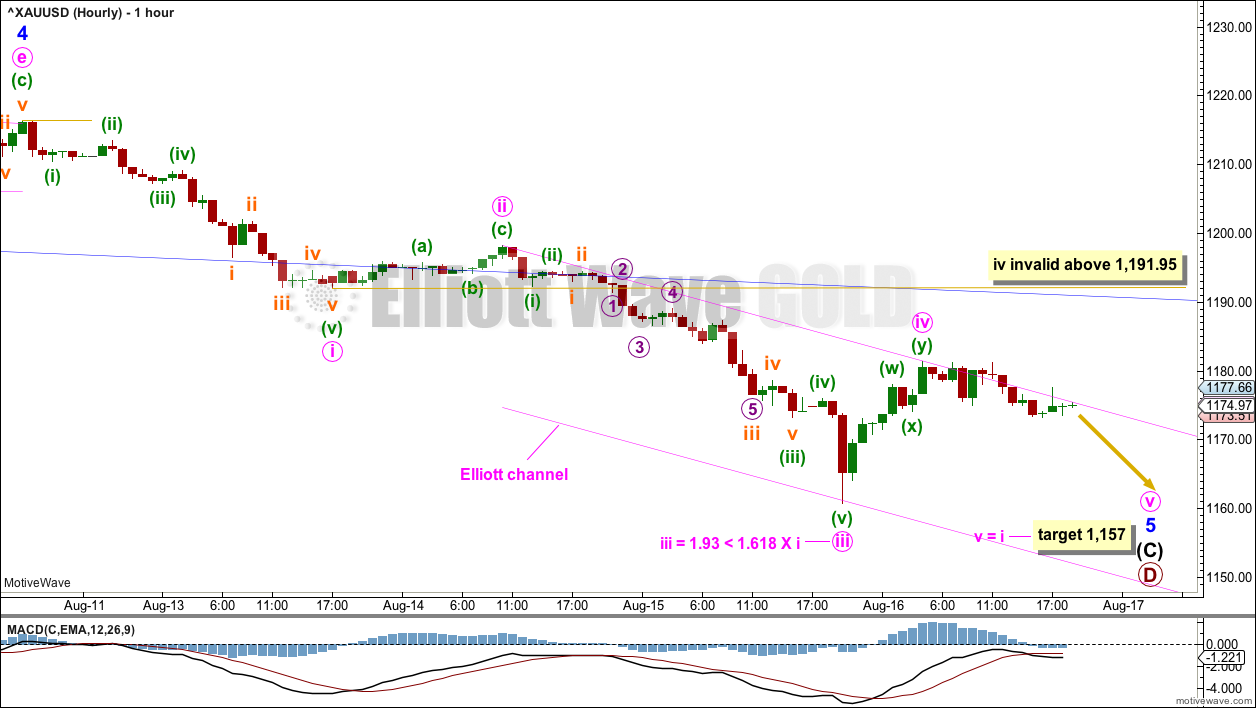
The target for Gold is now at 1,157. About this target a bounce is expected for a multi week throwback or consolidation.
Always trade with stops to protect your account. Risk only 1-5% of equity on any one trade.
New updates to this analysis are in bold.
Grand SuperCycle analysis is here.
Last historic analysis with monthly charts and several weekly alternates is here, video is here.
Weekly charts were last all reviewed here, with video here.
MAIN ELLIOTT WAVE COUNT
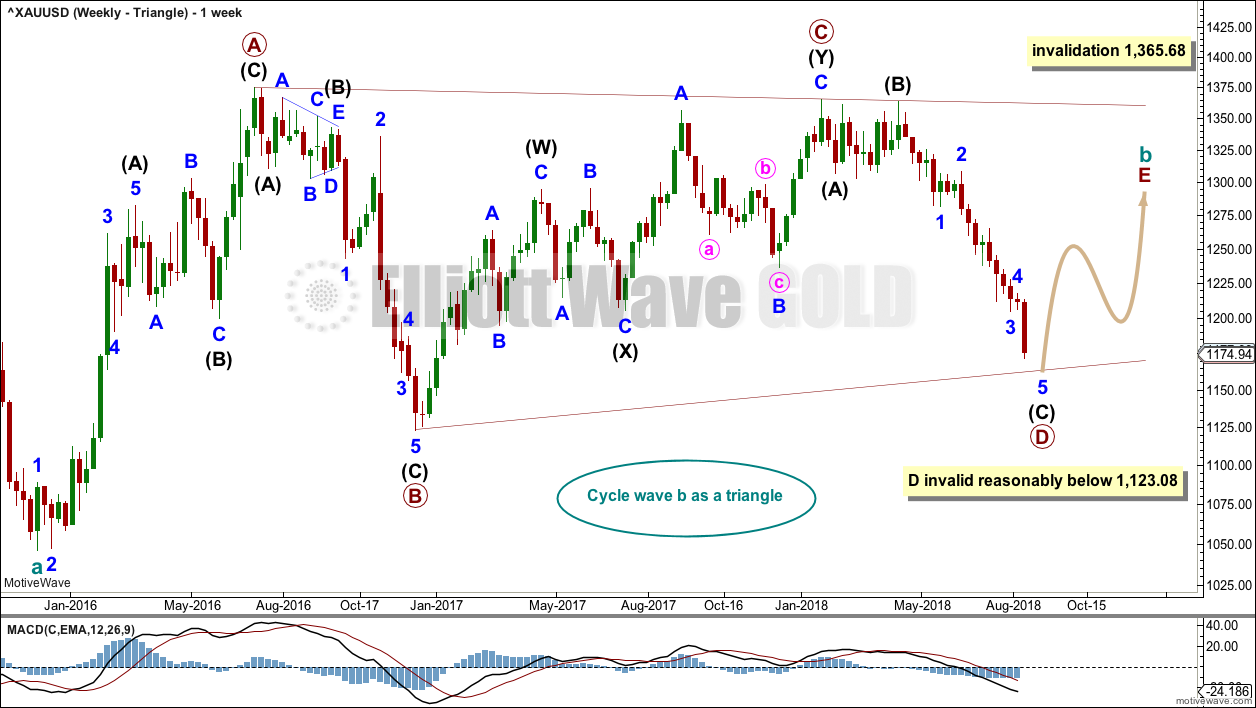
WEEKLY CHART – TRIANGLE
There are four remaining weekly wave counts at this time for cycle wave b: a triangle, flat, combination or double zigzag. Only one weekly chart shall be published Monday to Thursday and all four weekly charts will be reviewed at the end of the week after the close of Friday’s session.
While the direction does not diverge for these four weekly wave counts, only one weekly wave count shall be published on a daily basis, so that the analysis is manageable for me to publish and for members to digest. Note: This does not mean that the remaining three counts may not be correct.
The triangle so far has the best fit and look.
Cycle wave b may be an incomplete triangle. The triangle may be a contracting or barrier triangle, with a contracting triangle looking much more likely because the A-C trend line does not have a strong slope. A contracting triangle could see the B-D trend line have a stronger slope, so that the triangle trend lines converge at a reasonable rate. A barrier triangle would have a B-D trend line that would be essentially flat, and the triangle trend lines would barely converge.
Within a contracting triangle, primary wave D may not move beyond the end of primary wave B below 1,123.08. Within a barrier triangle, primary wave D may end about the same level as primary wave B at 1,123.08, so that the B-D trend line is essentially flat. Only a new low reasonably below 1,123.08 would invalidate the triangle.
Within both a contracting and barrier triangle, primary wave E may not move beyond the end of primary wave C above 1,365.68.
Four of the five sub-waves of a triangle must be zigzags, with only one sub-wave allowed to be a multiple zigzag. Primary wave C is the most common sub-wave to subdivide as a multiple, and this is how primary wave C for this example fits best.
Primary wave D must be a single structure, most likely a zigzag.
There are no problems in terms of subdivisions or rare structures for this wave count. It has an excellent fit and so far a typical look.
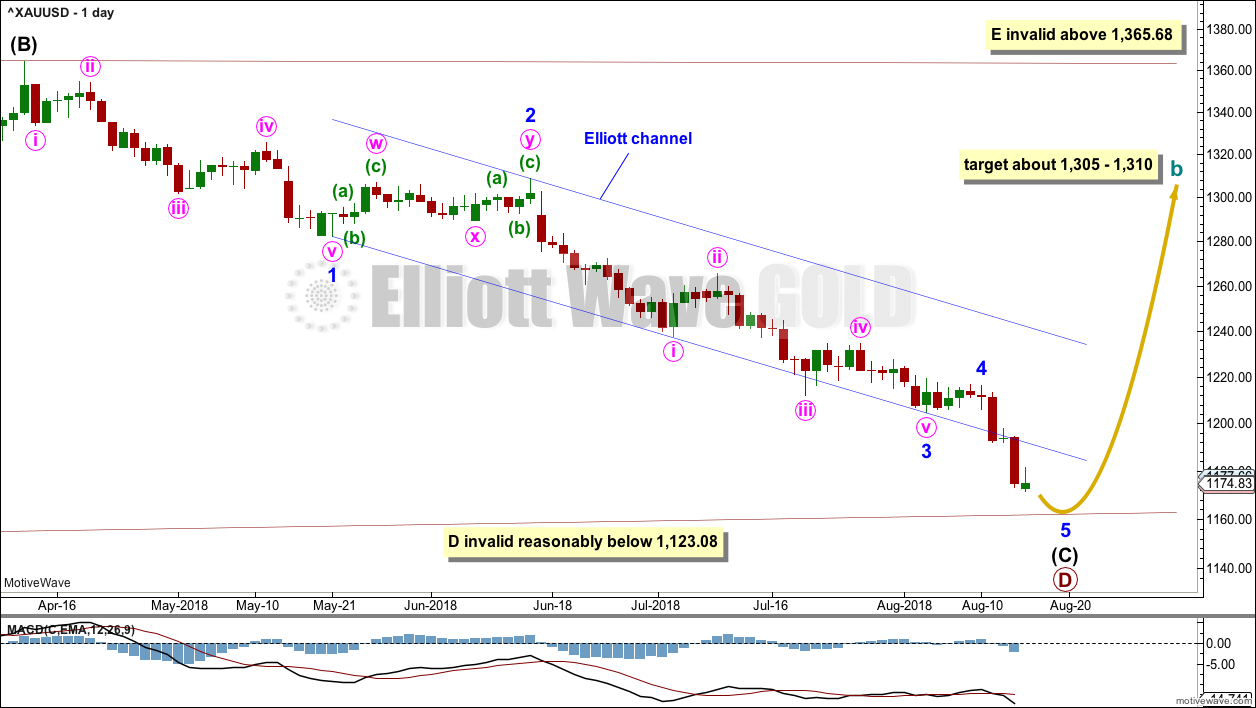
DAILY CHART – TRIANGLE
Primary wave D may now be close to completion with minor wave 5 completing. It is also possible today again that primary wave D could be over. This possibility is covered in an alternate hourly wave count today.
Minor wave 5 has not found support at the lower edge of the blue Elliott channel; it has now overshot the channel. Fifth waves for commodities do sometimes exhibit strength and do sometimes overshoot channels.
If price turns up and breaks above the upper edge of this channel, then that shall be a very strong indication that the downwards wave of intermediate wave (C) should be over and a new upwards wave should have begun.
Minor wave 4 looks like a complete triangle. Gold often exhibits surprisingly short fifth waves out of its fourth wave triangles.
Minor wave 4 may not move into minor wave 1 price territory above 1,282.20.
HOURLY CHART
Minor wave 5 may be still an incomplete impulse.
The target now expects minute wave v to be about even in length with minute wave i, so that all actionary waves within minor wave 5 are close to even in length. This target would view none of the waves of minute waves i, iii and v as extended. This is also possible.
Minute wave ii was a shallow 0.26 zigzag lasting 17 hours. Minute wave iv may be a complete deep 0.55 double zigzag lasting 8 hours. There is alternation in depth but not in structure, which is possible (alternation is a guideline, not a rule, and is not always seen perfectly).
A channel is drawn about minor wave 5 using Elliott’s second technique. Upwards movement is finding resistance about the upper edge of this channel.
The target is recalculated. This target is exactly the same as a target calculated using classic technical analysis, so it may have a reasonable probability.
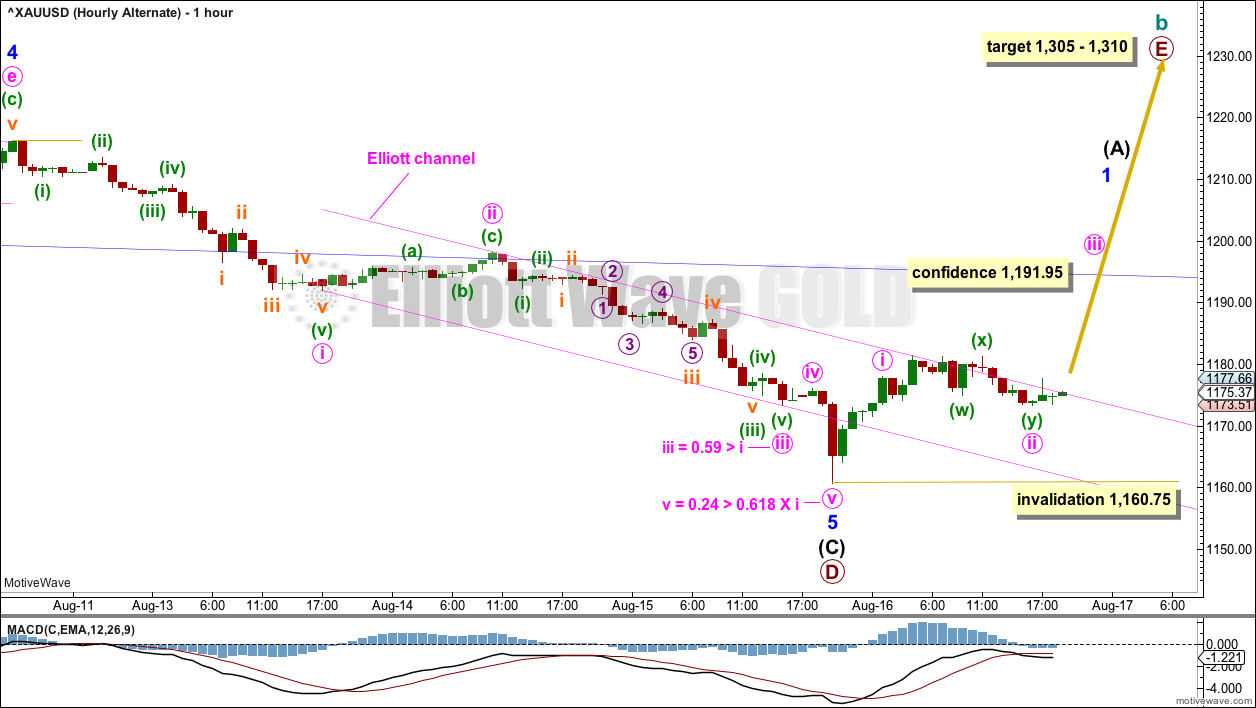
ALTERNATE HOURLY CHART
It is again possible that the whole structure of primary wave D is over and a primary degree trend change may have occurred a few hours ago.
Fibonacci ratios for this wave count are excellent, and the final fifth wave may have overshot all channels to the downside as it exhibited typical commodity like behaviour.
This wave count today has some support from classic technical analysis in that a Hammer candlestick reversal pattern may be seen on the daily chart (Stockcharts data).
A new high above 1,191.95 is required to invalidate the main hourly wave count, and for any confidence in this wave count.
Thereafter, a breach of the wider blue channel on the daily chart would add substantial confidence that a low would be in place.
Primary wave E should last several weeks. It should be a clear three wave structure at the daily chart level, with a consolidation or pullback within it for intermediate wave (B). Primary wave E may end about resistance, at about 1,305 – 1,310, which is very strong.
Within primary wave E, no second wave correction may move beyond the start of its first wave below 1,160.75.
TECHNICAL ANALYSIS
WEEKLY CHART
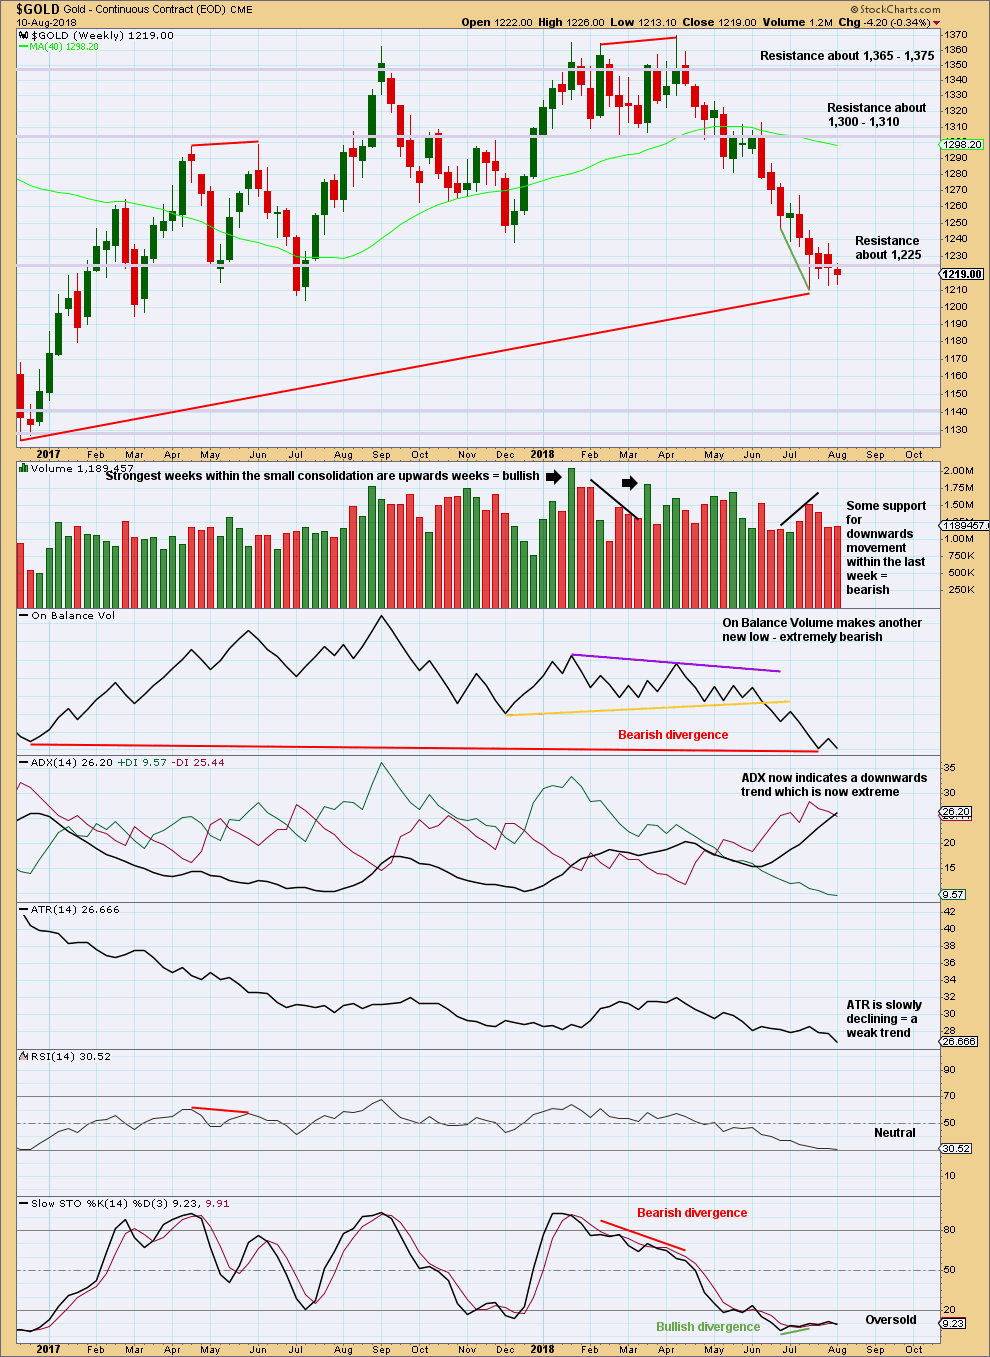
Click chart to enlarge. Chart courtesy of StockCharts.com.
The long term picture for this chart is bearish due to the long term bearish divergence between price and On Balance Volume.
Short term bullishness may have now been resolved by some sideways movement.
For this market, when a strong trend is unfolding, ADX may reach very extreme and may continue as such for several weeks.
Low and declining ATR looks normal for a B wave, particularly a triangle.
DAILY CHART
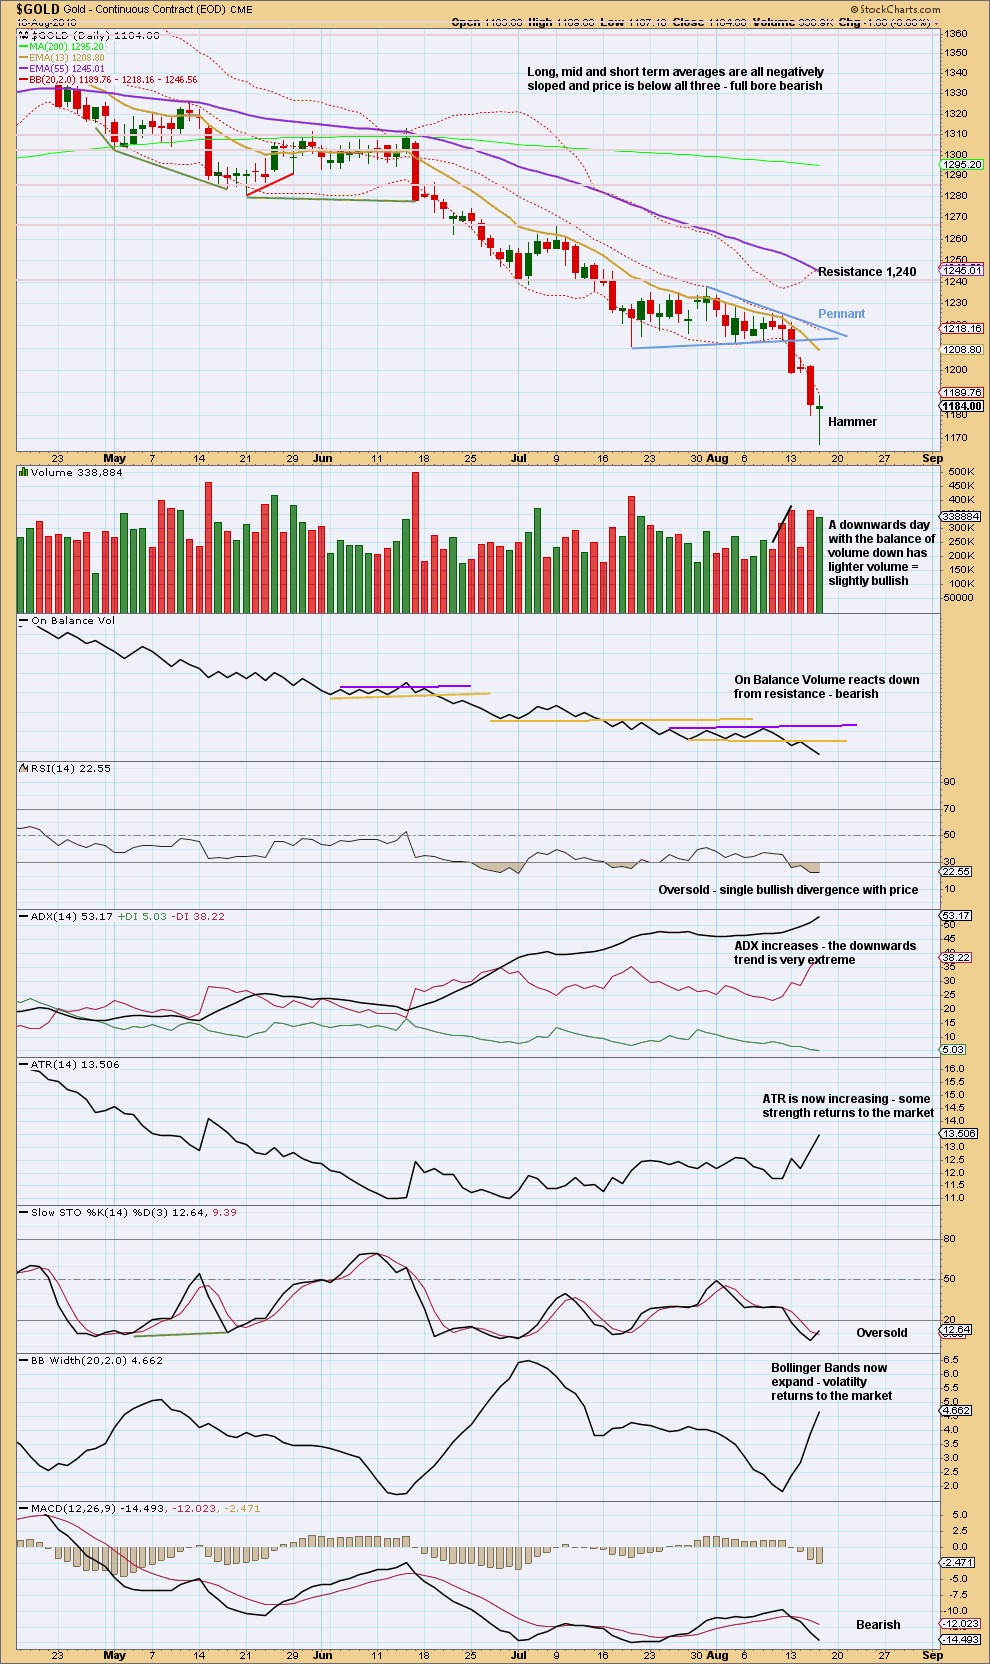
Click chart to enlarge. Chart courtesy of StockCharts.com.
A downwards breakout below the Pennant pattern has support from volume. The target using the length of the flagpole which precedes the Pennant is 1,157. This is now the same as the Elliott wave target on the main hourly Elliott wave count.
Support below is now about 1,125.
Gold can sustain an extreme trend for a reasonable period of time. Look now for a clear bullish candlestick reversal pattern to indicate it could be over. We have today a clear Hammer candlestick reversal pattern. After a good downwards trend, this is an indication a low may be in place. If it is followed by an upwards day tomorrow, which closes well into the real body of the candlestick of the 15th of August, then that would complete a Morning Doji Star reversal pattern.
The Hammer reversal pattern today is a strong warning that the downwards trend may be over and a sideways consolidation or new upwards trend may develop from here.
GDX WEEKLY CHART
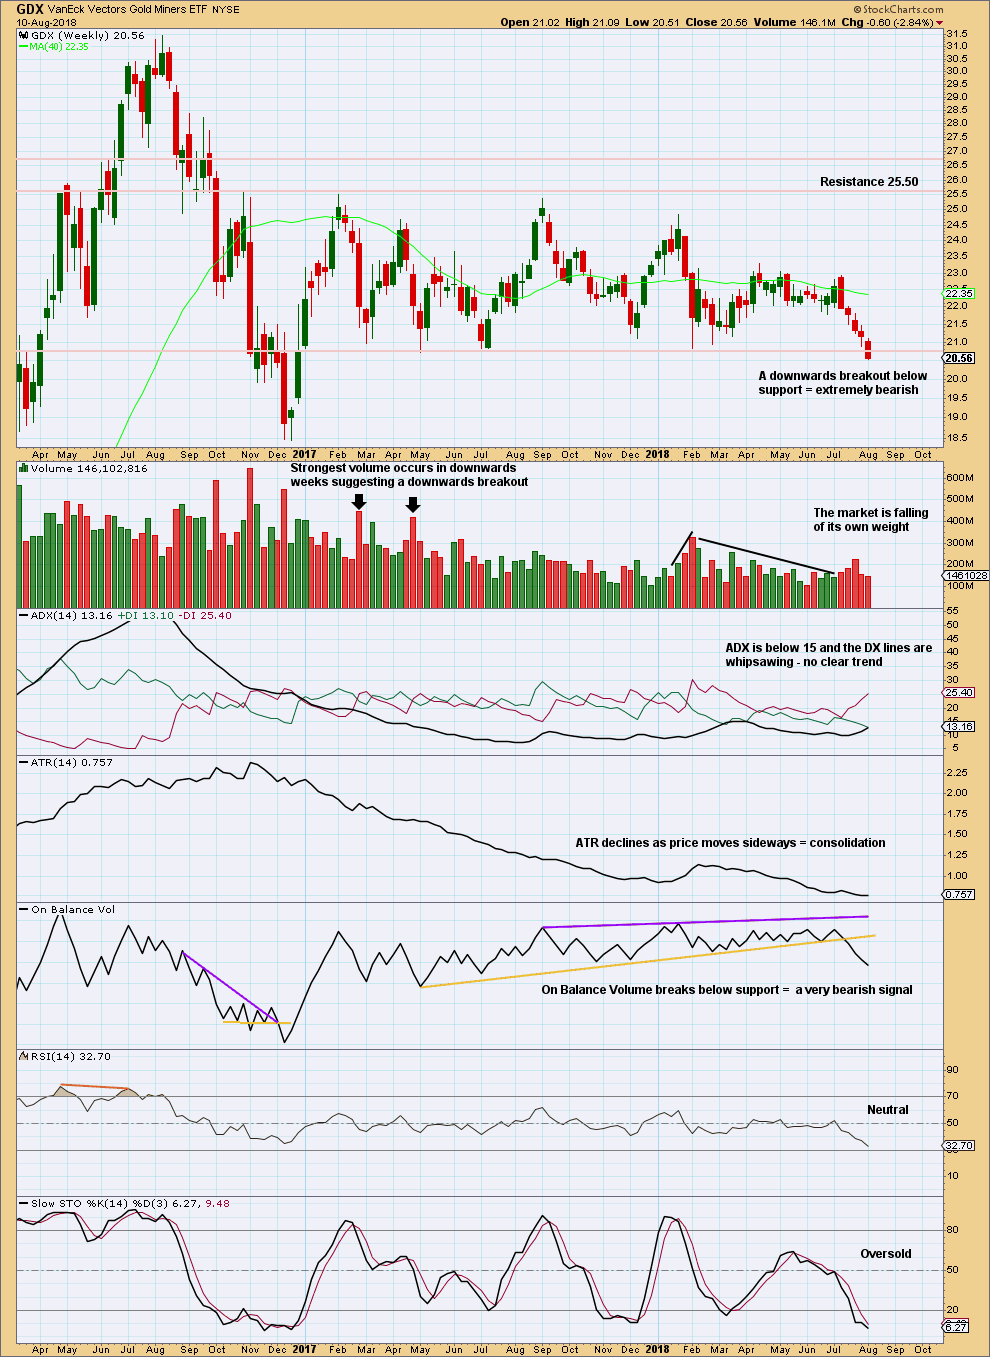
Click chart to enlarge. Chart courtesy of StockCharts.com.
GDX has been range bounce since January 2017. This is a very long sideways consolidation. The longer it continues, the more sustained the eventual breakout will be. Volume suggests the breakout may more likely be downwards.
Price last week closed below support, which was about 20.80. The close this week is the lowest price point for about a year and a half, which is extremely significant. A very long term downwards trend now looks very likely for GDX.
The long term target for the trend is at 16.02.
Next support is about 18.40.
GDX DAILY CHART
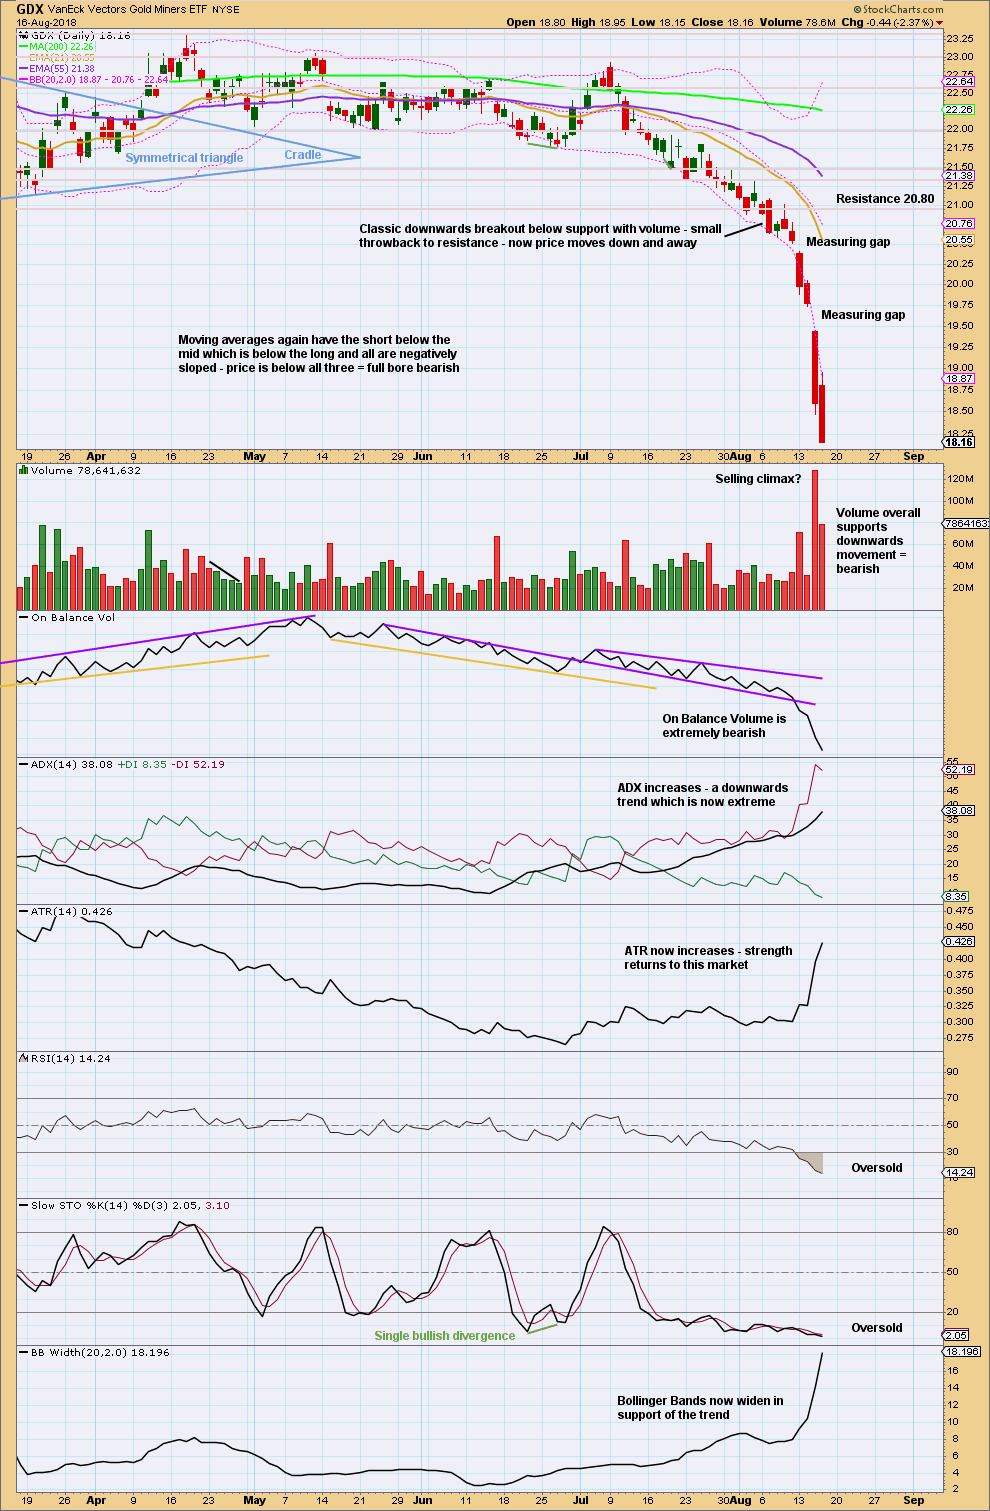
Click chart to enlarge. Chart courtesy of StockCharts.com.
GDX has now closed below support on a strong downwards day with support from volume. New lows are the lowest for GDX since December 2016. This is extremely significant for GDX.
GDX is in a downwards trend. The short term picture now looks bearish.
Short term targets are being reached and exceeded. Use the long term target at this time, until we see a bullish candlestick reversal pattern.
Please remember to protect your trading accounts by careful risk management. Follow my two Golden Rules:
1. Always trade with stops.
2. Risk only 1-5% of equity on any one trade.
A possible target for this downwards trend to end may be now calculated using the measured rule, giving a target about 16.10.
Published @ 08:25 p.m. EST.

hello Lara…
about the last counts you gave us on GDX ( on october 19th 2017) Would you say
That only the first count is now valid? Would you say, that wE are now near the middle of the green( c) wave down……. or how long down do we still have to go……
do you see any other possible bullish count on GDX ?
Thanks….
It looks like Gold is forming a raising star bottoming pattern in the daily chart. Gold correlates with yuan and US dollar. Yuan is raising while $ is in red. China finally fly a team to negotiate trade deal with the US. They secretively crashed the yuan almost 7% in less than 2 months. With all factors consider, it’s a really a good timing to accumulate quality gold miners or gold for the long term! Don’t bet your farm on the 3x thought, it would hurt badly if gold keeps falling. For long term investment, it’s a buy!
main hourly chart updated:
minute iv has well breached the Elliott channel. But sometimes fourth waves do that, which is why Elliott developed a second technique to redraw the channel when it was breached.
Only if iv moves into i will this count be discarded.
That hasn’t happened yet.
Alternate hourly updated:
Not good. No big move up. Looking like a triangle may be forming. If so. One more new low is coming possibly by Tuesday next week. Main hourly correct most likely
It’s starting to move now towards the end of the session.
The length of this candlestick for Friday is going to indicate the likelihood of a low in place. In other words, how high Friday’s candlestick goes in relation to the real body of Wednesday’s candlestick indicates the strength of the Morning Doji Star.
So far it’s weak.
I think we are seeing the early signs that a bottom is in, although more up is required to pass Lara’s confidence levels.
A relatively strong up day for Gold and Miners on Friday would make sense to confirm a bottom. That would give a bullish daily candle and more importantly give us a bullish “tail” on the weekly candle.
Let’s see!
https://www.tradingview.com/x/SunGs0fZ/