
A signal is given today from On Balance Volume that supports the main Elliott wave count for Gold.
A target is given for GDX.
Summary: With support from volume, GDX has effected a downwards breakout from a very long held consolidation (beginning December 2016). The target is at 16.10.
A mid term low for Gold may still be in place. Confidence may be had with a new high above 1,222.35.
A target for a strong bounce here is about 1,304, which may be reached in several weeks. Along the way up, there may be either a sharp pullback or a sideways time consuming consolidation.
Always trade with stops to protect your account. Risk only 1-5% of equity on any one trade.
New updates to this analysis are in bold.
Grand SuperCycle analysis is here.
Last historic analysis with monthly charts and several weekly alternates is here, video is here.
Weekly charts are last updated here. Only one weekly chart will be published on a daily basis. All may be reviewed on a once a week basis.
MAIN ELLIOTT WAVE COUNT
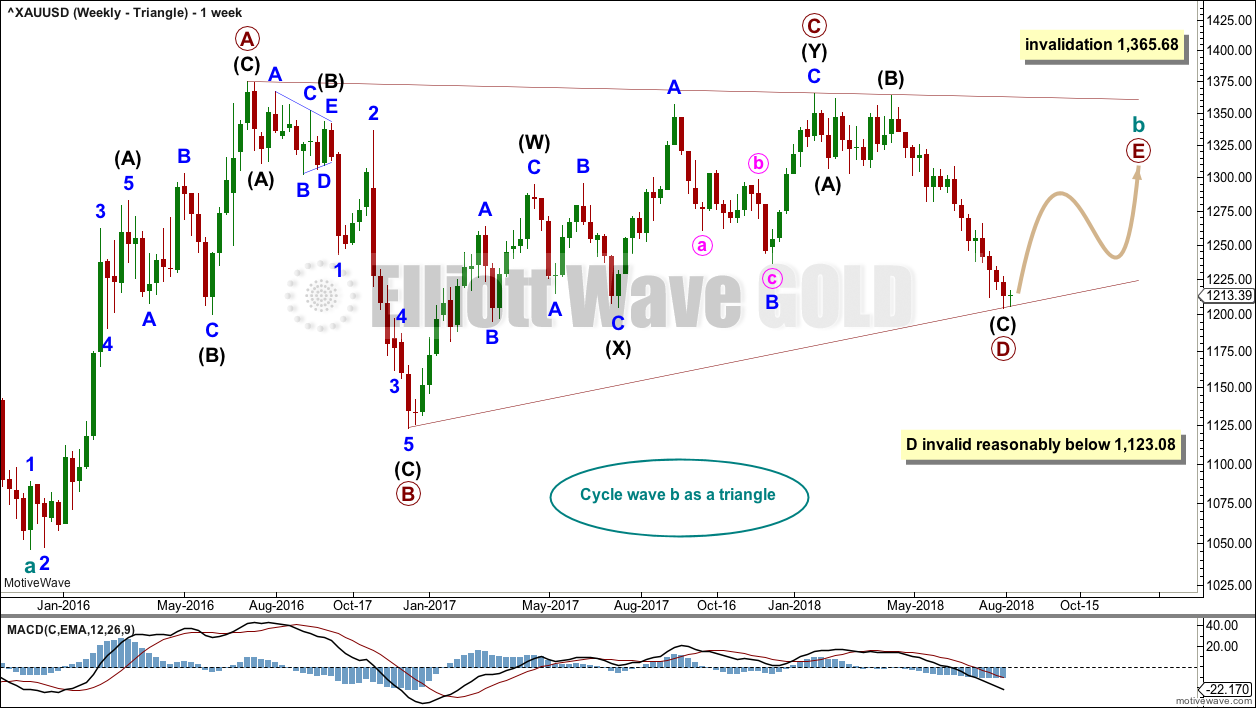
WEEKLY CHART – TRIANGLE
Click chart to enlarge.
There are four remaining weekly wave counts at this time for cycle wave b: a triangle, flat, combination or double zigzag. All four weekly charts were reviewed in last end of week analysis, and may be again reviewed at the end of this week. At this time, all four weekly charts expect some upwards movement here.
While the direction does not diverge for these four weekly wave counts, only one weekly wave count shall be published on a daily basis, so that the analysis is manageable for me to publish and for members to digest. Note: This does not mean that the remaining three counts may not be correct.
The triangle so far has the best fit and look.
Cycle wave b may be an incomplete triangle. The triangle may be a contracting or barrier triangle, with a contracting triangle looking much more likely because the A-C trend line does not have a strong slope. A contracting triangle could see the B-D trend line have a stronger slope, so that the triangle trend lines converge at a reasonable rate. A barrier triangle would have a B-D trend line that would be essentially flat, and the triangle trend lines would barely converge.
Within a contracting triangle, primary wave D may not move beyond the end of primary wave B below 1,123.08. Within a barrier triangle, primary wave D may end about the same level as primary wave B at 1,123.08, so that the B-D trend line is essentially flat. Only a new low reasonably below 1,123.08 would invalidate the triangle.
Within both a contracting and barrier triangle, primary wave E may not move beyond the end of primary wave C above 1,365.68.
Four of the five sub-waves of a triangle must be zigzags, with only one sub-wave allowed to be a multiple zigzag. Primary wave C is the most common sub-wave to subdivide as a multiple, and this is how primary wave C for this example fits best.
Primary wave D must be a single structure, most likely a zigzag.
There are no problems in terms of subdivisions or rare structures for this wave count. It has an excellent fit and so far a typical look.
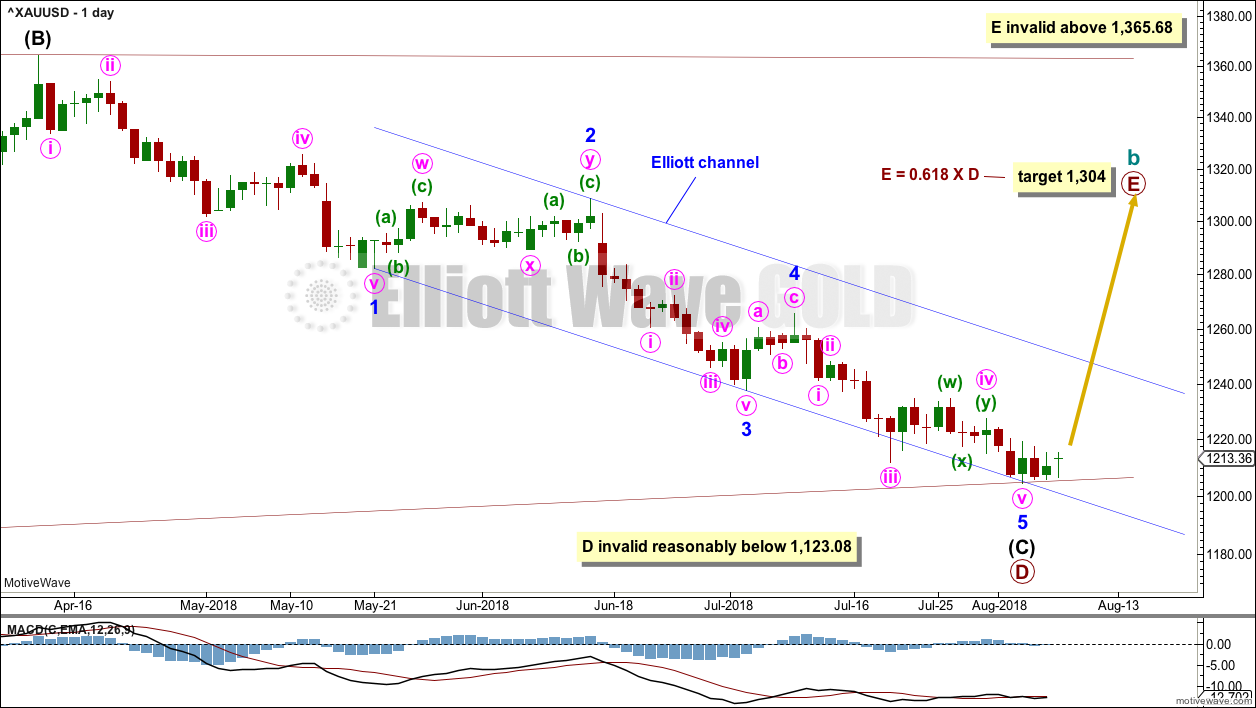
DAILY CHART – TRIANGLE
Click chart to enlarge.
Primary wave D may again be over. The structure may again be complete at all wave degrees.
Minor wave 5 may have ended almost exactly at the lower edge of the blue Elliott channel.
A target is calculated for primary wave E to end. Primary wave E must subdivide as a zigzag. It may last several weeks.
The main hourly chart today expects that primary wave D is over. An alternate hourly chart looks at the possibility it may still continue to one more low.
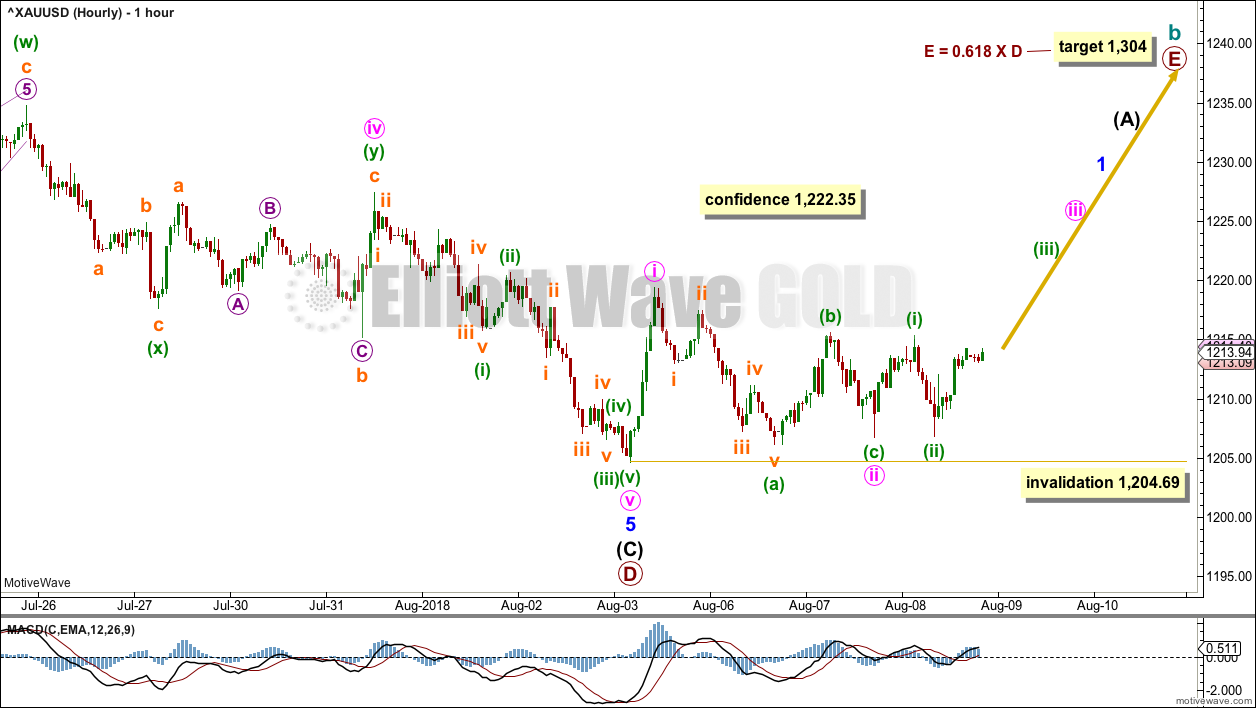
HOURLY CHART
Click chart to enlarge.
Minute wave iv may have been a double combination. Minute wave v is a complete impulse.
The bounce up during Friday’s session is very strong and has good support from volume.
Minute wave ii may now be a complete zigzag. But if it is complete, as labelled, then minuette wave (c) is slightly truncated by 0.61.
There may now be two complete overlapping first and second waves. This main hourly wave count now expects to see an imminent increase in upwards momentum as the middle of a third wave unfolds.
Minute wave ii may not move beyond the start of minute wave i below 1,204.69.
A new high now above 1,222.35 would invalidate the new hourly alternate wave count below and provide some confidence that a low should be in place.
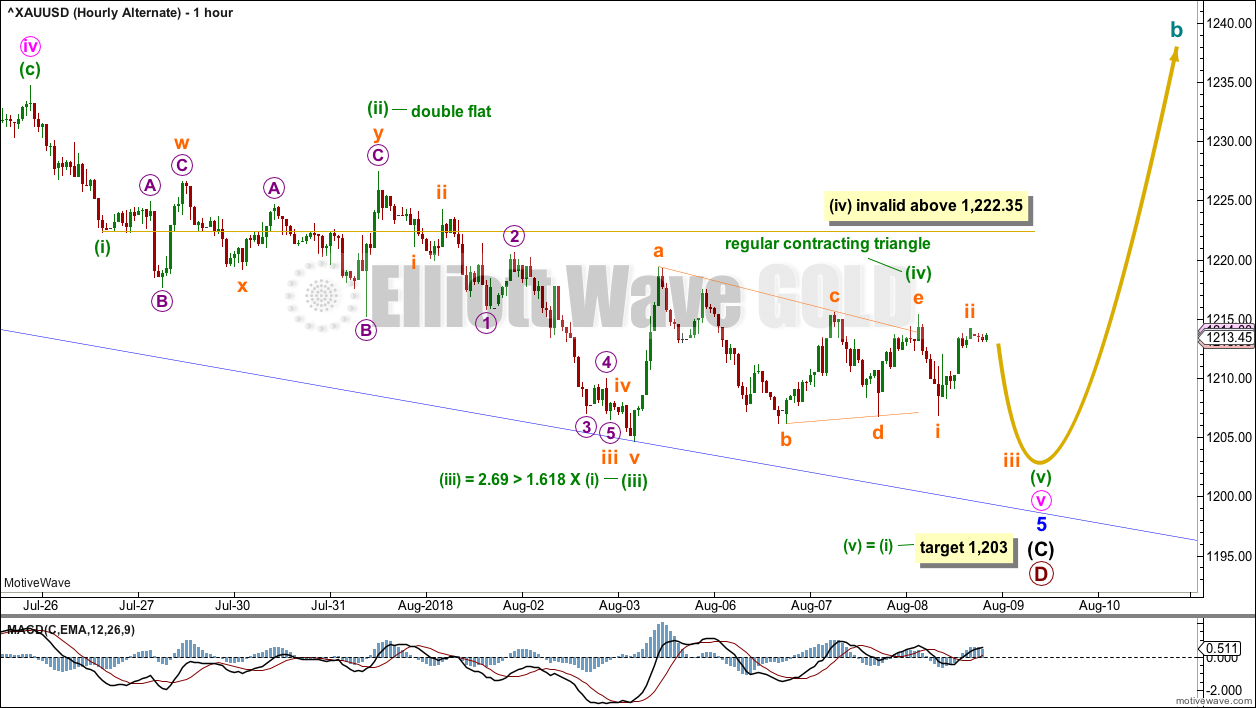
ALTERNATE HOURLY CHART
Click chart to enlarge.
The alternate wave count published yesterday no longer has the right look. That alternate saw an ending expanding diagonal continuing lower for minute wave v, but now the diagonal trend lines are breached by upwards movement. Diagonals normally adhere very well to their trend lines and the breach means the idea should be discarded.
This alternate wave count is new. Thank you to member Dreamer for publishing the idea in comments.
Minute wave iv may have been over earlier as a single zigzag. Minute wave v may have begun at that point.
Minute wave v may be unfolding as an impulse.
Within the impulse, minuette wave (ii) is seen as a rare double flat correction. In my research on Elliott wave corrective structures to date I have not found any examples of double flats at the daily chart level (or higher) for Gold or the S&P500.
Within the first flat correction labelled subminuette wave w, micro wave B is 2.82 times the length of micro wave A. While there is no Elliott wave rule stating any limit for B waves within flats, it is very rare for them to be any longer than 2 times the length of their A waves. This further must reduce the probability of this wave count.
There is excellent alternation in structure between minuette waves (ii) and (iv).
If minuette wave (iv) continues further, then it may not move into minuette wave (i) price territory above 1,222.35.
TECHNICAL ANALYSIS
WEEKLY CHART
Click chart to enlarge. Chart courtesy of StockCharts.com.
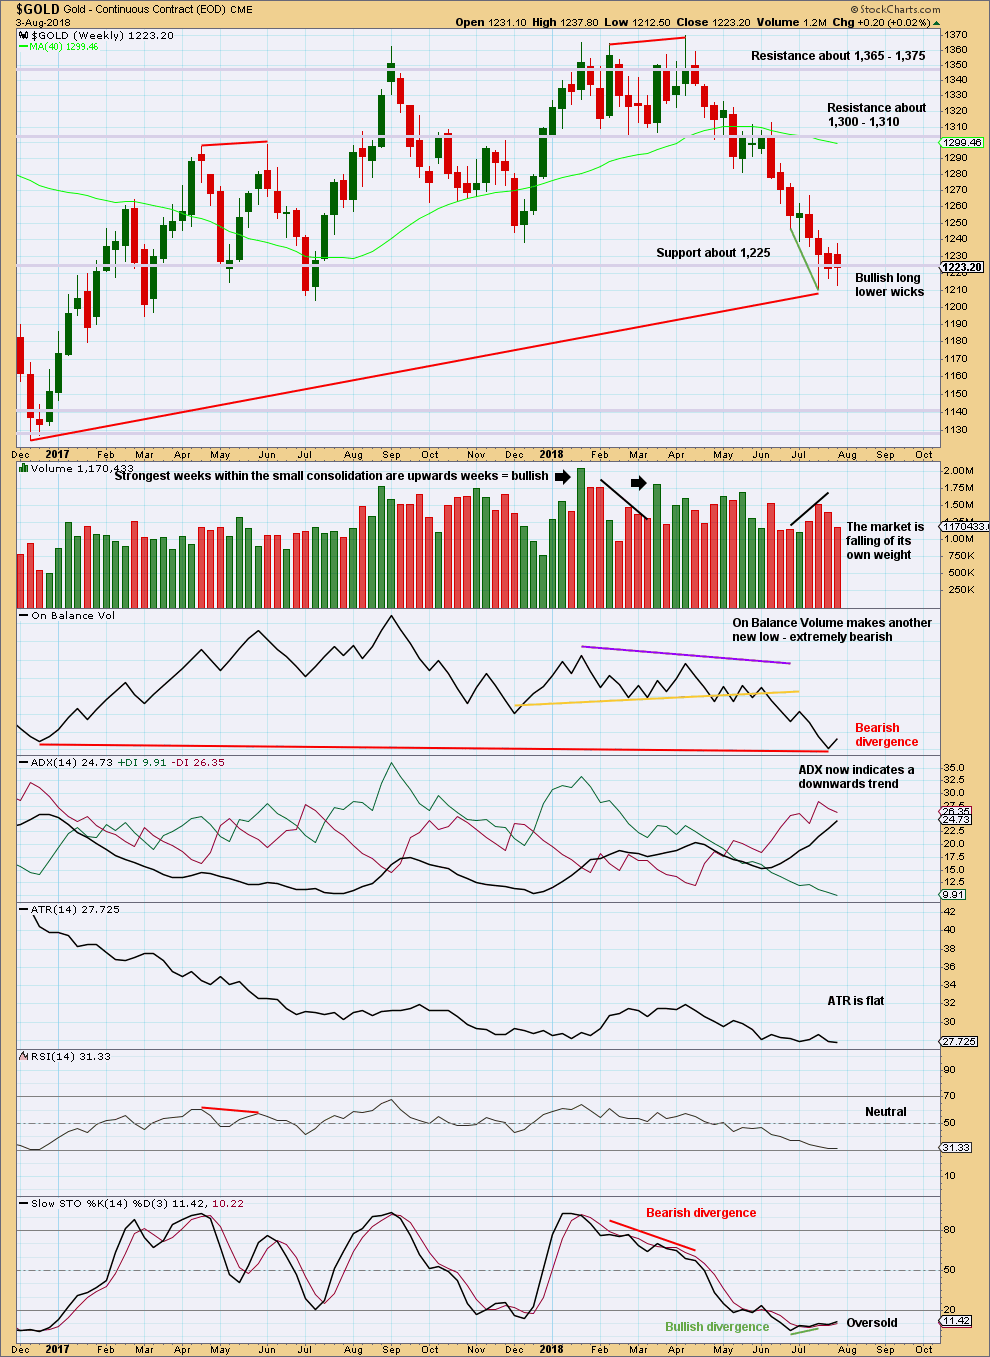
At the end of last week, BarChart data has made a new low but StockCharts data has not.
The long term picture for this chart is bearish due to the long term bearish divergence between price and On Balance Volume. The short term is bullish due to long lower candlestick wicks and single short term divergence between price and Stochastics at last lows.
DAILY CHART
Click chart to enlarge. Chart courtesy of StockCharts.com.
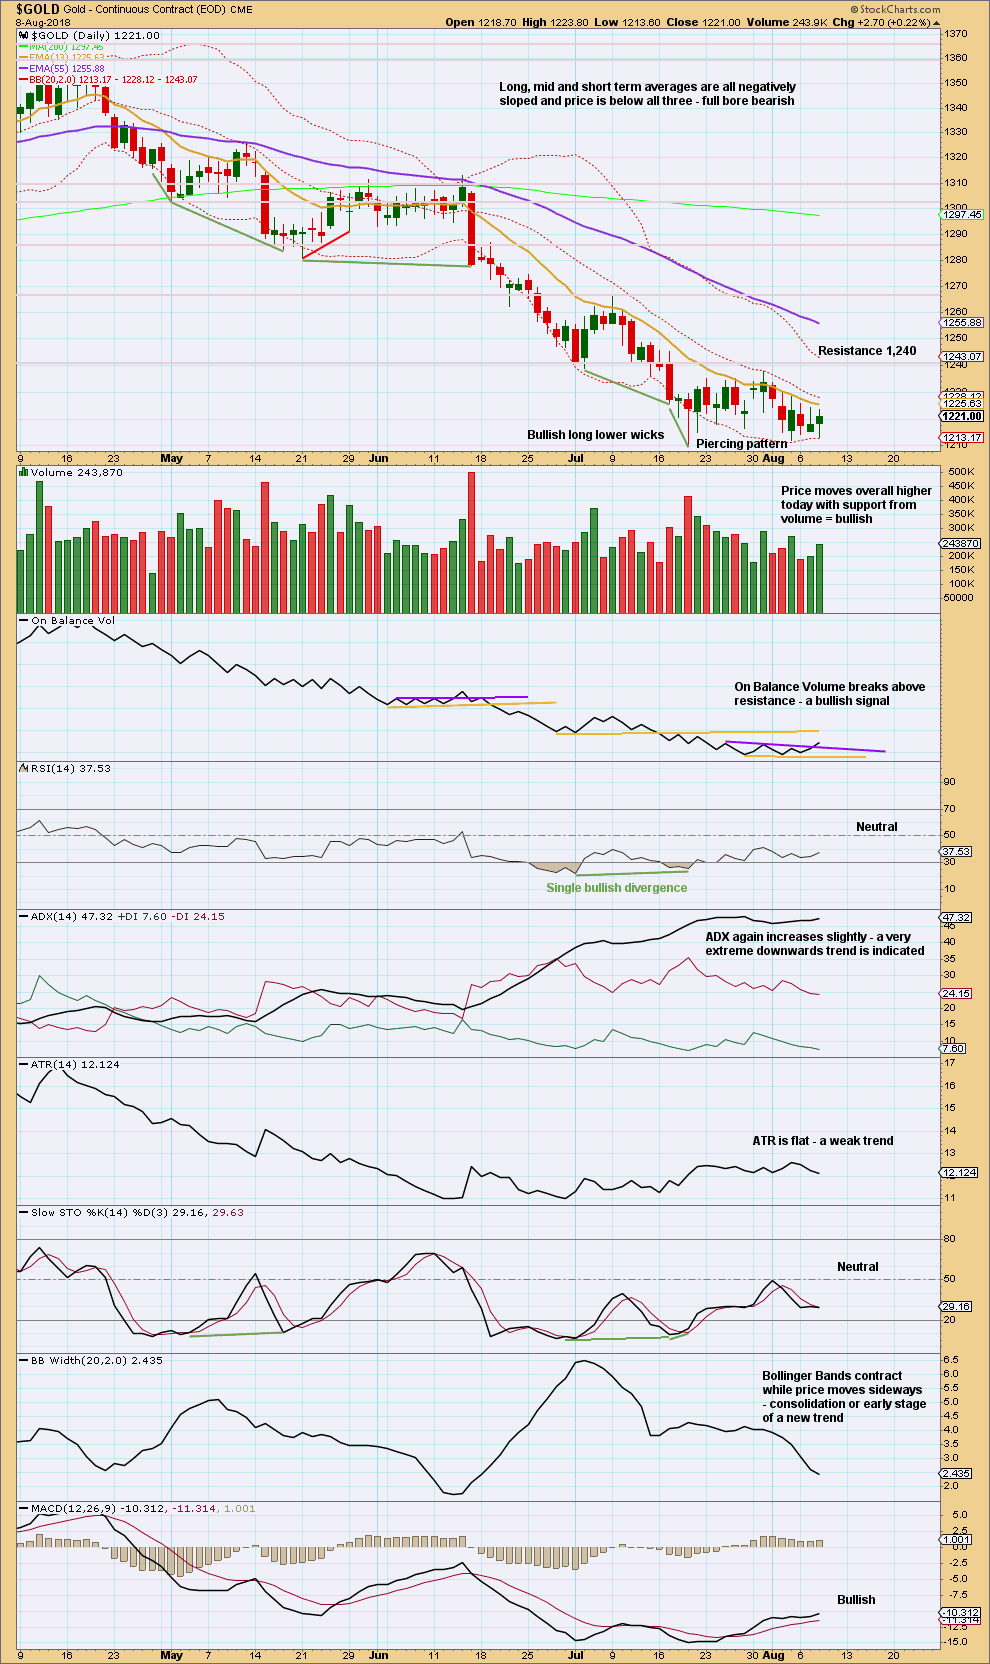
It sill looks like a low may be in: the short term volume profile is bullish; there is a bullish candlestick reversal pattern at the last low; and, there was bullish divergence between price and Stochastics and RSI.
The downwards trend is extreme and stretched. It is time to look for a low. That does not mean price may move a little lower before it turns, only that a low should be anticipated here.
A bullish signal today from On Balance Volume supports the main hourly Elliott wave count.
GDX WEEKLY CHART
Click chart to enlarge. Chart courtesy of StockCharts.com.
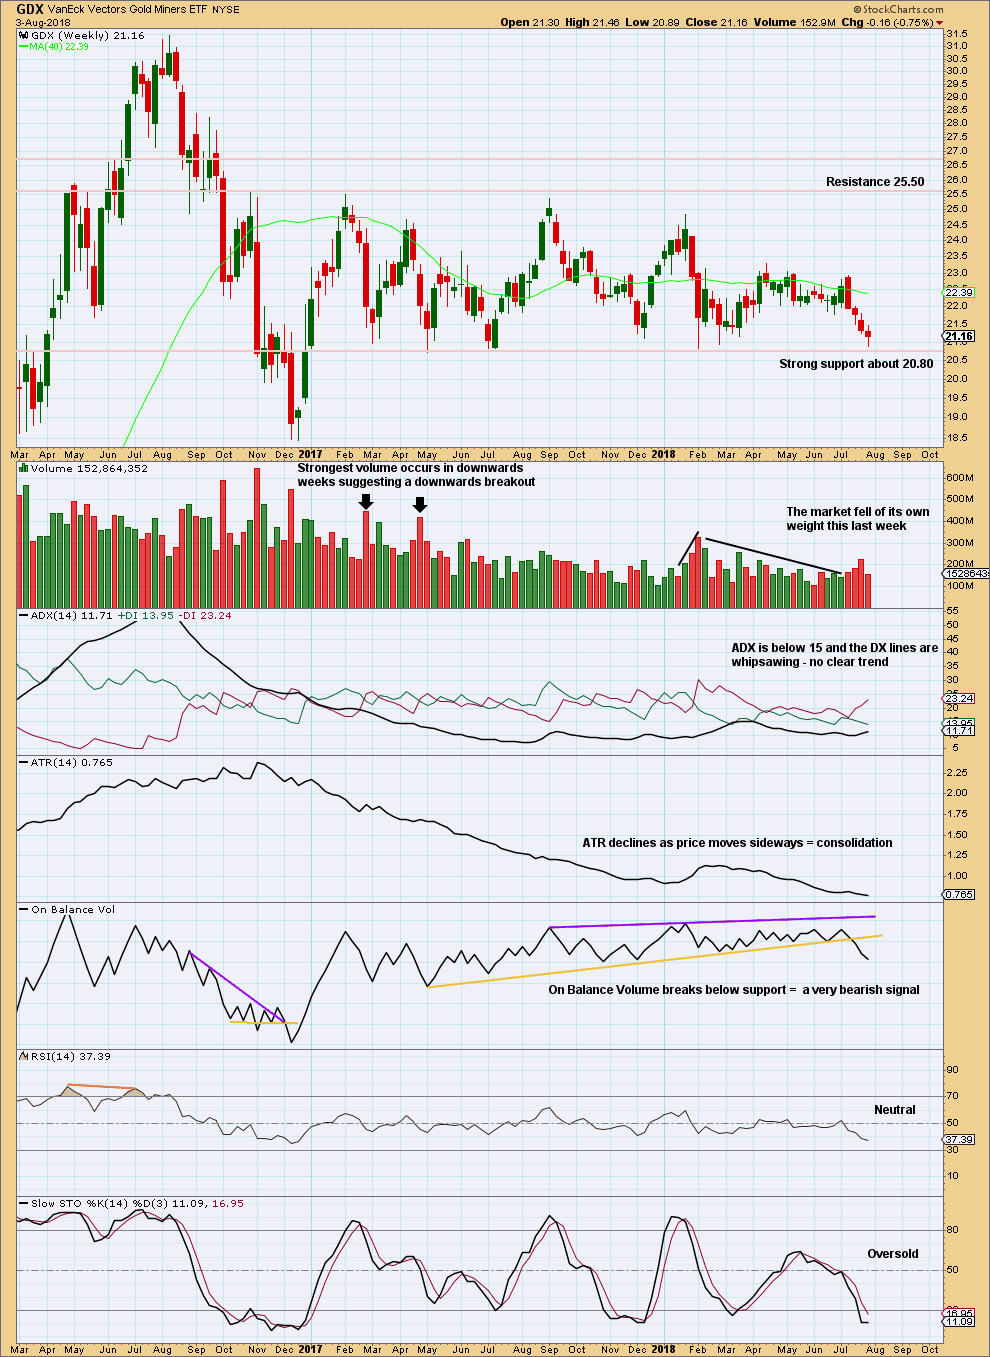
GDX has been range bounce since January 2017. This is a very long sideways consolidation. The longer it continues, the more sustained the eventual breakout will be. Volume suggests the breakout may more likely be downwards.
Support about 20.80 has been tested about eight times and so far has held. The more often a support area is tested and holds, the more technical significance it has.
Price is now almost at support about 20.80. Stochastics is now oversold. Normally, it would be reasonable to expect that downwards movement may end here and an upwards swing may develop. But the very bearish signal from On Balance Volume suggests a downwards breakout may be about to happen.
A downwards breakout would require a close below support. If it has support from volume, it would be very bearish; but that is not necessary for a downwards breakout, because the market may fall of its own weight.
GDX DAILY CHART
Click chart to enlarge. Chart courtesy of StockCharts.com.
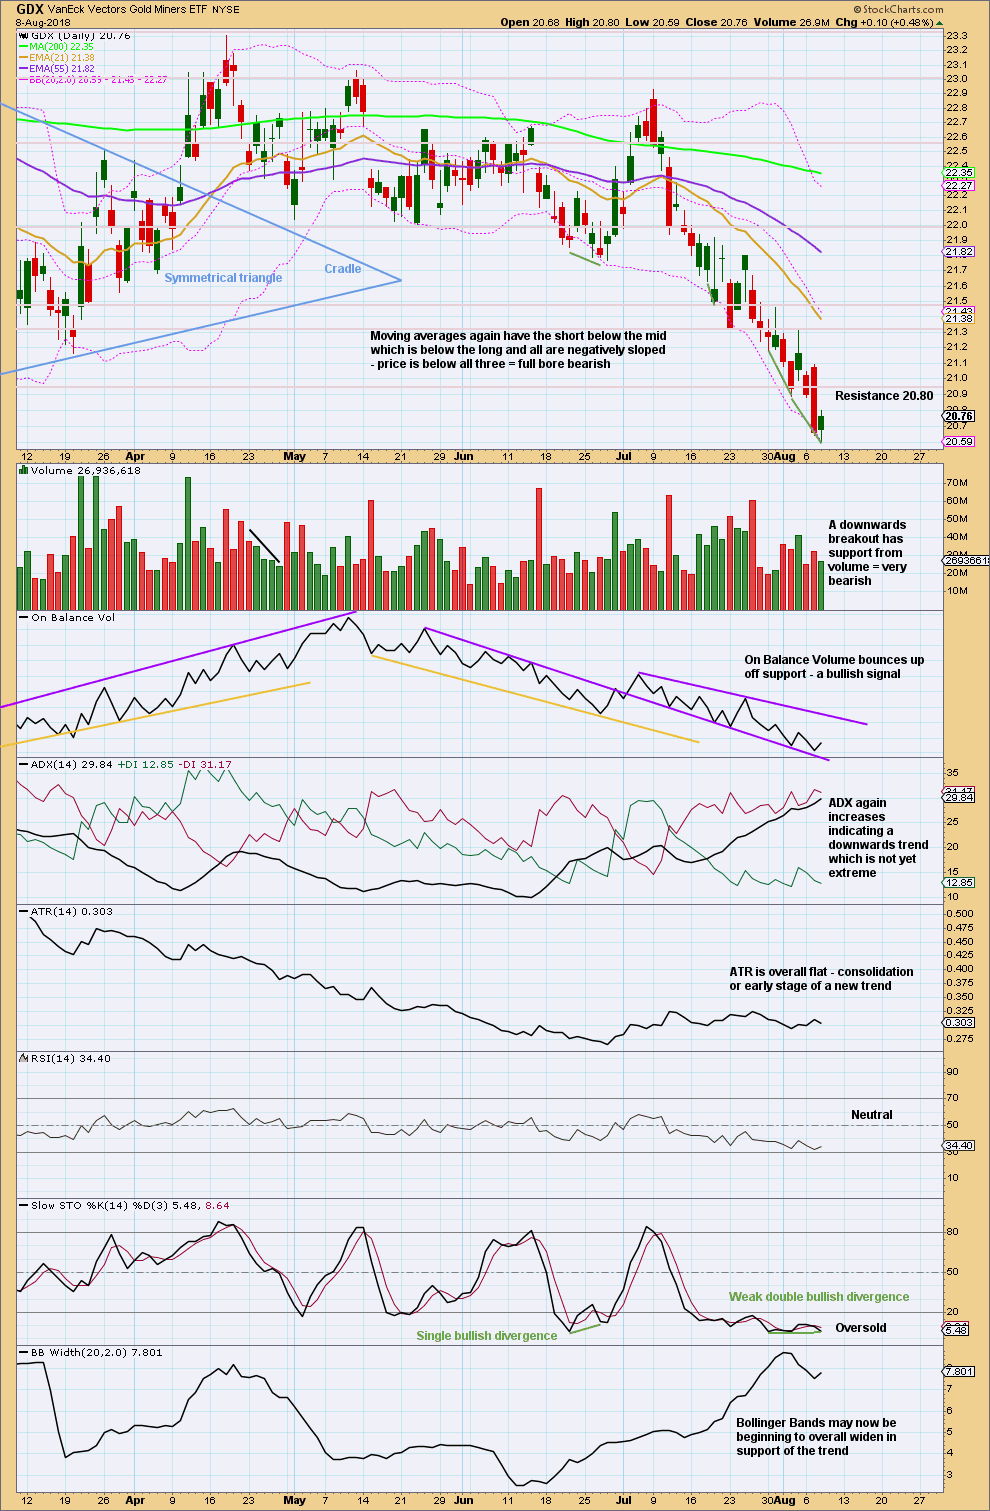
GDX has now closed below support on a strong downwards day with support from volume. The low yesterday is the lowest low for GDX since December 2016, so this downwards day is extremely significant for GDX.
Look now for a possible throwback to resistance about 20.80. A small bounce at the end of today’s session may be the beginning of a throwback.
GDX is in a downwards trend. This trend is not yet extreme. It will not move in a straight line. Bounces may be opportunities to join the trend.
Please remember to protect your trading accounts by careful risk management. Follow my two Golden Rules:
1. Always trade with stops.
2. Risk only 1-5% of equity on any one trade.
A possible target for this downwards trend to end may be now calculated using the measured rule, giving a target about 16.10.
While GDX and Gold are often positively correlated, this correlation is unreliable. Gold may still have a multi week shallow bounce and GDX may still move overall lower with smaller bounces along the way. The two wave counts, and indeed technical analysis for these two markets, cannot be reliably linked while the correlation is unreliable.
Published @ 09:00 p.m. EST.
Lara, what if the triangle is continuing? My data looks to have different highs and lows than BarChart, but maybe it still works?
https://www.tradingview.com/x/8xWZuQBT/
Hi Dreamer. Looks like USD made that final high you were talking about before. Things have finally set up right for gold to move higher I think…
Yes, the 7/19 high was 95.65. A strong move up today so far shows a high of 95.62. I think it tops today or tomorrow.
hourly chart updated:
the main count still works
may be winding up for a strong upwards thrust in the next one to very few days
the alternate really doesn’t work at the hourly chart level anymore
a new high above 1,215.39 can’t be a continuation of wave E of the triangle as I have it labelled in the main body of this analysis above. so the triangle for subminuette iv is invalidated
the triangle could have been wave B within a zigzag. but when I chart it, the trend lines barely converge. this meets all EW rules, but it looks all kinds of wrong.
and now submineutte c is hugely truncated, so that’s got an extremely low probability
I’m not going to use this idea in today’s analysis, the probability is too low and I would be embarrassed to publish such a thing. I’m only putting it up here in comments to show you the problems that the alternate now has in EW terms.
Grand Super cycle wave count is different from Lara’s count. ??????
——————————————————————————————————–
A short term, medium term and long term Elliott wave analysis.
“Currently, we are witnessing a corrective rebound from the late 2015 lows. Wave action is choppy and overlapping since then. The pale pink trend channel surrounds this correction. It looks like a double three correction that interrupts the corrective bounce to the upside. Double three corrections tend to be complex and sideways. A triangle could be tracing out that eventually resolves to the upside.”
https://www.scienceinvesting.com/technical_analysis/bonds/gold/
I like Lara’s better. This one seems to ignore a large 2nd wave from the 1,930’s to the 1,970’s.
I took a look at those charts.
My first thing I noticed, is there is only one wave count for the current B wave (which i have as cycle wave b). While that may be the right count, it’s a B wave. It’s essential IMO and IME to use alternates for B waves.
The biggest long term analysis seems legit. But as Dreamer says I like mine better bcos it takes into account a big correction from 1936 to 1949.
But here’s the thing about that bigger picture. Because those waves last so very long, there will not be any divergence between that count and mine for years. And by the time they diverge, many members here may not be here anymore, and I may not even be here anymore. It could be over 10 years….
Thanks for evaluating other’s count.
Lara definitely I wil not be here but you have long ehalthy and prosperous life ahead. GBU
Come on Lara. Don’t even think about retiring…. Just think about how bored you would be…chasing waves and Kiwi’s daily, traveling the world, etc. Boring! Now EW, that’s exciting!!! lol!!!
Lara, what about a Triple ZigZag for Primary B of Cycle y?
https://www.tradingview.com/x/W3D9sZne/
My research on Gold found four triple zigzags back to the 1970’s (daily chart level and above only).
None of them were sideways moves, all of them had steep slopes.
While a triple ZZ may well fit there, my data shows the probability is minuscule because it does not look like any triple ZZ prior. And they’re very rare already.
Interesting. This long sideways movement is challenging to analyze. 😳
IKR! It’s a horrid chop.
I’ll have a go at taking a clean chart for GDX this weekend… and lets see what I can come up with. I’ll video it for you all.
Thanks!
Maria, good to see your post. Hard to tell which long time members are still around with so few posts. Anyway, do you have any cycle analysis you can share? Would be great to see.
Most old members remain, the membership here is fairly stable. But the participation in comments is very slow.
Maybe it will pick up when cycle b is finally over and cycle c begins.
Good to know 🙂
Where is Maria’s post? I don’t see it. Thx!
The previous analysis.
Hi Dreamer… I do not have the gold cycle analysis of charles nenner but I watched his last interview in youtube,( by greg hUnter ) and he explains that a major cycle bottom in gold comes this fall…. then comes a new Cycle high from then to 2 years to around 2,500US….. that could be the end of lara’s green (b) wave…. I just thought … that other methods come to the near same targets.
OK, I’ll check it out. Looks like a long 31 minute video posted on July 17. Thanks,