
Last analysis expected a little more upwards movement at the daily chart level to complete primary wave A. This is what has happened.
Summary: A pullback here or a time consuming sideways consolidation may develop for primary wave B. Thereafter, the upwards trend may resume for primary wave C.
New updates to this analysis are in bold.
BEARISH ELLIOTT WAVE ANALYSIS
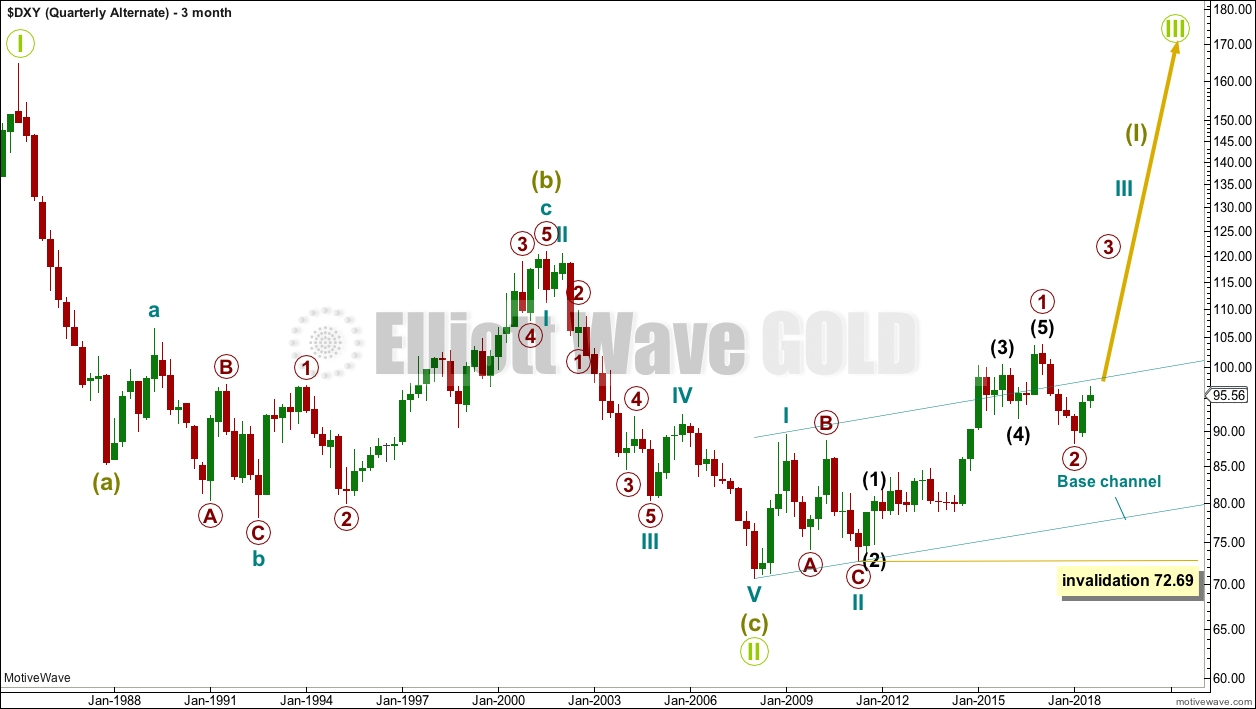
QUARTERLY CHART
Click chart to enlarge.
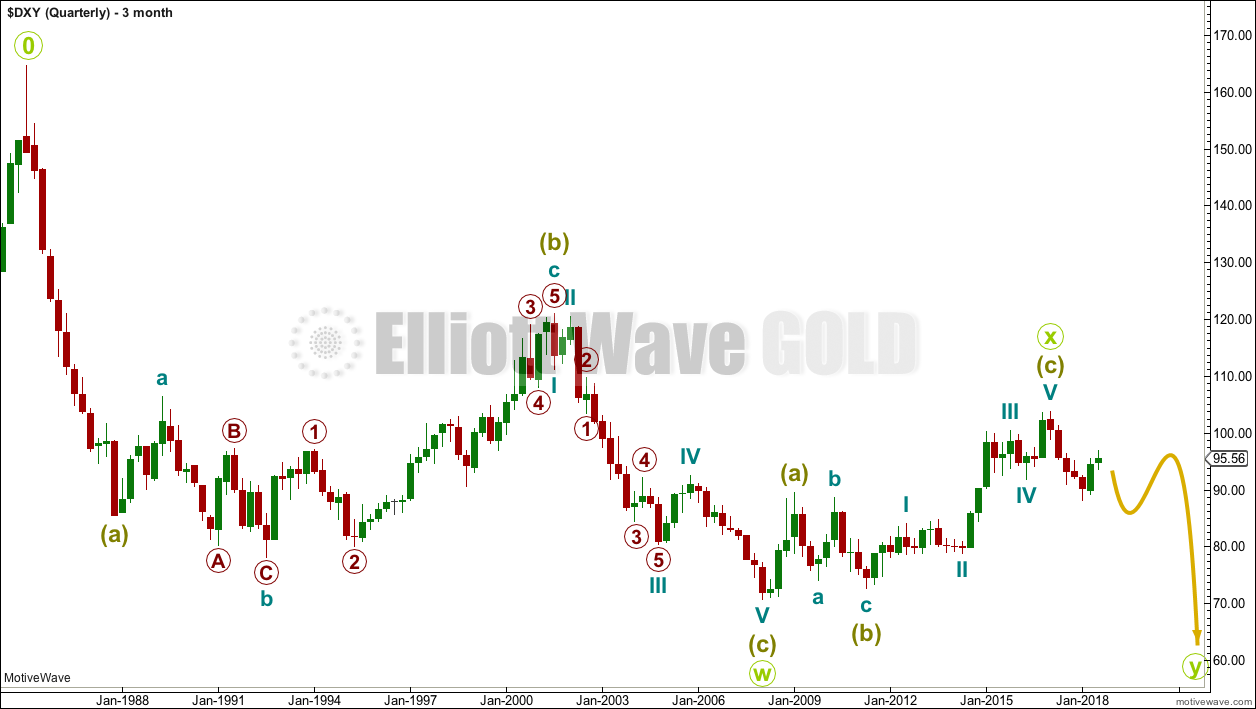
The wave count begins at 0.
A huge double zigzag may be continuing lower.
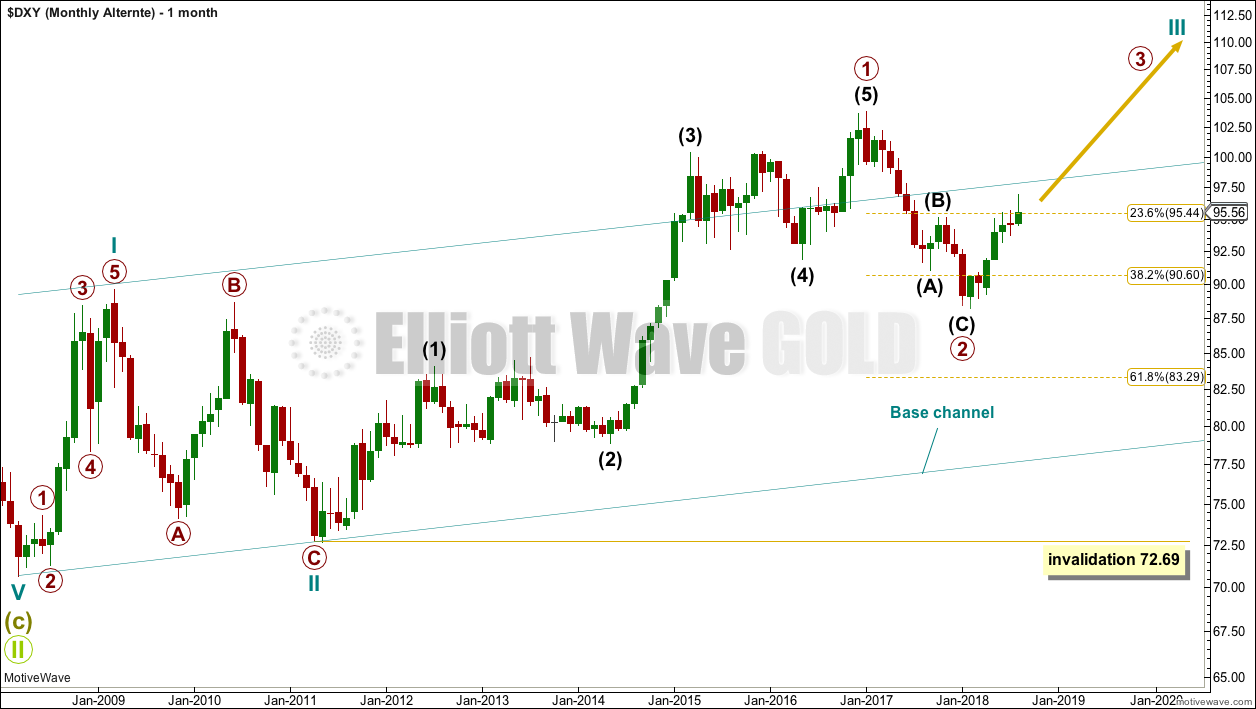
MONTHLY CHART
Click chart to enlarge.
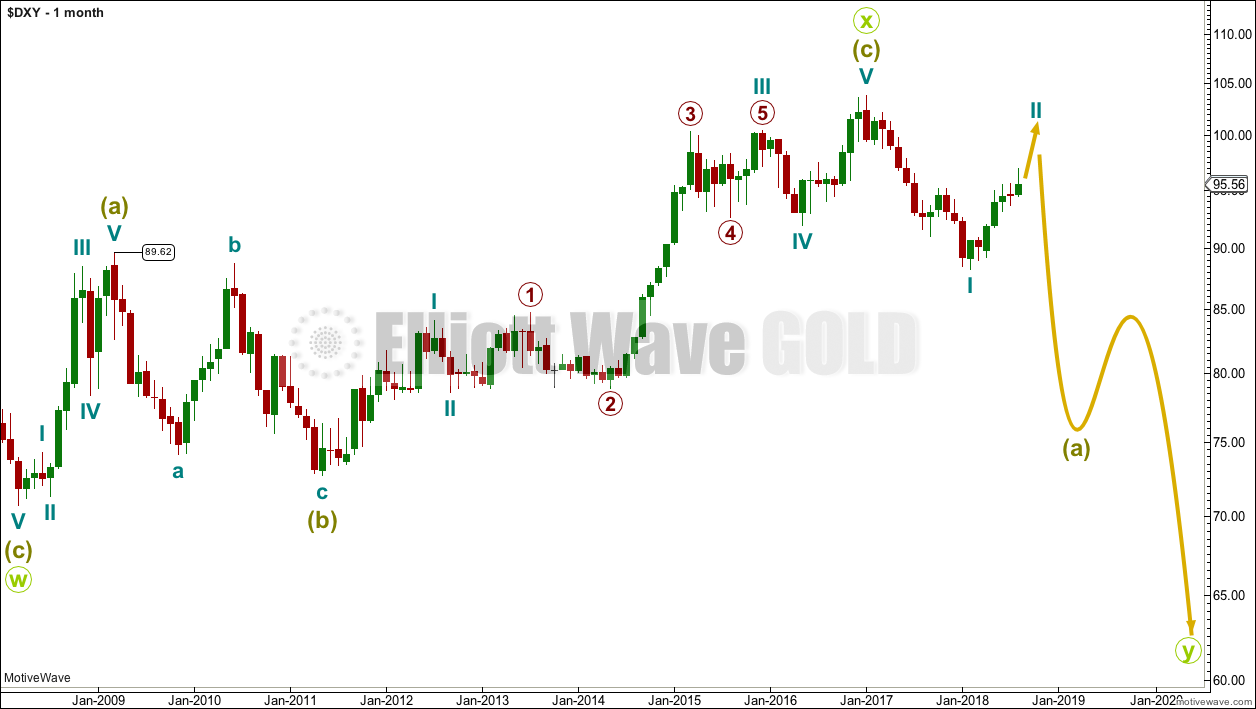
Downwards movement from the high in January 2017 cannot be a fourth wave correction within an ongoing impulse higher because a new low below 89.62 would be back in first wave price territory.
That indicates the last big wave up may be a completed three, and for that reason this is my main wave count.
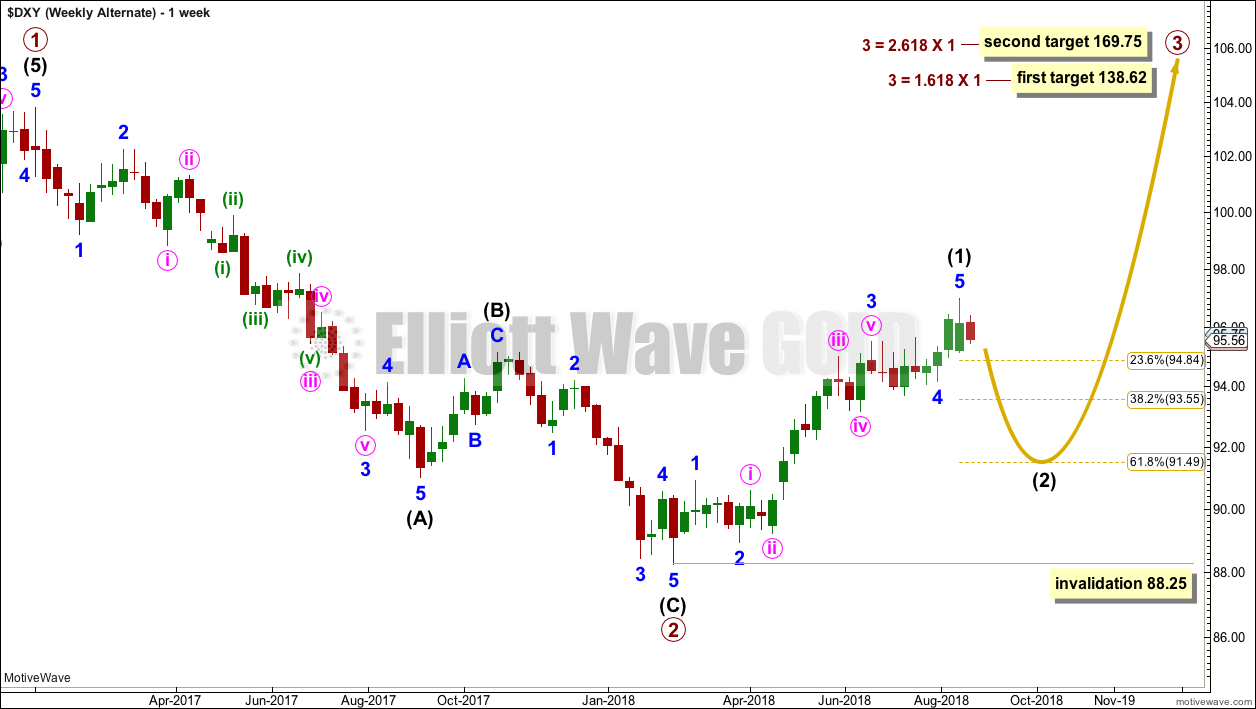
WEEKLY CHART
Click chart to enlarge.
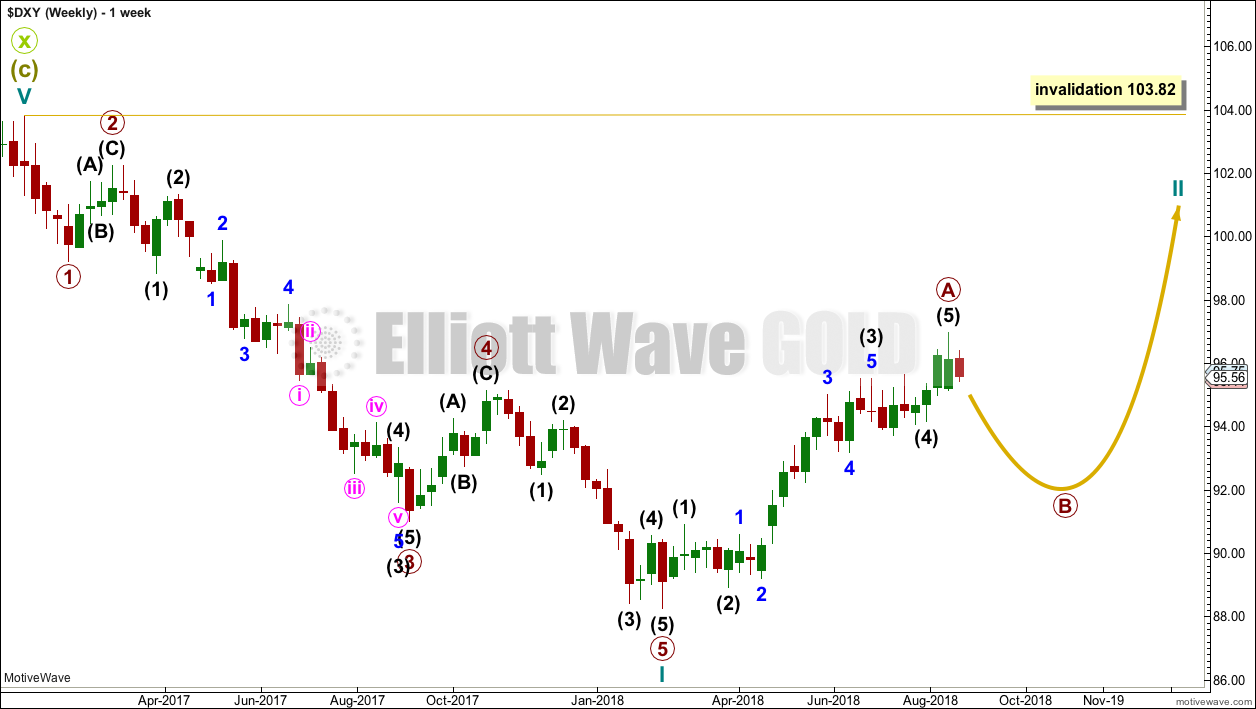
Cycle wave I downwards fits very well as a five wave impulse. This may be reasonably expected to be followed by a three wave structure upwards.
For the USD Index, historically the first second wave correction within a new trend is usually extremely deep, about 0.80 to 0.90 of the first wave it corrects. It would be typical here to see Cycle wave II reach to 0.80 or deeper of cycle wave I.
If cycle wave II is beginning with a five up, then it may be unfolding as a zigzag, which is the most common type of corrective structure.
Primary wave A may now be a completed five wave impulse. Primary wave B may now begin.
Primary wave B may last anywhere from a Fibonacci 13 up to a Fibonacci 55 weeks. It may be either a relatively quick sharp pullback as a zigzag, or a more time consuming large sideways consolidation as a flat, combination or triangle.
When primary wave B is complete, then the upwards trend may resume for primary wave C, which may end reasonably close to 103.82 but not above this point.
Cycle wave II may not move beyond the start of cycle wave I above 103.82.
DAILY CHART
Click chart to enlarge.
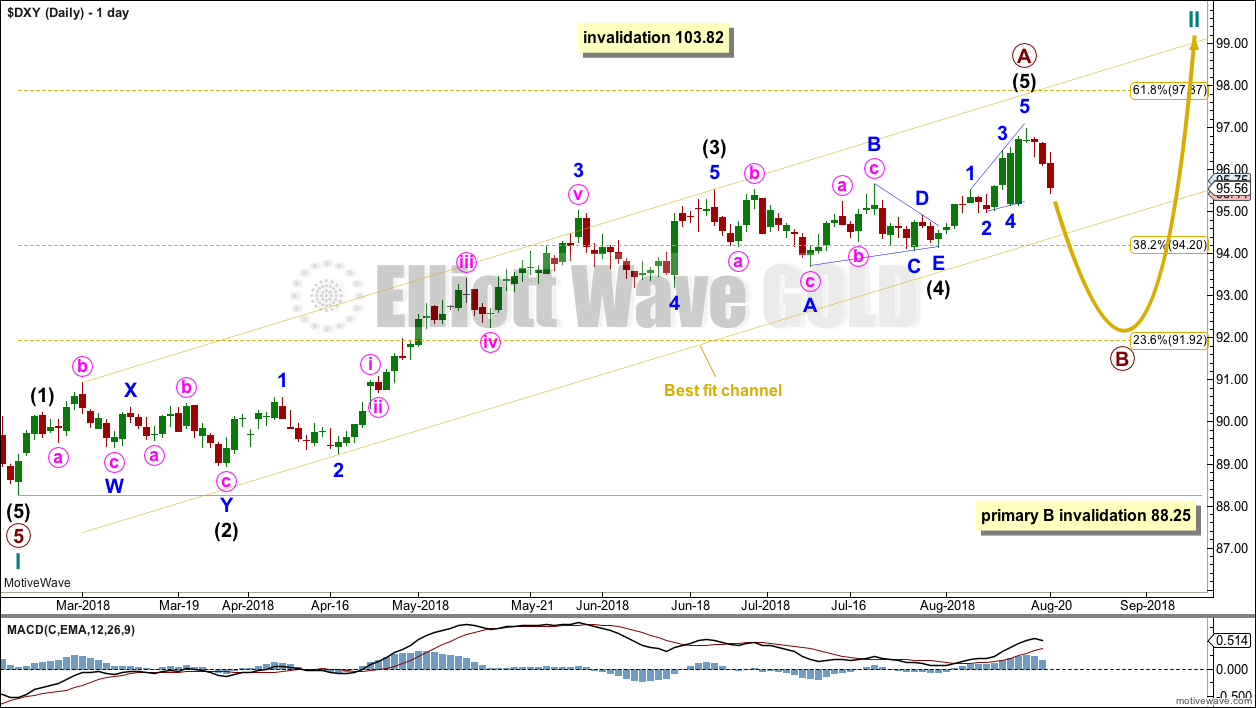
Primary wave A fits very well as a complete five wave impulse.
So far primary wave A remains contained within a channel. When price breaks out of the lower edge of the channel, then that would provide confidence that primary wave A is complete and primary wave B may have begun.
Primary wave B may not move beyond the start of primary wave A below 88.25.
Primary wave B may be any one of more than 23 possible corrective structures. It may be choppy and overlapping as a combination, flat or triangle, or it may be a more brief sharp pullback as a zigzag.
BULLISH ELLIOTT WAVE ANALYSIS
QUARTERLY CHART
Click chart to enlarge.
A single zigzag down to the last major low may still be complete.
A new upwards trend may continue. So far there may be two overlapping first and second waves. Primary wave 2 may not move beyond the start of primary wave 1 below 72.69.
Primary wave 2 should find strong support at the lower edge of the teal base channel if it gets down that low.
MONTHLY CHART
Click chart to enlarge.
Primary wave 2 may be a complete zigzag. However, this wave down can also be seen as a five and primary wave 2 may yet continue lower.
WEEKLY CHART
Click chart to enlarge.
This bullish wave count sees the last wave down as a completed zigzag. If this is correct, then within primary wave 3 no second wave correction may move beyond its start below 88.25.
TECHNICAL ANALYSIS
MONTHLY CHART
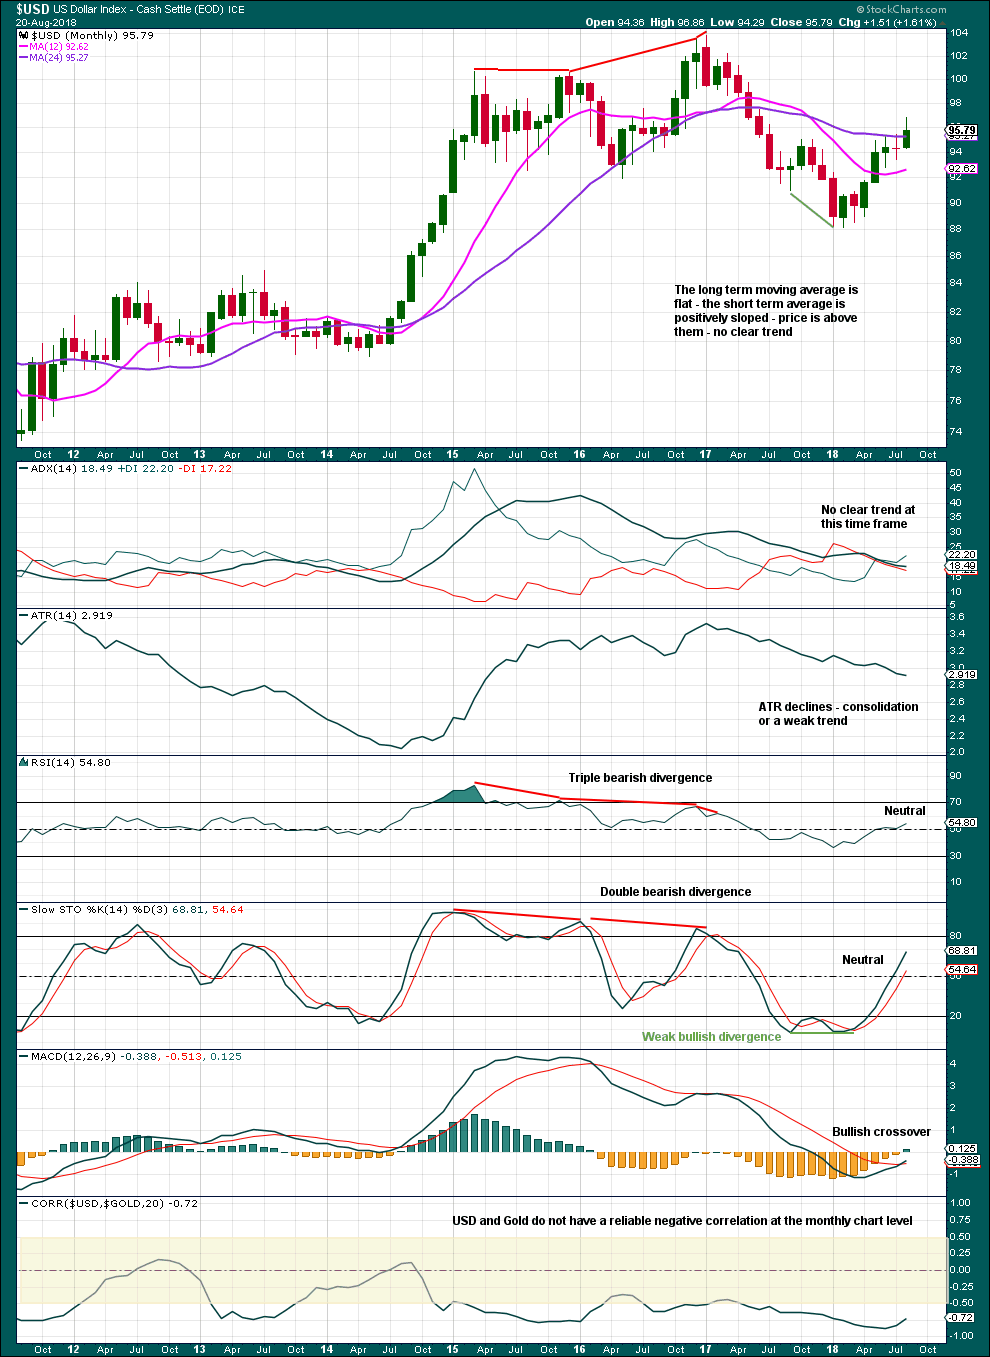
Click chart to enlarge. Chart courtesy of StockCharts.com.
DAILY CHART
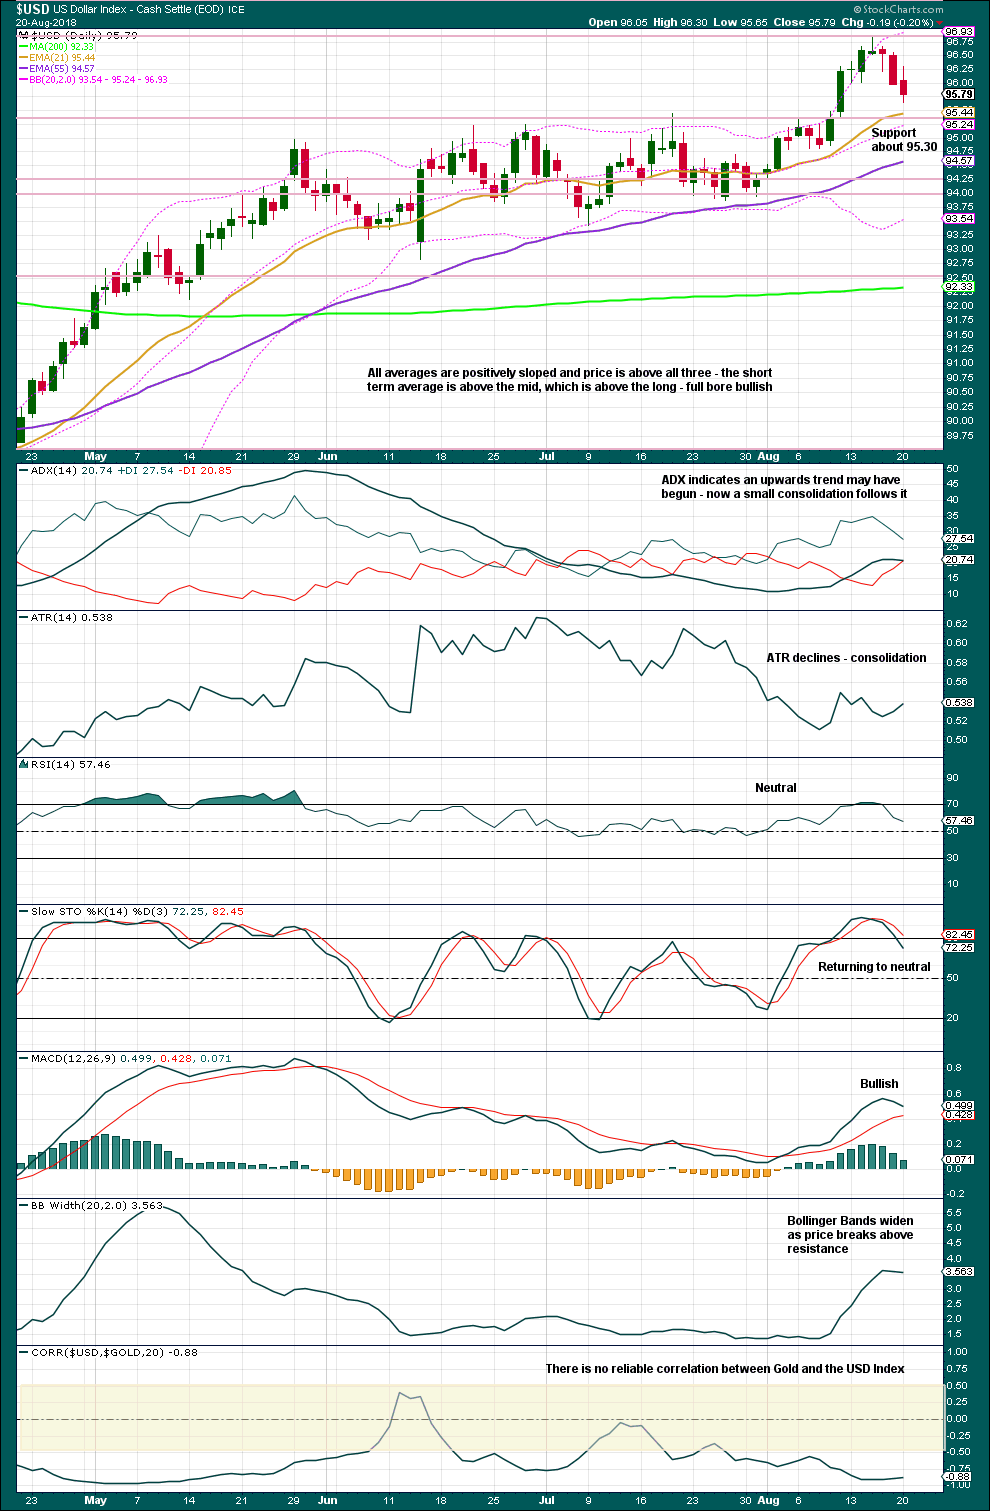
Click chart to enlarge. Chart courtesy of StockCharts.com.
Last analysis noted the consolidation with resistance in a zone about 95 to 95.45. Price broke above resistance, and now downwards movement may be a backtest of support at prior resistance.
If support holds here, then expect price to bounce up and move higher.
Published @ 01:23 a.m. EST.
Thank you Lara for the dollar update.
Gold, USD, Indexes. Where might the profit be ? !
My search for the crystal ball continues 🙂
Right now I’d be looking at the breakdowns in Silver and GDX for good profitable trends.
Thank you Lara. I shall do exactly that.
Got in and got out real quick, for a tiny loss. Looks like silver will be going up now instead of down. Oh, well.
Thanks for the update. Well, we’re not going to know which way Gold breaks for a few months yet. I have a hard time seeing the $ Double from here (Bull count), but we’ll see.
$ Bear count = Gold triangle breaks upward.
$ Bull count = Gold Triangle breaks downward.
Big move after the breakout for Gold.