
Downwards movement was expected as imminent, which is what has happened for Friday.
Summary: A small Elliott wave triangle looks like it may be complete now for Gold. A downwards breakout looks to be underway. Further confidence in this may be had if price closes below support about 1,190. The target is at 1,129.
A new high above 1,212.06 would invalidate the triangle and indicate an upwards breakout. If that happens, then look for a strong sustained bounce to end about 1,305 – 1,310.
A downwards swing for GDX may begin next week within a mid term consolidation. Strong resistance remains about 19.74.
New updates to this analysis are in bold.
Grand SuperCycle analysis is here.
Last historic analysis with monthly charts is here.
All weekly charts are reviewed in this end-of-week analysis.
MAIN ELLIOTT WAVE COUNT
WEEKLY CHART – COMBINATION
Click chart to enlarge.
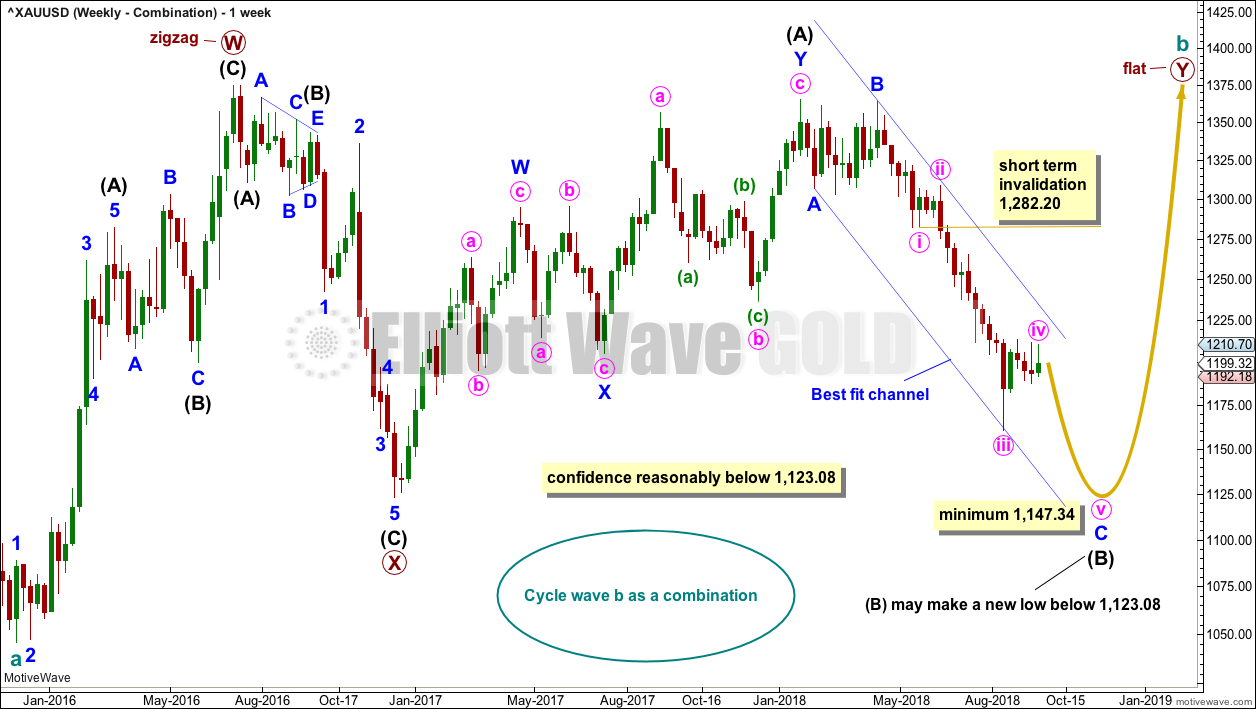
There are four remaining weekly wave counts at this time for cycle wave b: a triangle, flat, combination or double zigzag.
All four weekly wave counts are again considered at the end of this week. Only two shall be followed on a daily basis.
At this stage, this wave count may have a slightly higher probability than the other three weekly wave counts because it has more support from classic technical analysis.
If cycle wave b is a combination, then the first structure in a double may be a complete zigzag labelled primary wave W.
The double may be joined by a three in the opposite direction, a zigzag labelled primary wave X.
The second structure in the double may be a flat correction labelled primary wave Y. My research on Gold so far has found that the most common two structures in a double combination are one zigzag and one flat correction. I have found only one instance where a triangle unfolded for wave Y. The most likely structure for wave Y would be a flat correction by a very wide margin, so that is what this wave count shall expect.
Within a flat correction for primary wave Y, the current downwards wave of intermediate wave (B) may be a single or multiple zigzag; for now it shall be labelled as a single. Intermediate wave (B) must retrace a minimum 0.9 length of intermediate wave (A) at 1,147.34. Intermediate wave (B) may move beyond the start of intermediate wave (A) as in an expanded flat.
Because the minimum requirement for intermediate wave (B) is not yet met, this wave count requires that minute wave v of minor wave C of intermediate wave (B) continues lower. This is the most immediately bearish of all four weekly wave counts.
When intermediate wave (B) is complete, then intermediate wave (C) would be expected to make at least a slight new high above the end of intermediate wave (A) at 1,365.68 to avoid a truncation. Primary wave Y would be most likely to end about the same level as primary wave W at 1,374.91, so that the whole structure takes up time and moves price sideways, as that is the purpose of double combinations.
While double combinations are very common, triples are extremely rare. I have found no examples of triple combinations for Gold at daily chart time frames or higher back to 1976. When the second structure in a double is complete, then it is extremely likely (almost certain) that the whole correction is over.
DAILY CHART – COMBINATION
Click chart to enlarge.
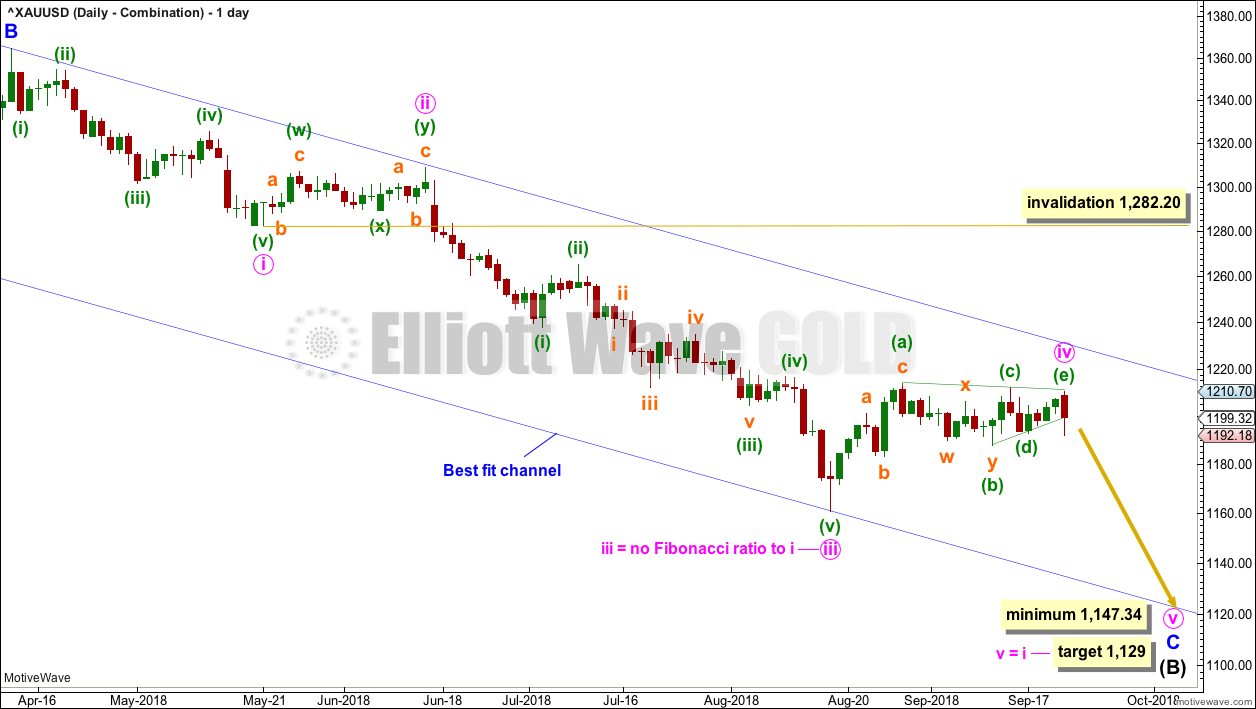
Intermediate wave (B) may be unfolding lower as either a single or double zigzag. At this stage, a single zigzag will be considered; the expected direction nor minimum requirement at 1,147.34 do not differ from a double zigzag.
If intermediate wave (B) is unfolding as a single zigzag, then within it minor wave C must subdivide as a five wave impulse.
It now looks most likely that minute wave iv may be a regular contracting triangle, although this may still morph into a double combination. A complete structure can be seen for minute wave iv, so a downwards breakout to new lows is now expected to be underway. The target calculated expects minute wave v to exhibit the most common Fibonacci ratio to minute wave i.
Gold often exhibits surprisingly swift and short fifth waves out of its fourth wave triangles. If the target is wrong, then it may be too low.
HOURLY CHART
Click chart to enlarge.
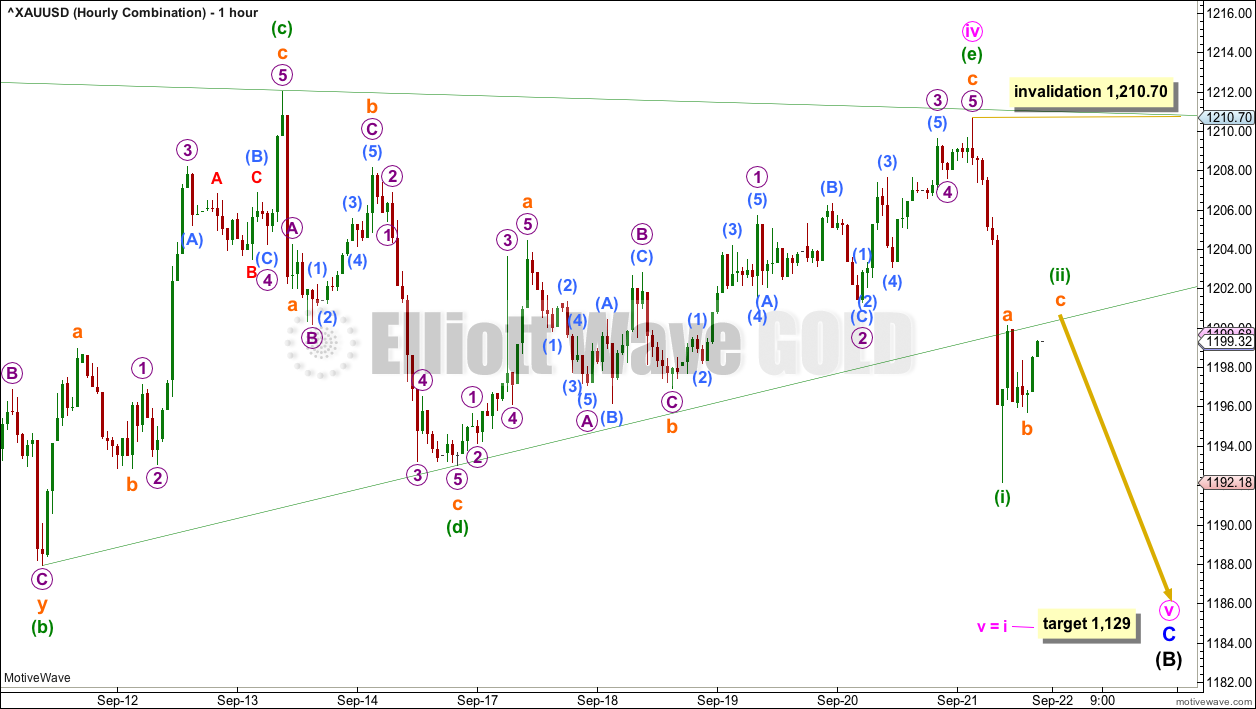
The triangle here labeled minute wave iv may now be complete. Price has broken below the lower edge of the triangle trend lines with strong downwards movement, which has support from volume.
Minuette wave (ii) may now end with a typical back test of resistance at prior support about the lower triangle trend line. Minuette wave (ii) may not move beyond the start of minuette wave (i) above 1,210.70.
WEEKLY CHART – TRIANGLE
Click chart to enlarge.
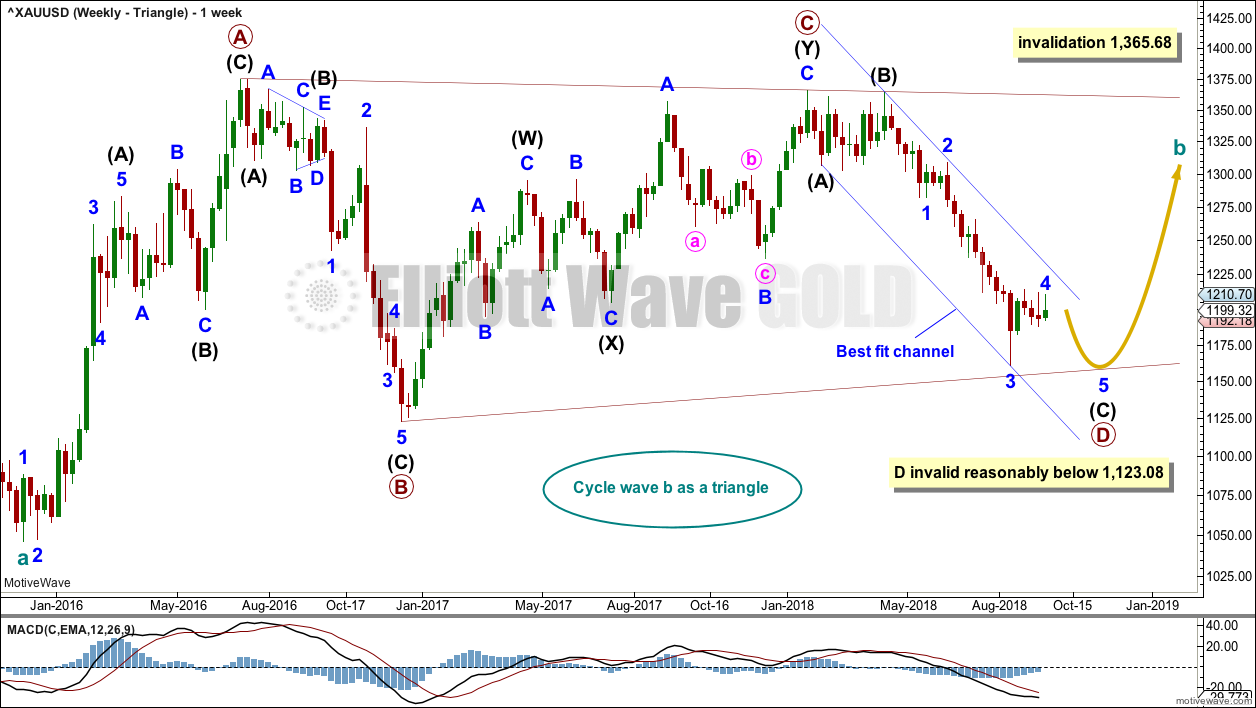
The triangle so far has the best fit and look, but at this stage it no longer has good support from classic technical analysis. It is now judged to have a slightly lower probability than the combination wave count.
Cycle wave b may be an incomplete triangle. The triangle may be a contracting or barrier triangle, with a contracting triangle looking much more likely because the A-C trend line does not have a strong slope. A contracting triangle could see the B-D trend line have a stronger slope, so that the triangle trend lines converge at a reasonable rate. A barrier triangle would have a B-D trend line that would be essentially flat, and the triangle trend lines would barely converge.
Within a contracting triangle, primary wave D may not move beyond the end of primary wave B below 1,123.08. Within a barrier triangle, primary wave D may end about the same level as primary wave B at 1,123.08, so that the B-D trend line is essentially flat. Only a new low reasonably below 1,123.08 would invalidate the triangle.
Within both a contracting and barrier triangle, primary wave E may not move beyond the end of primary wave C above 1,365.68.
Four of the five sub-waves of a triangle must be zigzags, with only one sub-wave allowed to be a multiple zigzag. Primary wave C is the most common sub-wave to subdivide as a multiple, and this is how primary wave C for this example fits best.
Primary wave D must be a single structure, most likely a zigzag.
There are no problems in terms of subdivisions or rare structures for this wave count. It has an excellent fit and so far a typical look.
A channel is drawn on all charts about the downwards wave of primary wave D. Here, it is labelled a best fit channel. If this channel is breached by upwards movement, that may provide reasonable confidence in this weekly triangle wave count and the double zigzag count, and put serious doubt on the combination and flat wave counts.
After a slight new low, this wave count expects a consolidation for primary wave E to back test resistance at prior support, and then a significant new downwards wave for cycle wave C. For the long term, this is the most bearish wave count.
DAILY CHART – TRIANGLE
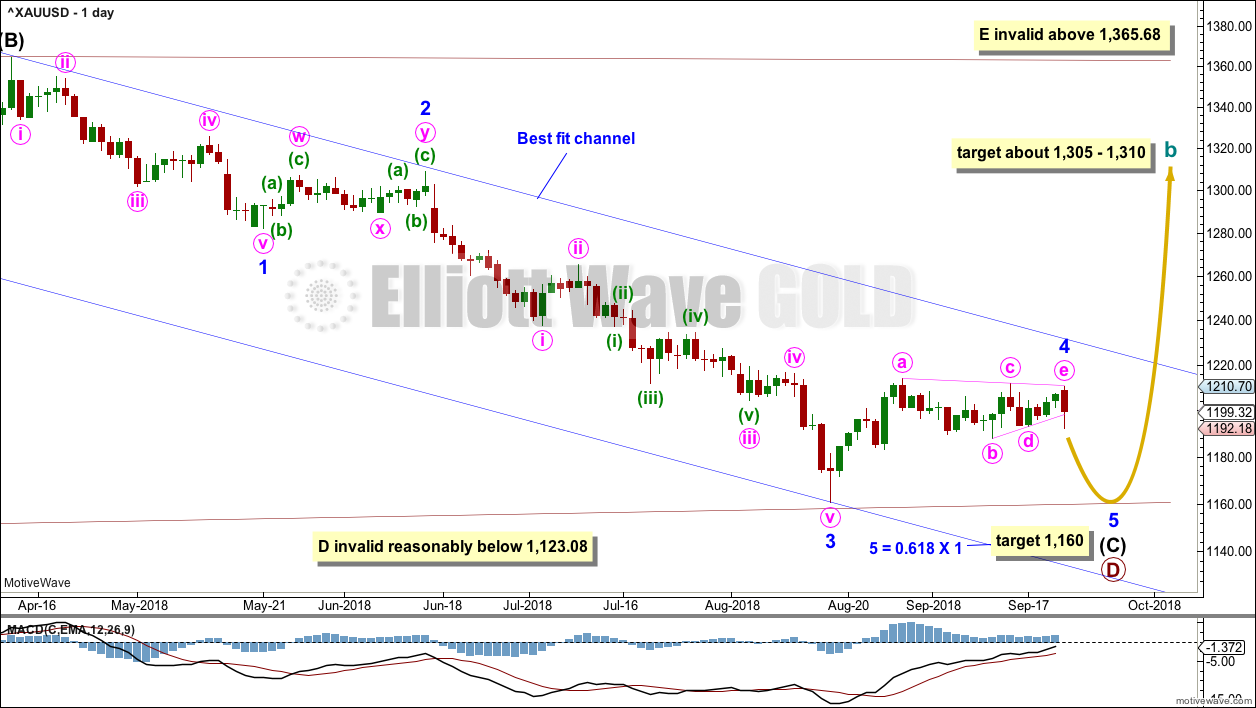
Click chart to enlarge.
Intermediate wave (C) may be almost complete. The triangle for minor wave 4 may have ended on Friday. Early next week may see minor wave 5 complete. A target is calculated for minor wave 5 to end that expects it to exhibit a Fibonacci ratio to minor wave 1, and would still see the B-D trend line of the triangle for cycle wave b have a reasonable slope.
Gold often exhibits surprisingly short and brief fifth waves out of its fourth wave triangles. This wave count expects this tendency.
DAILY CHART – TRIANGLE – ALTERNATE
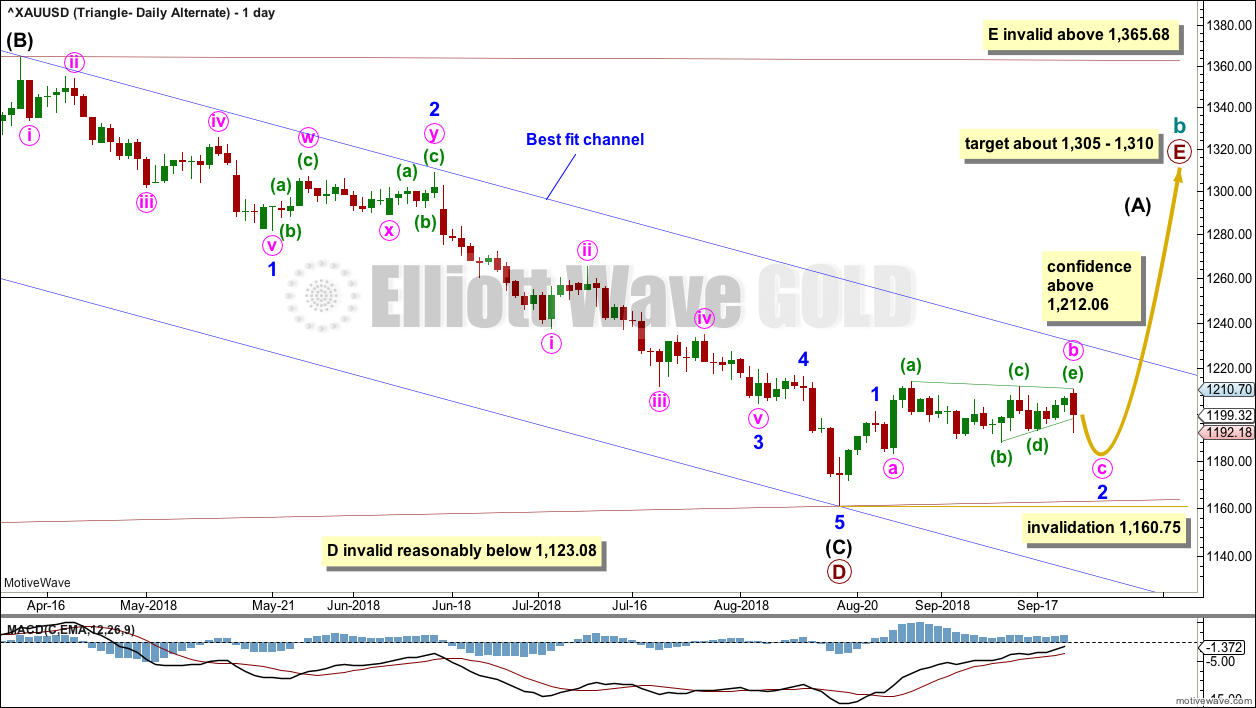
Click chart to enlarge.
Primary wave D may be complete.
Earliest confidence may come with a new high above 1,212.60 to invalidate the daily wave counts, which see a fourth wave triangle completing. If price moves above 1,212.60, with strength and support from volume, then this alternate wave count would be indicated as most likely.
For strong confidence, this wave count now requires a breach of the upper edge of the blue best fit channel. This channel is drawn the same way on all weekly and daily charts, all on a semi-log scale.
Minor wave 1 may have been over on the 22nd of August.
Minor wave 2 no longer fits as a double combination.
Minor wave 2 does fit as an incomplete expanded flat correction. Within the expanded flat, at its end minute wave b is a 1.53 length of minute wave a. Minute wave c would be extremely likely to make at least a slight new low below the end of minute wave a at 1,183.36 to avoid a truncation and a very rare running flat.
Minor wave 2 may not move beyond the start of minor wave 1 below 1,160.75.
A target for primary wave E is the strong zone of resistance about 1,305 to 1,310. Primary wave E is most likely to subdivide as a zigzag (although it may also subdivide as a triangle to create a rare nine wave triangle), and it should last at least a Fibonacci 13 weeks. Primary wave E may not move beyond the end of primary wave C above 1,365.68.
WEEKLY CHART – FLAT
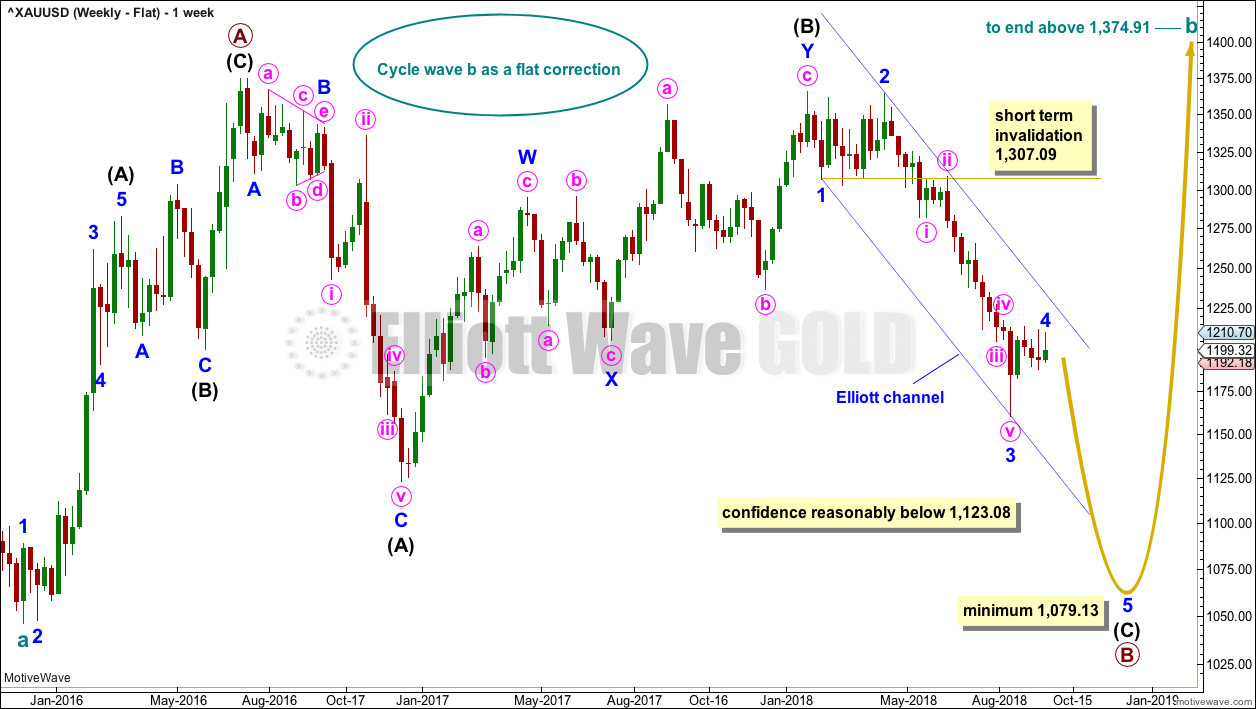
Click chart to enlarge.
It is possible that cycle wave b may be a flat correction. Within a flat correction, primary wave B must retrace a minimum 0.9 length of primary wave A at 1,079.13 or below. Primary wave B may make a new low below the start of primary wave A at 1,046.27 as in an expanded flat correction.
Only a new low reasonably below 1,123.08 would provide reasonable confidence in this wave count.
Intermediate wave (C) must subdivide as a five wave structure; it may be unfolding as an impulse. Within intermediate wave (C), minor waves 1 through to 4 may be complete. Minor wave 4 may have completed in a Fibonacci five weeks. If it continues further, then minor wave 4 may not move into minor wave 1 price territory above 1,307.09.
The blue channel here is drawn using Elliott’s first technique. Minor wave 4 would be most likely to remain contained within this channel, and may find resistance about the upper edge if it gets there. A strong breach of this channel by upwards movement would reduce the probability of this wave count.
Minor wave 2 was a double zigzag lasting nine weeks. To exhibit alternation and reasonable proportion minor wave 4 may be a flat, combination or triangle and may last a little longer than nine weeks as these types of corrections can be longer lasting than zigzags or zigzag multiples.
WEEKLY CHART – DOUBLE ZIGZAG
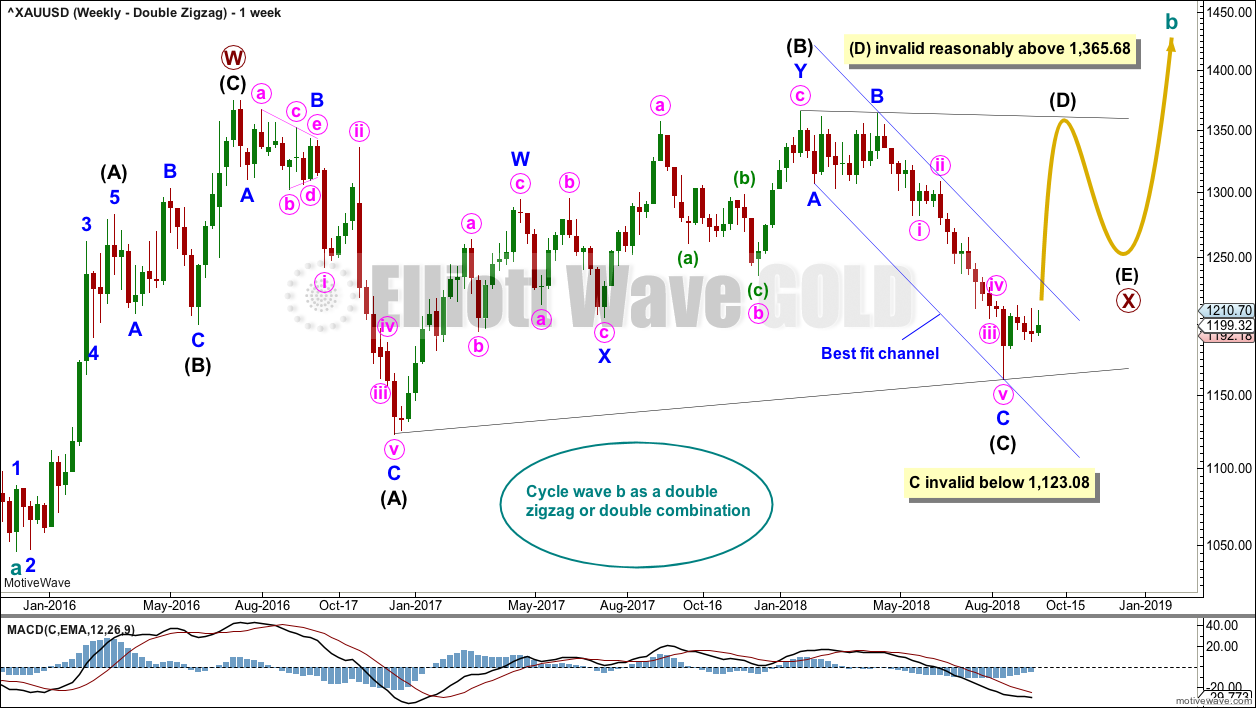
Click chart to enlarge.
Finally, it is also possible that cycle wave b may be a double zigzag or a double combination.
The first zigzag in the double is labelled primary wave W. This has a good fit.
The double may be joined by a corrective structure in the opposite direction, a triangle labelled primary wave X. The triangle would be about two thirds complete.
Within the triangle of primary wave X, intermediate wave (C) may now be complete. It may not move beyond the end of intermediate wave (A) below 1,123.08. The A-C trend line for both a barrier and contracting triangle should have some reasonable slope. For the triangle of primary wave X to have the right look, intermediate wave (C) should end here or very soon indeed.
This wave count may now expect choppy overlapping movement in an ever decreasing range for several more months. After the triangle is complete, then an upwards breakout would be expected from it.
Primary wave Y would most likely be a zigzag because primary wave X would be shallow; double zigzags normally have relatively shallow X waves.
Primary wave Y may also be a flat correction if cycle wave b is a double combination, but combinations normally have deep X waves. This would be less likely.
This wave count has good proportions and no problems in terms of subdivisions.
TECHNICAL ANALYSIS
WEEKLY CHART
Click chart to enlarge. Chart courtesy of StockCharts.com.
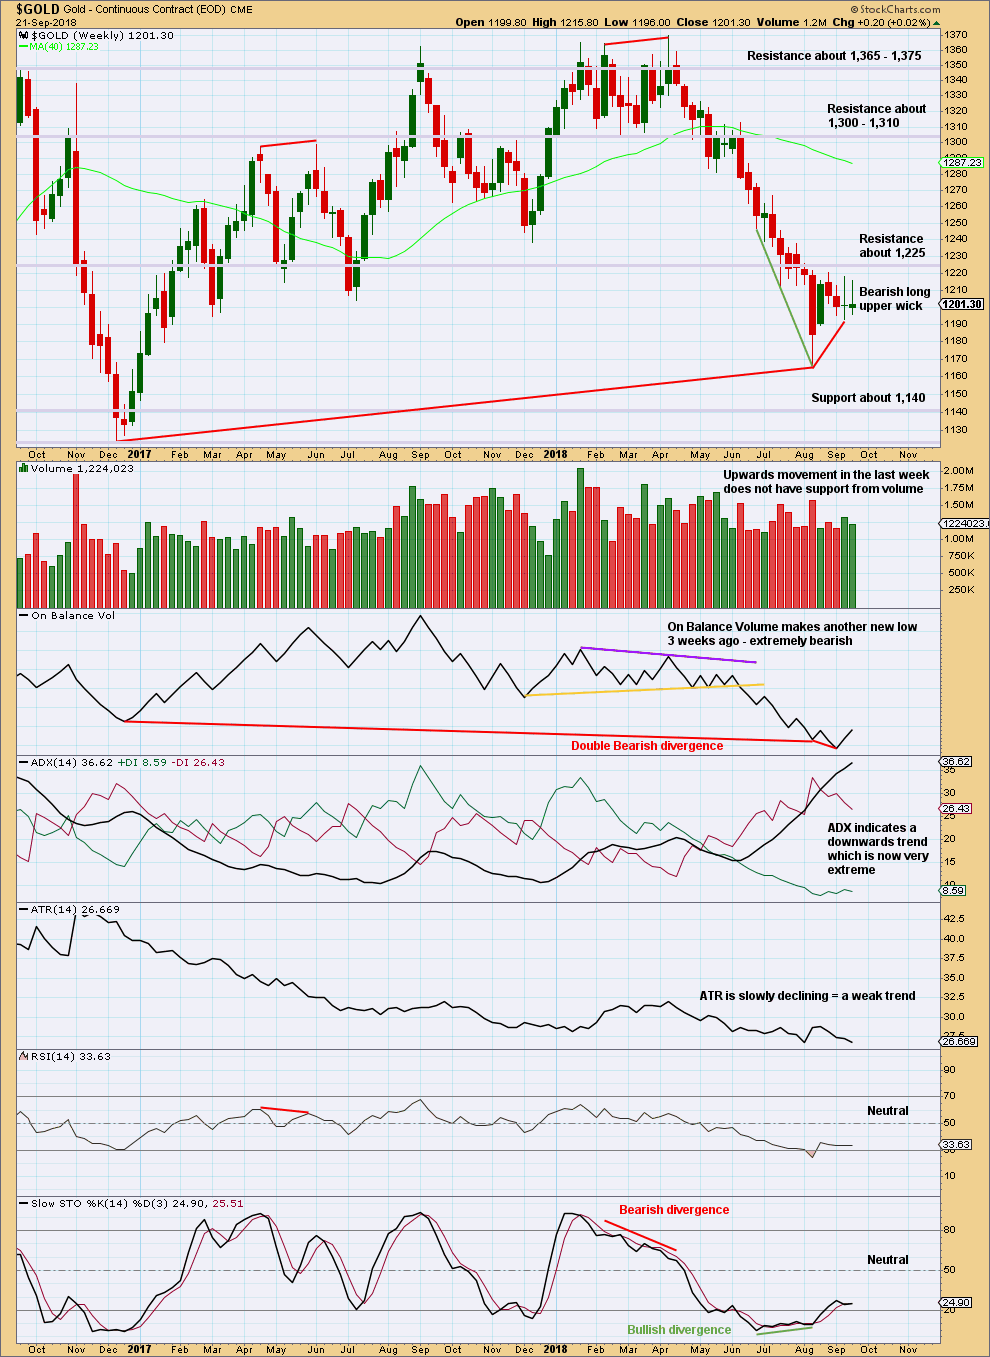
On Balance Volume is lower than its prior point at the end of November 2015. This divergence is extremely bearish but does not rule out a consolidation unfolding here; the divergence does strongly support the Triangle wave count, which expects a consolidation or bounce up to test resistance now and then a continuation of a major bear market. It could also support the flat wave count that allows for a new low below 1,046.27 in coming months.
On Balance Volume has made another new low, but price has not. There is now double bearish divergence between price and On Balance Volume.
When Gold has a strong trend, ADX may remain very extreme for long periods of time and RSI can move more deeply into oversold. However, most recent lows since November 2015 were all found when RSI just reached oversold, so some caution here in looking out for a possible consolidation or trend change would be reasonable.
This week completes an inside week with the balance of volume upwards. Upwards movement within the week no longer has support from volume.
If price does continue lower, then look for next support about 1,140.
DAILY CHART
Click chart to enlarge. Chart courtesy of StockCharts.com.
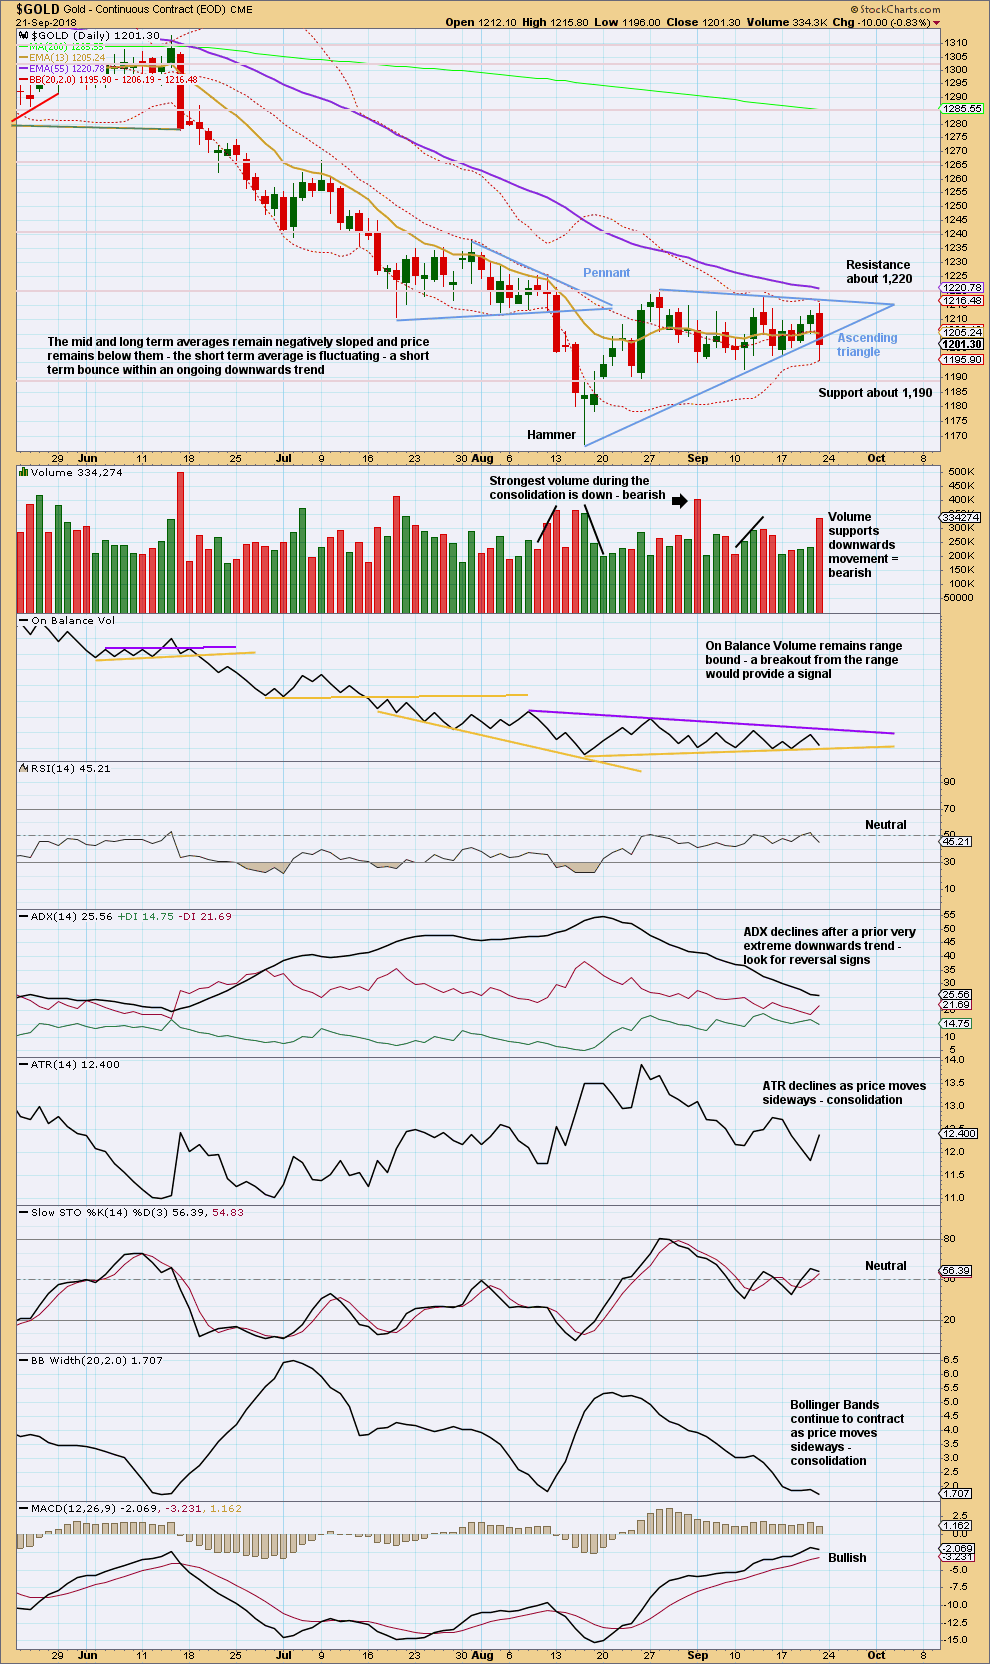
Gold is now range bound. Resistance and support are identified on the chart. It is a downwards day that has strongest volume during this small range bound movement so far, suggesting a downwards breakout may be more likely than upwards. This technique does not always work, but it does work more often than it fails.
On Balance Volume remains range bound, and the trend lines are converging. On Balance Volume will give a signal; if it does so prior to price breaking out, then a direction would be indicated.
From Kirkpatrick and Dhalquist regarding ascending triangles:
“Upwards breakouts occur 77% of the time, and all breakouts usually happen roughly 61% of the distance (time) from the base to the cradle.”
In this case, 61% of the distance from base to cradle was six sessions ago, which clearly did not see a breakout. Friday has closed below the lower triangle trend line with support from volume. This looks like a downwards breakout. Look for a back test of resistance at the lower triangle trend line now before price moves down and away.
A close below support about 1,190 or a bearish signal from On Balance Volume would add further confidence that a downwards breakout to new lows is underway.
GDX WEEKLY CHART
Click chart to enlarge. Chart courtesy of StockCharts.com.
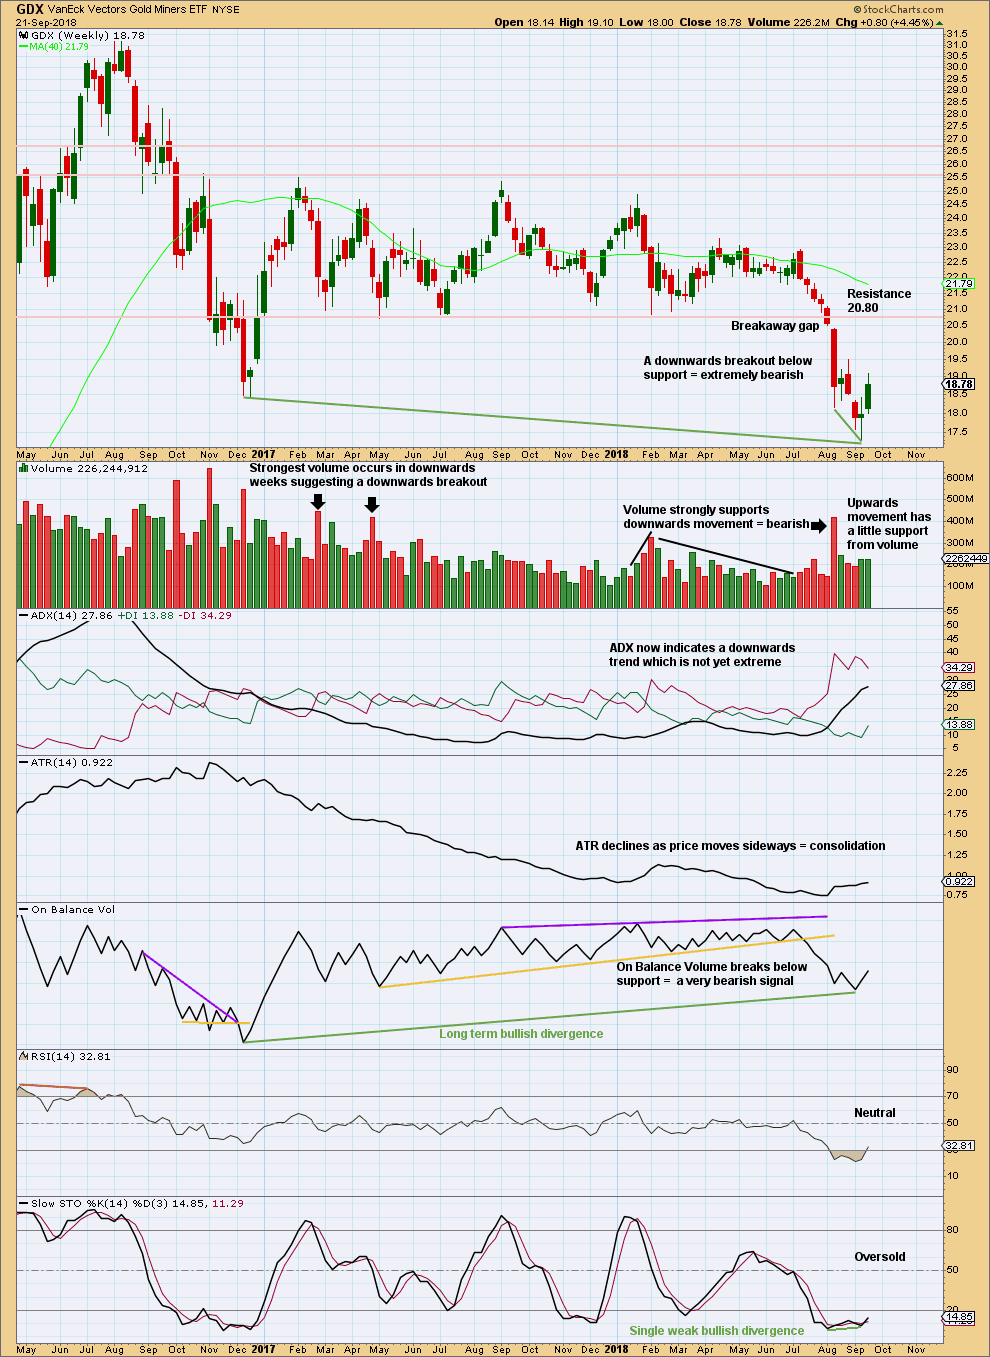
After a breakout, a technical principle is the longer that price consolidates sideways the longer the resulting trend may be expected to be. Also, the longer that price meanders sideways the more energy may be released after a breakout. This is what is happening now for GDX.
A target for this downwards trend to end calculated using the measured rule is at 16.02. That is not yet met.
At the weekly chart level, there is a clear downwards breakout with a breakaway gap. As breakaway gaps should not be closed, they may be used to set stops that may be set just above a downwards breakaway gap.
The bullish divergence between price and On Balance Volume noted with green trend lines is also not a strong signal. On Balance Volume is a leading indicator; when it leads, it offers a signal, but it does not always lead price.
There is short term bullish divergence between price and Stochastics. A consolidation may develop here to relieve extreme conditions. The small bounce of the last two weeks has not yet lasted long enough to relieve extreme conditions, so it may continue either higher or sideways.
GDX DAILY CHART
Click chart to enlarge. Chart courtesy of StockCharts.com.
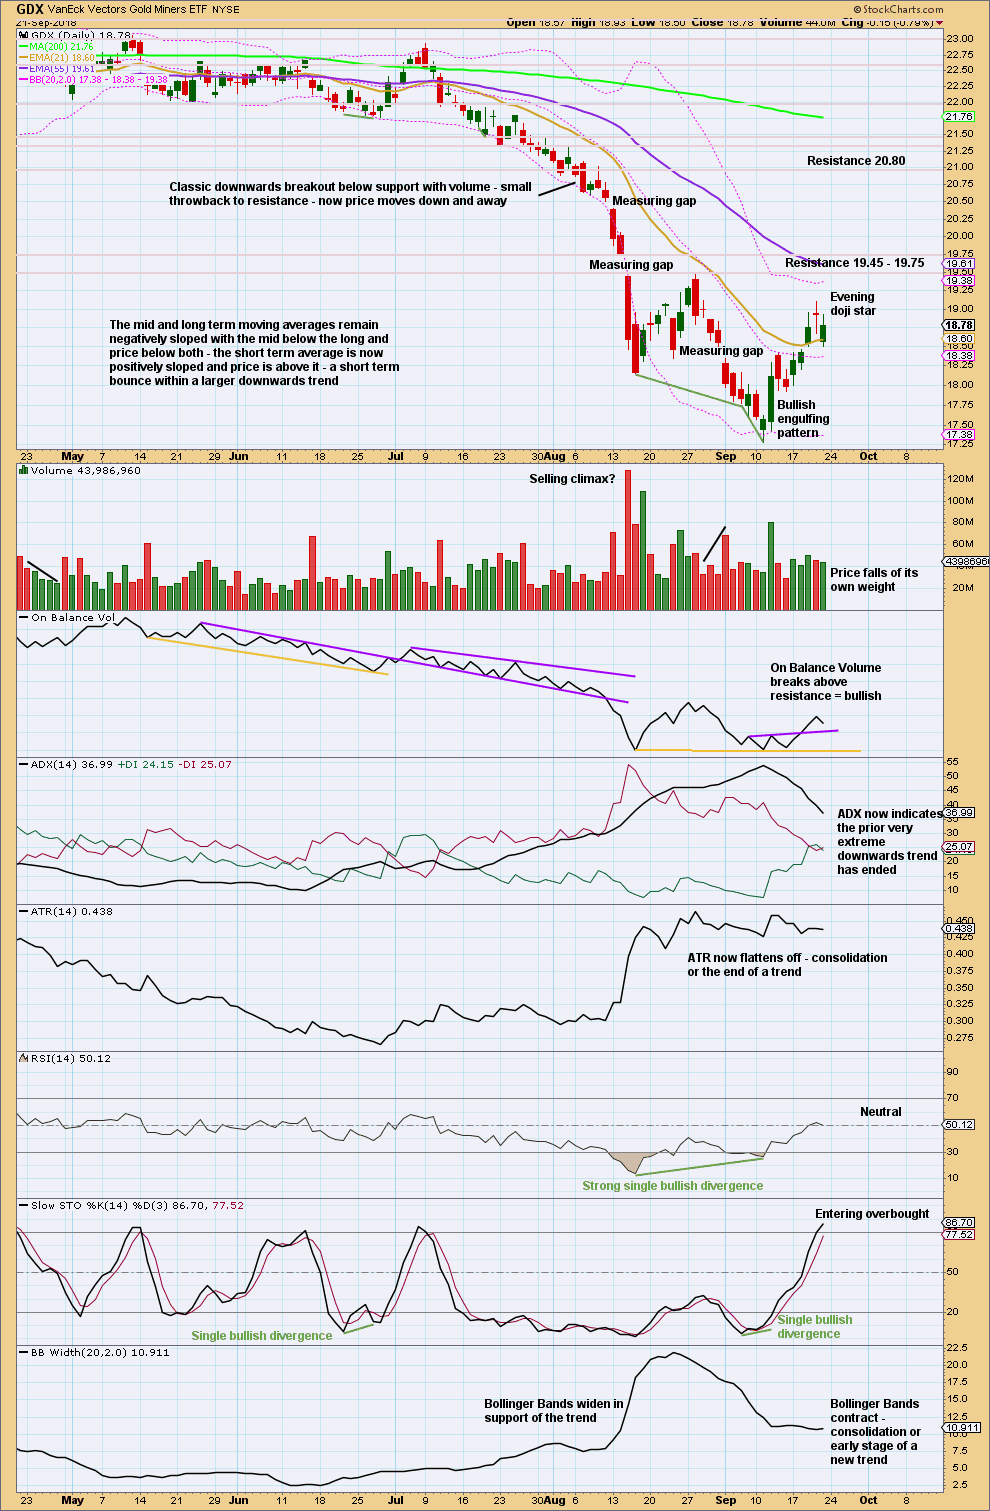
At least for the short term expect upwards movement to end here. A consolidation may continue to relieve oversold conditions; price may now swing downwards towards support.
Published @ 11:55 p.m. EST.
—
Careful risk management protects your trading account(s).
Follow my two Golden Rules:
1. Always trade with stops.
2. Risk only 1-5% of equity on any one trade.
Hourly chart updated:
Remember, this hourly chart works for all of the Daily Chart – Combination, Daily Chart – Triangle and Daily Chart – Triangle Alternate.
Only the degree of labelling and the target differ. The subdivisions are the same: a triangle complete at the hourly chart level, and now a downwards breakout underway.
How low this next wave goes should give us indication as to which of those three daily charts is more likely.
I can now see a first wave down complete, and now a second wave bounce complete as a zigzag. Minuette wave (ii) did not find resistance neatly at the lower trend line, but price has reversed to again sit below the trend line.
The point in time at which the triangle trend lines cross over sometimes sees a trend change, and sometimes that is the end of the fifth wave (or C wave) out of the triangle. That point is about 1.5 weeks away.
https://money.cnn.com/2018/09/24/investing/barrick-randgold-merger-deal/index.html