
Bitcoin continues to move sideways and remains range bound.
Summary: A clear breach of a support line, which has seen all price action above it until this point, is a strong indication that Bitcoin is bearish. Now that a backtest about the support line is complete, price may be expected to continue to move downwards from this line.
At this time, Bitcoin may be in the early stages of a third wave down at six degrees.
A new alternate Elliott wave count is published today which allows for a large bounce here before a continuation of downwards movement to new lows.
The data used for this analysis now comes from Yahoo Finance BTC-USD.
Updates to this analysis are in bold.
Last analysis may be found here.
FIRST ELLIOTT WAVE COUNT
MONTHLY
Click chart to enlarge.
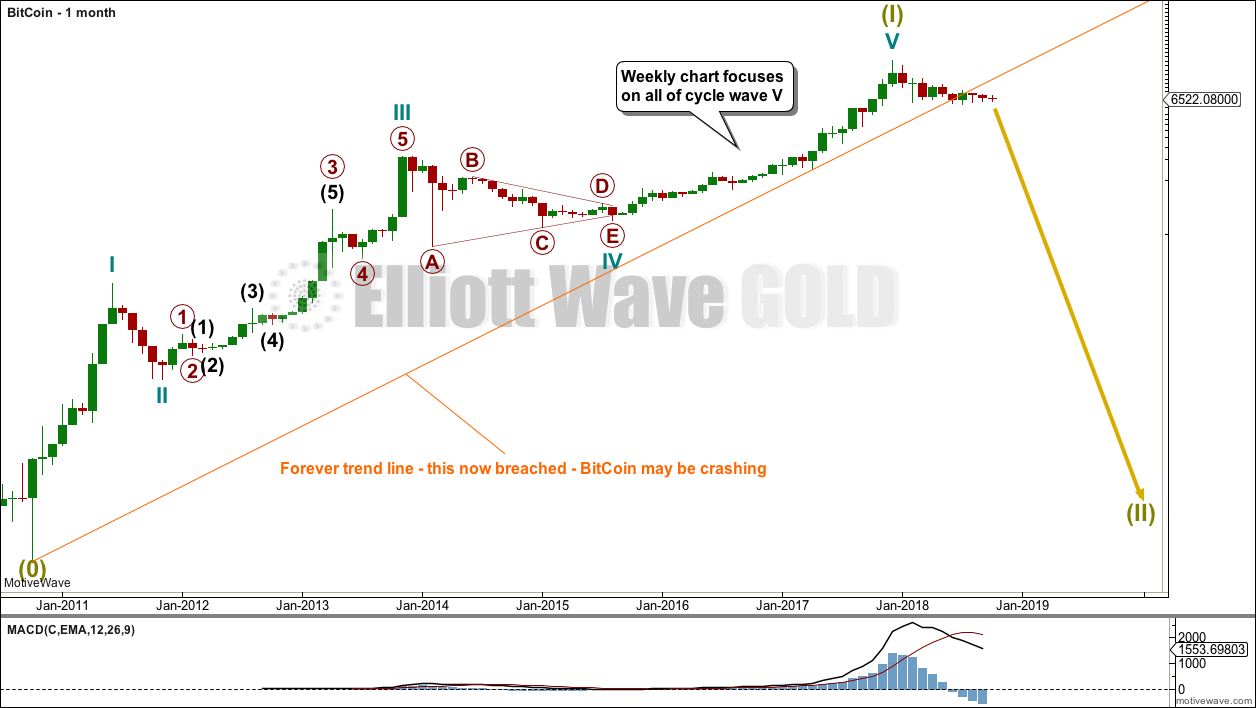
It is possible to see a completed five wave impulse upwards for Bitcoin.
I am unable to find reasonable Fibonacci ratios within this wave count. It appears that Bitcoin may not exhibit Fibonacci ratios very often between its waves, so this makes target calculation impossible. Classic technical analysis was used to identify a high in place on the 23rd of December, 2017.
What is very clear from this chart is that Bitcoin is a classic bubble. This looks like an even larger bubble than the Tulip Mania. The only thing about which I am certain is that this bubble will pop and Bitcoin will collapse.
Now that the Forever trend line is breached some confidence may be had that Bitcoin may be crashing.
WEEKLY
Click chart to enlarge.
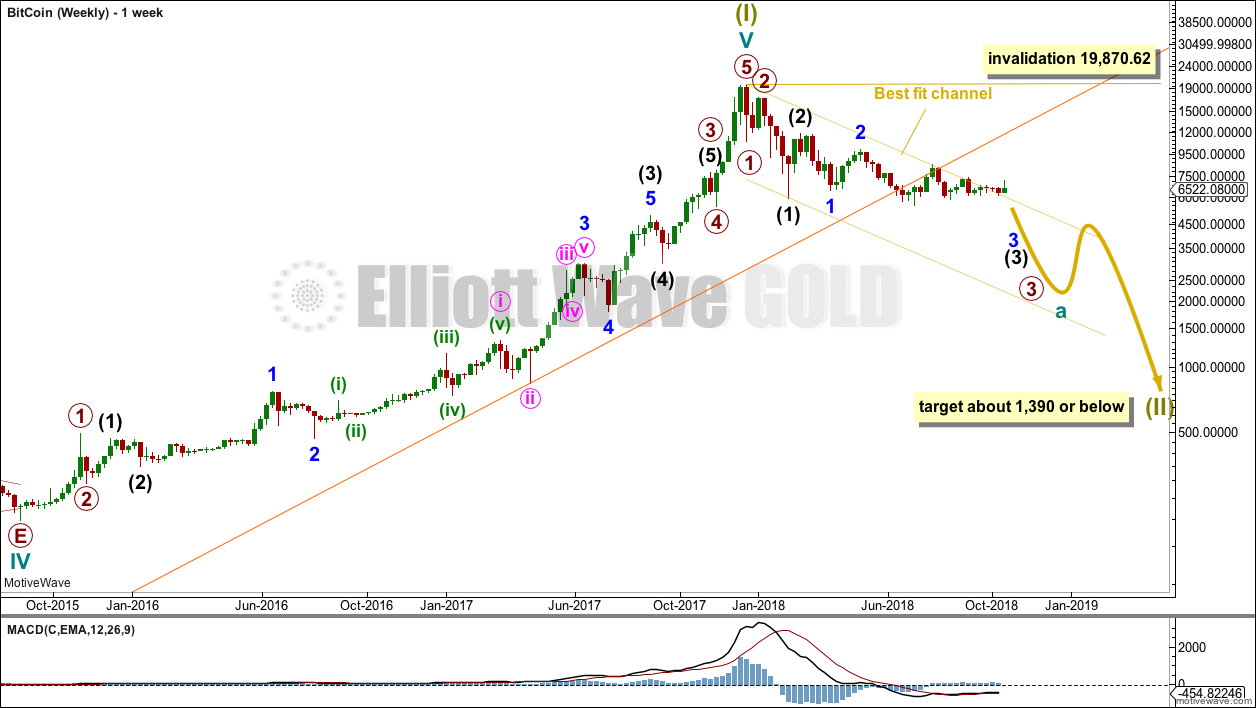
Bitcoin tends to behave like an extreme commodity: price moves upwards for about 2 – 4 weeks in a near vertical movement at the end of its rises. Following this vertical movement the resulting downwards movement is very deep (in percentage terms) and often very quick.
The next rise begins slowly with basing action over weeks or months, and then as the rise nears its end another vertical movement completes it. Also, there are volume spikes just before or at the end, which is another feature typical of commodity like behaviour.
This has happened now several times. The most notable instances are the rise up to the week ending 24th November, 2013, and the week ending 5th June, 2011. The following sharp drops were 94% and 93% respectively.
If this current drop continues like the last two examples, then a reasonable target may be about $1,390.94 or below.
DAILY
Click chart to enlarge.
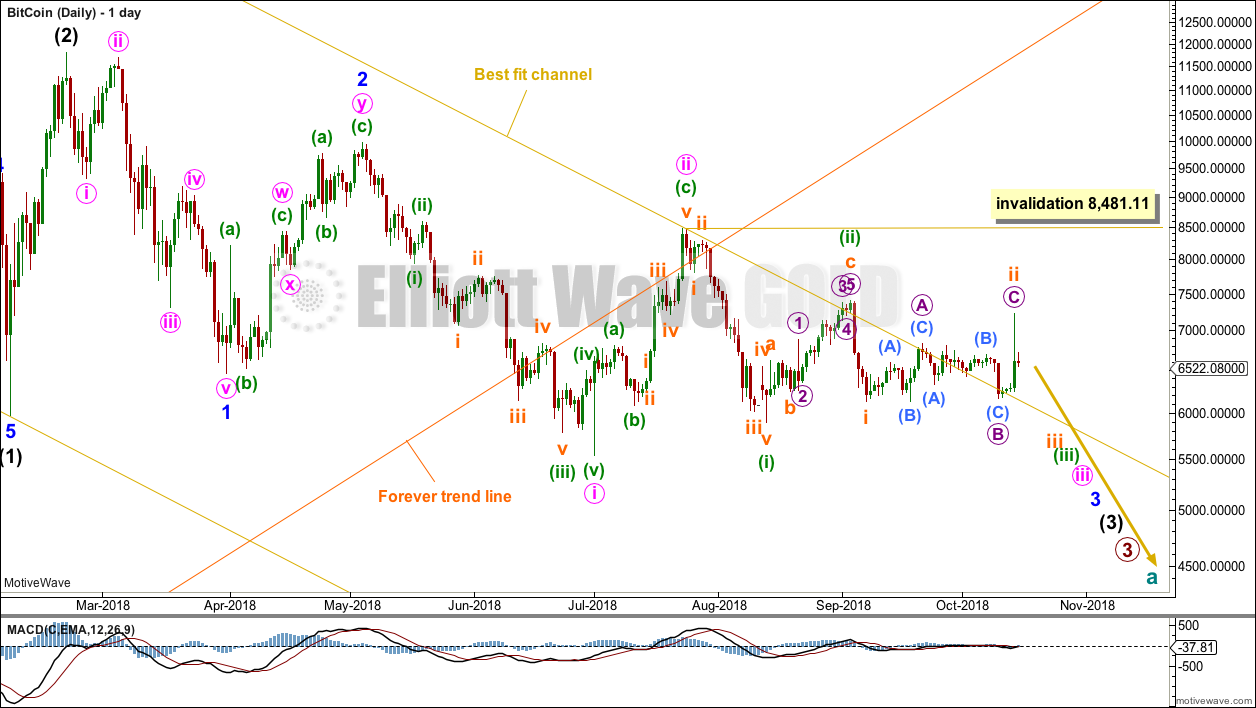
If Bitcoin is in the early stages of a huge crash, then a five down structure should develop at the weekly chart level. This would still be incomplete.
A third wave down may now be beginning at six degrees. Bitcoin may be still winding up for a spectacular plummet in price. The strongest fall may come towards the end of any one or more of these third waves as Bitcoin exhibits commodity like behaviour. Commodities tend to have their strongest portion of impulses in the fifth waves.
The best fit channel has only weak technical significance and is now breached.
The Forever trend line is not perfectly showing where price found support and has then found resistance for a typical back test. However, it is about where price found support and resistance. The breach and back test are highly significant.
I have searched to find if a five down could be seen as complete. At this time, I cannot yet see either a complete impulse or a leading diagonal.
SECOND ELLIOTT WAVE COUNT
WEEKLY
Click chart to enlarge.
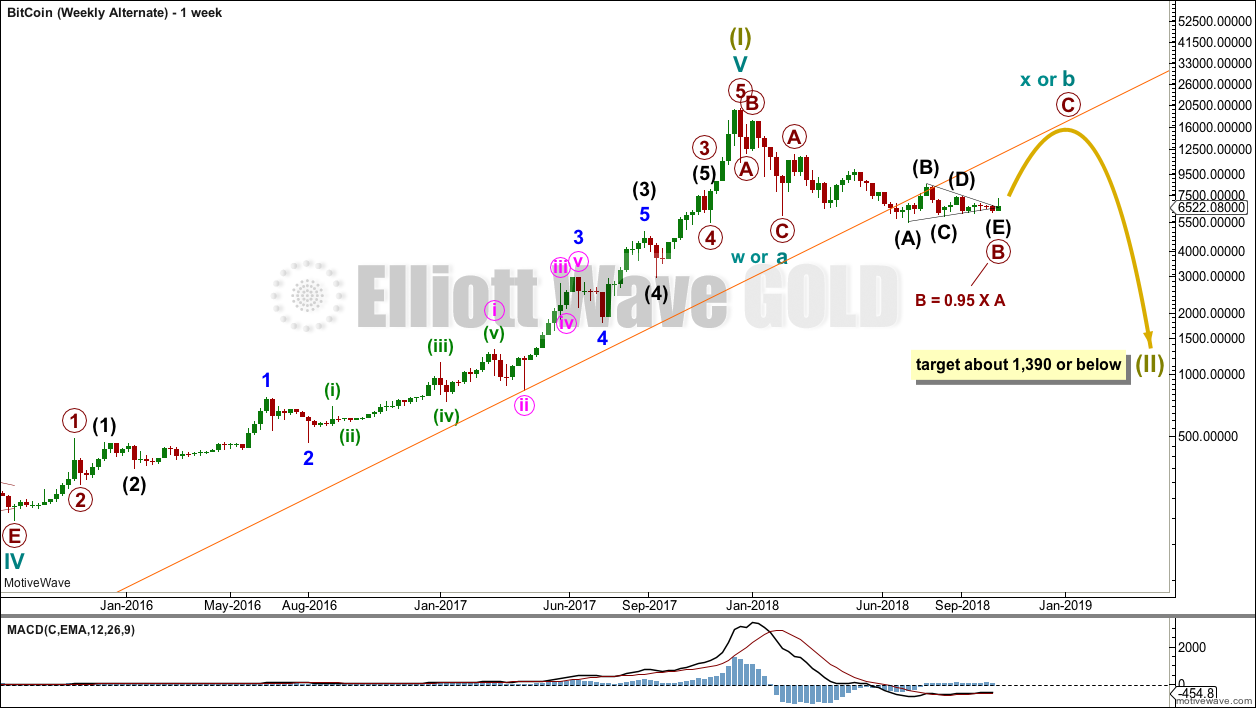
It is also possible that Bitcoin may move lower as a flat correction, double combination or a double zigzag.
Within a flat correction, cycle wave a may have completed as a zigzag. Cycle wave b would need to move higher to retrace a minimum 0.9 length of cycle wave a at 18,480. Cycle wave b would need to subdivide as a corrective structure, most likely a zigzag. Cycle wave b within a flat correction may make a new price extreme beyond the start of cycle wave a.
Within a double zigzag, cycle wave w may be the first zigzag complete. Cycle wave x would have no minimum nor maximum required length to cycle wave w; it only needs to complete as a corrective structure, which would most likely be a zigzag. X waves within double zigzags are usually shallow, so that the whole structure has a strong slope.
Within a double combination, cycle wave w may be the first complete structure as a zigzag. Cycle wave x would have no minimum nor maximum required length to cycle wave w; it only needs to complete as a corrective structure, which would most likely be a zigzag. X waves within combinations are usually deep, so that the whole structure has a sideways look. Cycle wave x within a combination may make a new price extreme beyond the start of cycle wave w.
A second wave may not subdivide as a triangle with its sole corrective structure, so a triangle for this correction is not considered.
DAILY
Click chart to enlarge.
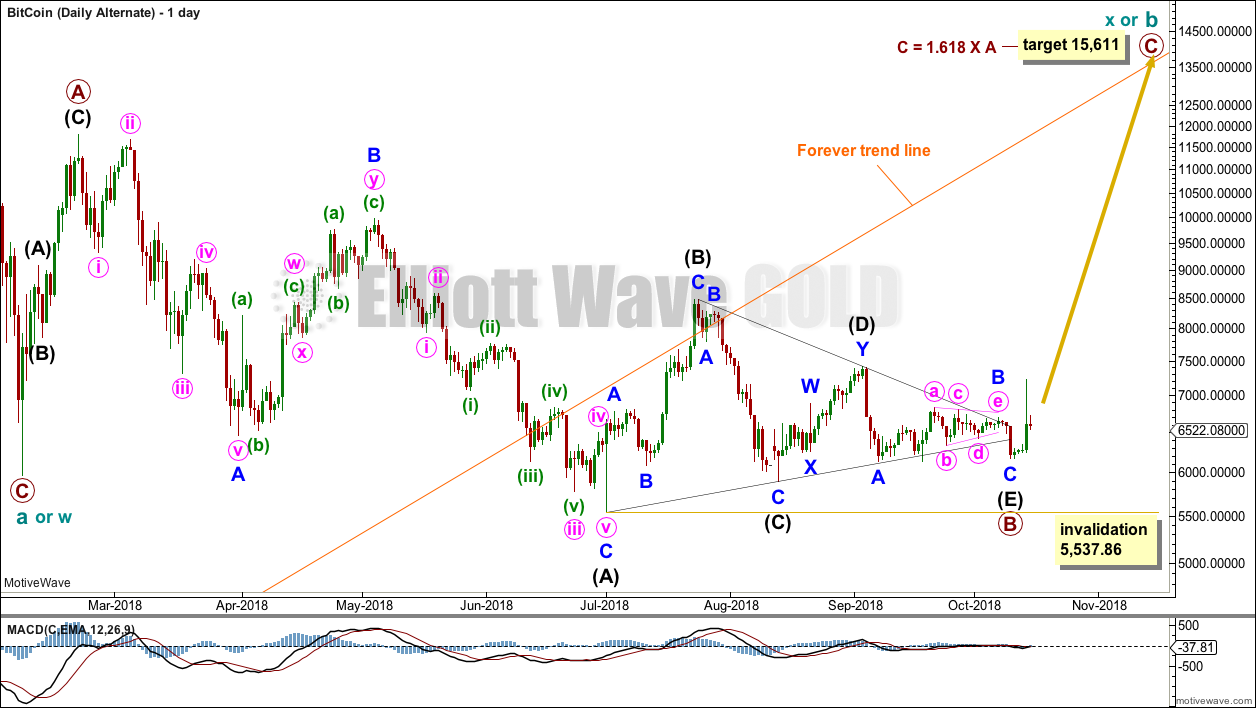
The daily chart focusses on the whole of cycle wave b or x so far.
Cycle wave b or x may be unfolding as a regular flat correction, and within it primary wave A fits as a three and primary wave B also fits as a corrective structure. Primary wave B effects a net 0.965 re-tracement of primary wave A at its end. This meets the minimum requirement of 0.9 for B waves within flat corrections.
A target is calculated for primary wave C to end. However, because Bitcoin does not exhibit reliable Fibonacci ratios this target is a rough guideline only. A better guide may be resistance about the orange forever trend line.
TECHNICAL ANALYSIS
Click chart to enlarge.
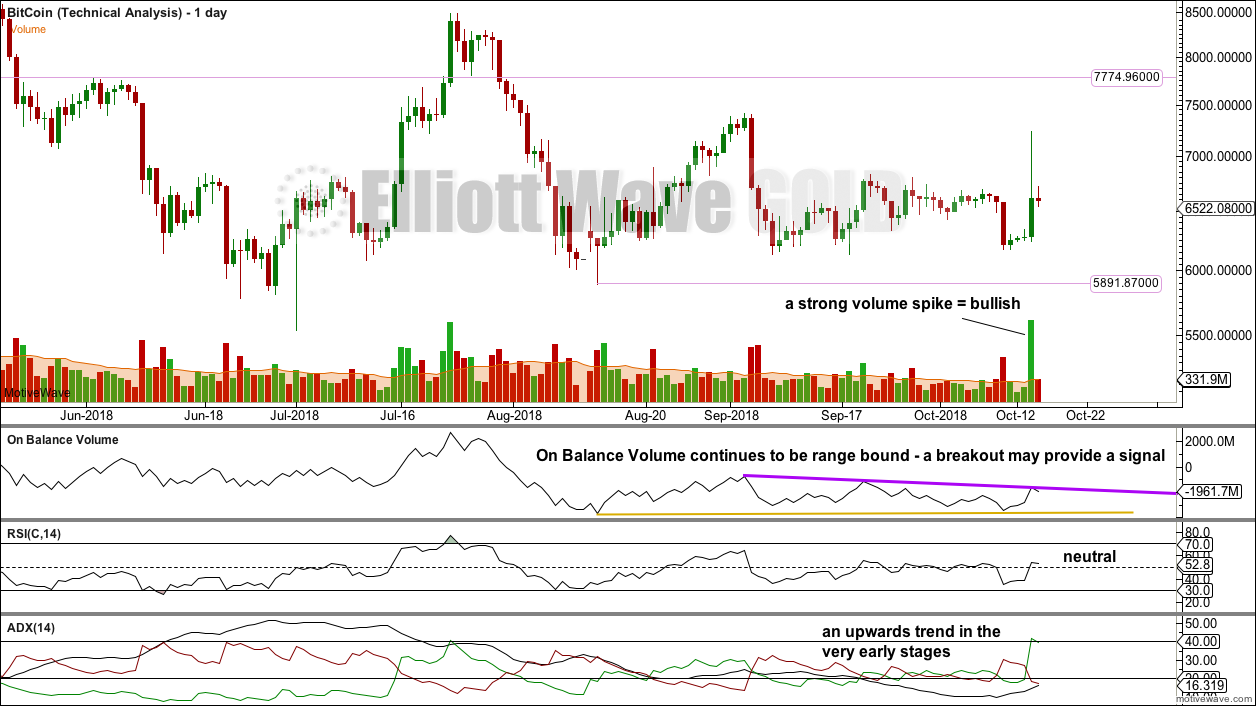
Volume is declining (at higher time frames); this market is falling mostly of its own weight. However, looking more closely, daily volume is stronger for downwards days than for upwards days.
The following can be noted when looking back at Bitcoin’s behaviour during its previous strong falls in price:
The 94% fall in price from June to November 2011 was characterised by:
– Three clearly separate instances of RSI reaching oversold on the daily chart, separated by bounces.
– ADX did not remain very extreme for very long at all on the daily chart.
– On Balance Volume exhibited weak single bullish divergence at the low.
The 93% fall in price from November 2013 to February 2014 was characterised by:
– RSI reached oversold and remained deeply oversold for three weeks; at the low there was only single weak bullish divergence with price.
– ADX remained very extreme for the last seven sessions to the low.
– At the low, On Balance Volume did not exhibit bullish divergence with price; it remained bearish and then exhibited further bearishness after the low as it continued to decline as price began to rise.
For the current fall in price, the current Elliott wave count expects the fall to be larger in terms of duration than the previous two noted here, and at least equivalent in terms of price movement in that a fall of over 90% is expected now. Currently, ADX is not yet extreme and RSI is not yet oversold. There is plenty of room for this downwards trend in Bitcoin to continue. So far at the lowest low from the all time high Bitcoin has only retraced 0.70. While this is deep, its corrections are usually deeper than this.
On Balance Volume and price remain range bound. Price has resistance about 7,775 and support about 5,890. Watch both closely to see a breakout.
Published @ 03:21 p.m. EST.