
Another small range day remains within the consolidation zone. On Balance Volume remains range bound and may give a signal within a very few days.
Summary: Price is range bound with resistance about 1,220 and support about 1,185. It is still a downwards day that has the strongest volume within the consolidation, suggesting a downwards breakout is more likely than upwards. This technique does not always work (it failed prior to the breakout on 15th of May), but it does still work more often than it fails.
On Balance Volume remains range bound; a breakout from its range may indicate the next direction for price.
New updates to this analysis are in bold.
Grand SuperCycle analysis is here.
Last historic analysis with monthly charts is here.
There are four remaining weekly wave counts at this time for cycle wave b: a triangle, a flat, a combination, and a double zigzag.
At this stage, all four weekly wave counts remain valid, and classic analysis no longer is clear on which wave count may be most likely. The weekly wave counts are presented in no particular order.
MAIN ELLIOTT WAVE COUNT
WEEKLY CHART – COMBINATION
Click chart to enlarge.
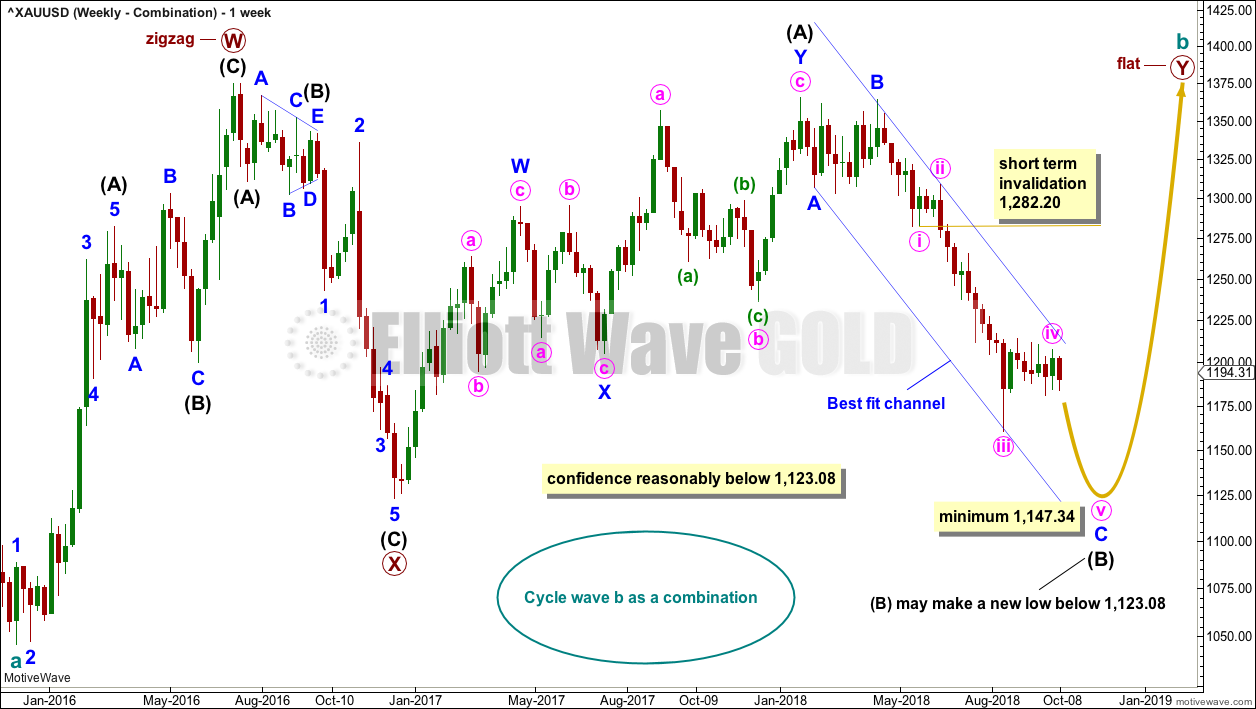
If cycle wave b is a combination, then the first structure in a double may be a complete zigzag labelled primary wave W.
The double may be joined by a three in the opposite direction, a zigzag labelled primary wave X.
The second structure in the double may be a flat correction labelled primary wave Y. My research on Gold so far has found that the most common two structures in a double combination are one zigzag and one flat correction. I have found only one instance where a triangle unfolded for wave Y. The most likely structure for wave Y would be a flat correction by a very wide margin, so that is what this wave count shall expect.
Within a flat correction for primary wave Y, the current downwards wave of intermediate wave (B) may be a single or multiple zigzag; for now it shall be labelled as a single. Intermediate wave (B) must retrace a minimum 0.9 length of intermediate wave (A) at 1,147.34. Intermediate wave (B) may move beyond the start of intermediate wave (A) as in an expanded flat.
Because the minimum requirement for intermediate wave (B) is not yet met, this wave count requires that minute wave v of minor wave C of intermediate wave (B) continues lower. This is the most immediately bearish of all four weekly wave counts.
When intermediate wave (B) is complete, then intermediate wave (C) would be expected to make at least a slight new high above the end of intermediate wave (A) at 1,365.68 to avoid a truncation. Primary wave Y would be most likely to end about the same level as primary wave W at 1,374.91, so that the whole structure takes up time and moves price sideways, as that is the purpose of double combinations.
While double combinations are very common, triples are extremely rare. I have found no examples of triple combinations for Gold at daily chart time frames or higher back to 1976. When the second structure in a double is complete, then it is extremely likely (almost certain) that the whole correction is over.
DAILY CHART – COMBINATION
Click chart to enlarge.
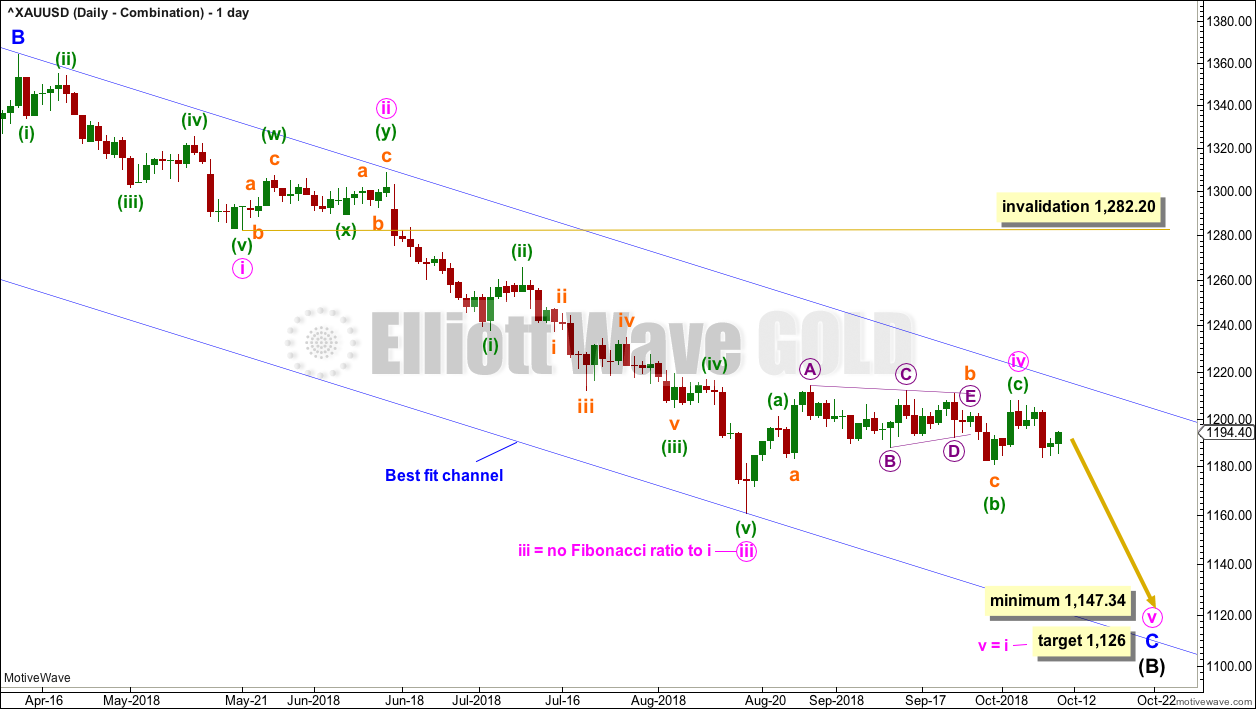
Intermediate wave (B) may be unfolding lower as either a single or double zigzag. At this stage, a single zigzag will be considered; the expected direction nor minimum requirement at 1,147.34 do not differ from a double zigzag.
If intermediate wave (B) is unfolding as a single zigzag, then within it minor wave C must subdivide as a five wave impulse.
Minute wave iv may now be a complete zigzag. Within the zigzag, minuette wave (c) has moved above the end of minuette wave (a), avoiding a truncation. A target is calculated for minute wave v to end; if minute wave iv moves higher, then the target for minute wave v must also move correspondingly higher.
Minute wave iv may not move into minute wave i price territory above 1,282.20. However, minute wave iv should remain contained within the blue channel. If price breaks above the upper edge of this channel, then this wave count may be adjusted or discarded.
HOURLY CHART
Click chart to enlarge.
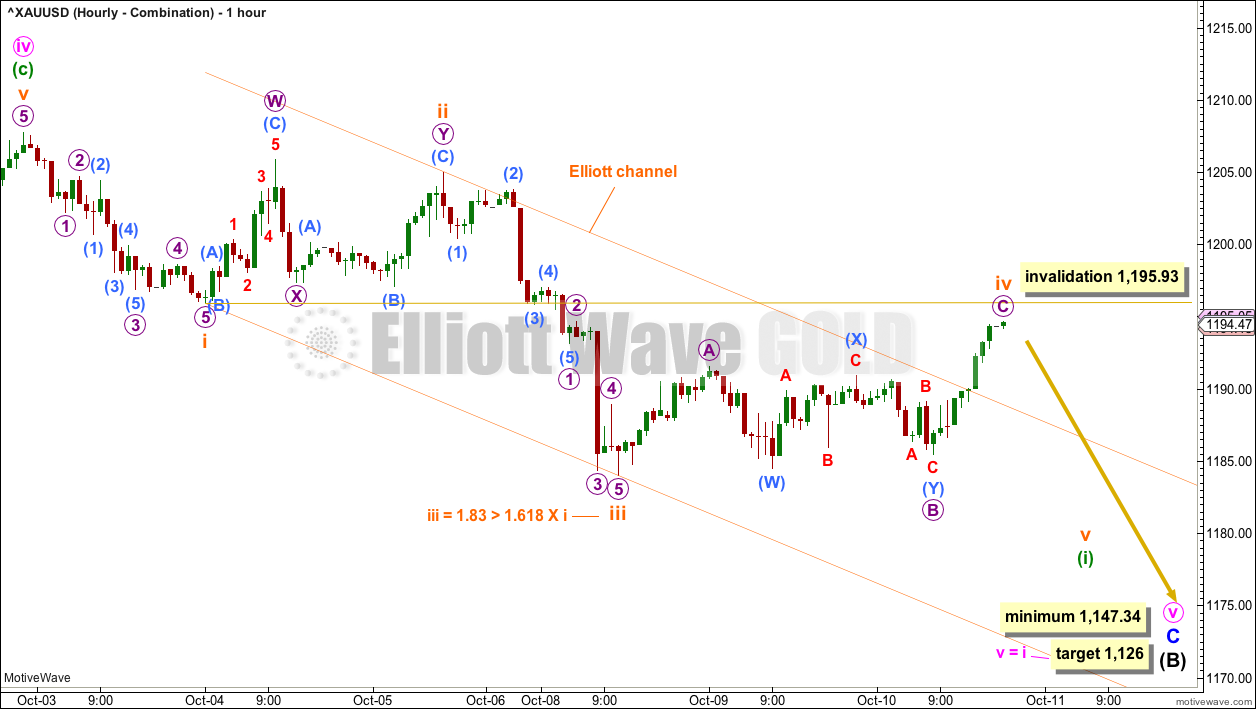
Minute wave v must subdivide as a five wave structure.
Given the minimum requirement for minute wave v to end at or below 1,147.34, it may be that only minuette wave (i) so far is an incomplete five wave impulse.
Within minuette wave (i), so far subminuette waves i, ii and iii may now be complete. There is an adequate Fibonacci ratio between subminuette waves i and iii.
Subminuette wave iv may be unfolding as a zigzag, but it has strongly breached the upper edge of the Elliott channel. This is possible, but the probability of this count now is low. Subminuette wave iv may not move into subminuette wave i price territory above 1,195.93. If price does move above 1,195.93, then a zigzag may be complete at the last low, indicating a possible ending diagonal unfolding for minute wave v.
There would be alternation between the combination of subminuette wave ii and a zigzag of subminuette wave iv.
WEEKLY CHART – TRIANGLE
Click chart to enlarge.
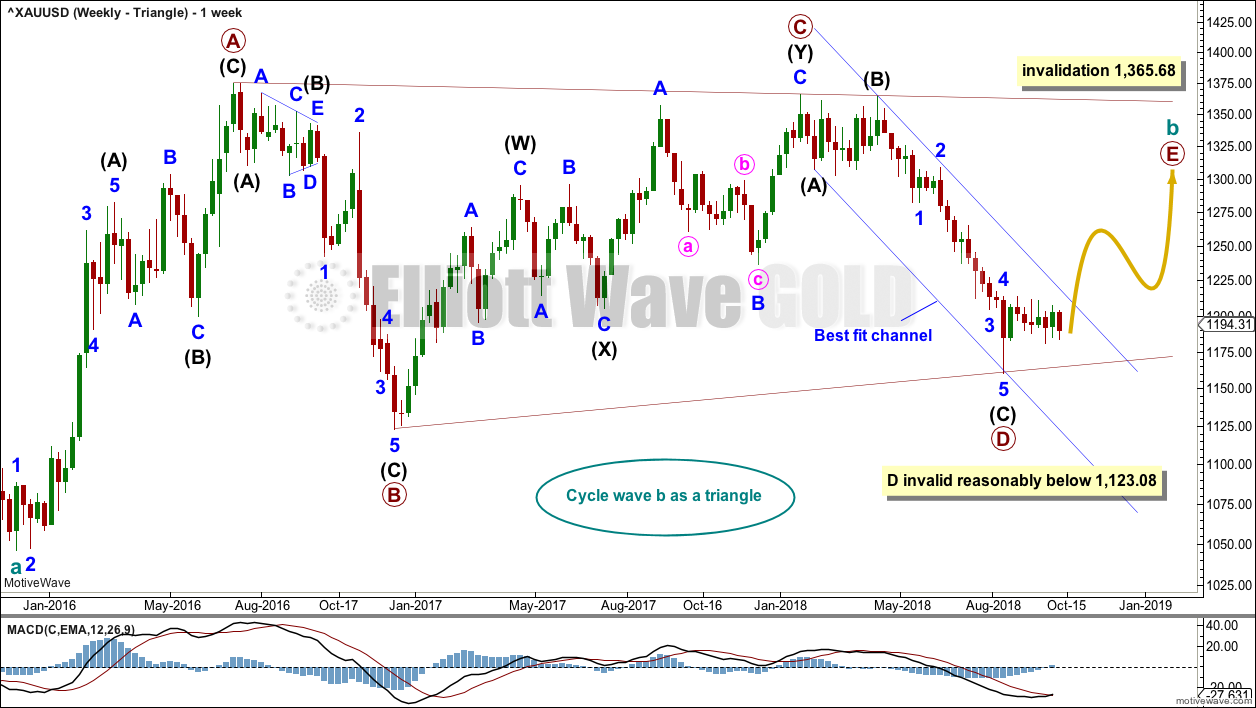
Cycle wave b may be an incomplete triangle. The triangle may be a contracting or barrier triangle, with a contracting triangle looking much more likely because the A-C trend line does not have a strong slope. A contracting triangle could see the B-D trend line have a stronger slope, so that the triangle trend lines converge at a reasonable rate. A barrier triangle would have a B-D trend line that would be essentially flat, and the triangle trend lines would barely converge.
Within a contracting triangle, primary wave D may not move beyond the end of primary wave B below 1,123.08. Within a barrier triangle, primary wave D may end about the same level as primary wave B at 1,123.08, so that the B-D trend line is essentially flat. Only a new low reasonably below 1,123.08 would invalidate the triangle.
Within both a contracting and barrier triangle, primary wave E may not move beyond the end of primary wave C above 1,365.68.
Four of the five sub-waves of a triangle must be zigzags, with only one sub-wave allowed to be a multiple zigzag. Wave C is the most common sub-wave to subdivide as a multiple, and this is how primary wave C for this example fits best.
Primary wave D must be a single structure, most likely a zigzag.
There are no problems in terms of subdivisions or rare structures for this wave count. It has an excellent fit and so far a typical look.
A channel is drawn on all charts about the downwards wave of primary wave D. Here, it is labelled a best fit channel. If this channel is breached by upwards movement, that may provide reasonable confidence in this weekly triangle wave count and the double zigzag count, and put serious doubt on the combination and flat wave counts.
Primary wave E may now continue higher as a large three wave structure.
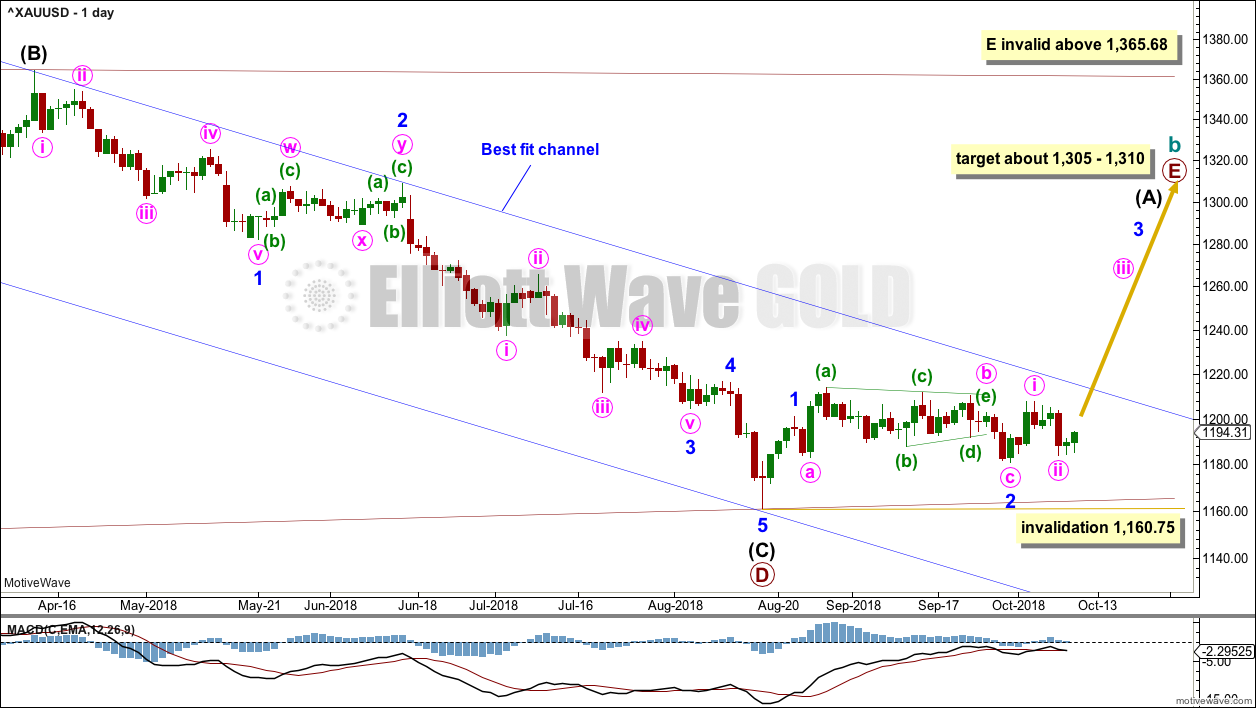
DAILY CHART – TRIANGLE
Click chart to enlarge.
Primary wave D may be complete.
For strong confidence, this wave count now requires a breach of the upper edge of the blue best fit channel. This channel is drawn the same way on all weekly and daily charts, all on a semi-log scale.
Minor wave 1 may have been over on the 22nd of August.
Minor wave 2 may be a complete expanded flat correction.
Minute wave b may be complete at a 1.1 length of minute wave a. Minute wave c has ended below the end of minute wave a at 1,183.36, avoiding a truncation and a very rare running flat.
If it continues further, then minor wave 2 may not move beyond the start of minor wave 1 below 1,160.75. It is possible that minor wave 2 could continue further as a double combination or a double flat, both of which are sideways types of corrections.
If labelling for the start of primary wave E is correct, then there may now be two overlapping first and second waves complete. An increase in upwards momentum may be expected this week for this wave count.
A target for primary wave E is the strong zone of resistance about 1,305 to 1,310. Primary wave E is most likely to subdivide as a zigzag (although it may also subdivide as a triangle to create a rare nine wave triangle), and it should last at least a Fibonacci 13 weeks. It may also last a total Fibonacci 21 or 34 weeks. So far it has lasted only 8 weeks. Primary wave E may not move beyond the end of primary wave C above 1,365.68.
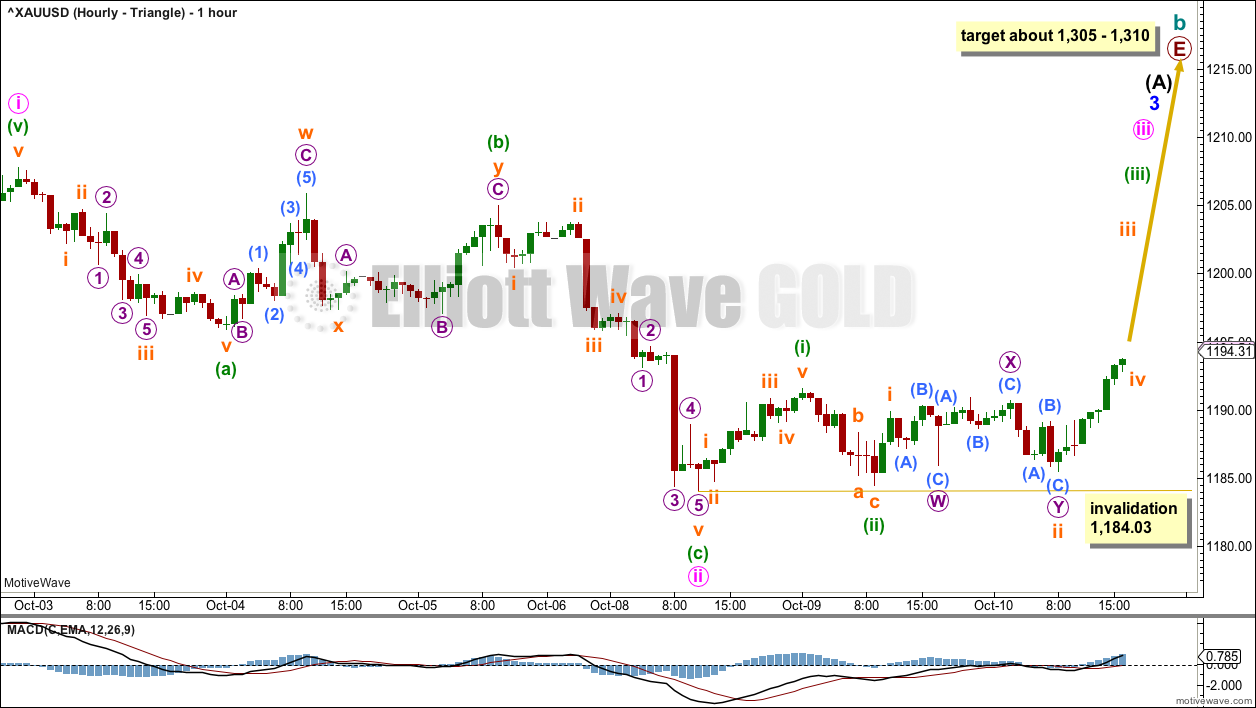
HOURLY CHART – TRIANGLE
Click chart to enlarge.
Minor wave 3 may only subdivide as an impulse. Within the impulse, there may now be a series of three overlapping first and second waves complete.
This wave count would now expect an imminent upwards breakout from the consolidation, with a close above 1,220, as the middle of a third wave unfolds upwards.
If minuette wave (ii) continues further sideways, then it may not move beyond the start of minuette wave (i) below 1,184.03.
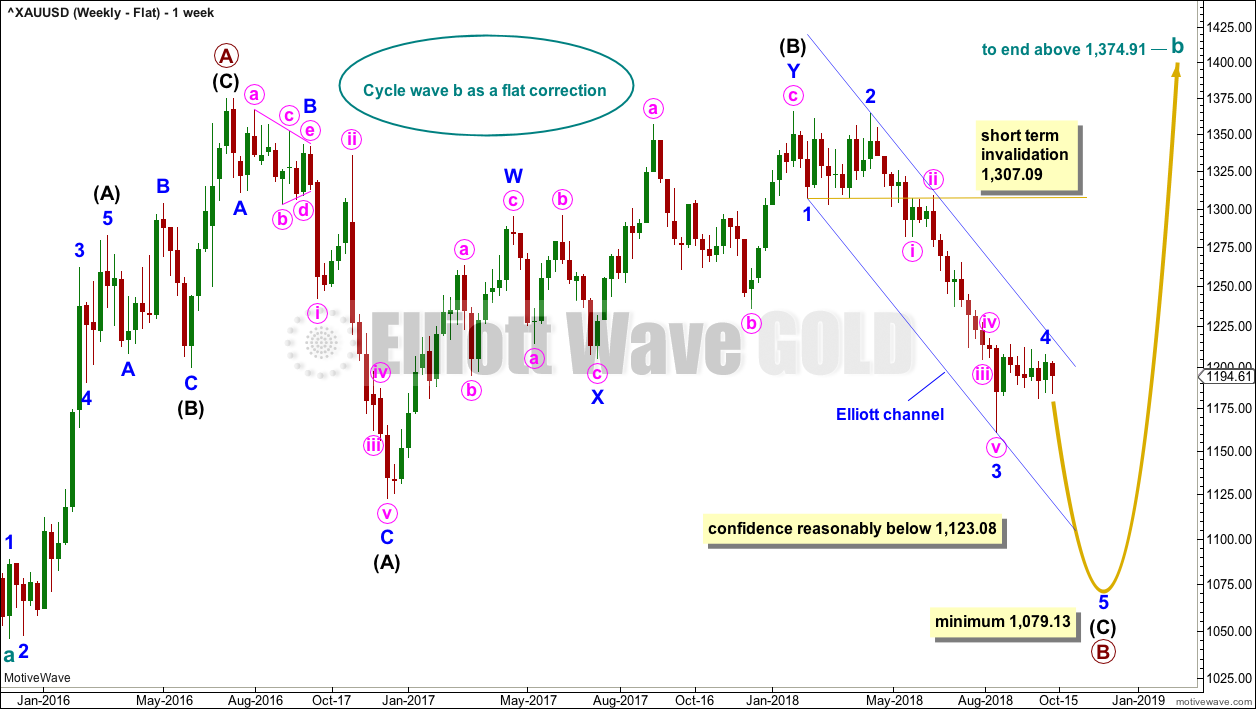
WEEKLY CHART – FLAT
Click chart to enlarge.
It is possible that cycle wave b may be a flat correction. Within a flat correction, primary wave B must retrace a minimum 0.9 length of primary wave A at 1,079.13 or below. Primary wave B may make a new low below the start of primary wave A at 1,046.27 as in an expanded flat correction.
Only a new low reasonably below 1,123.08 would provide reasonable confidence in this wave count.
Intermediate wave (C) must subdivide as a five wave structure; it may be unfolding as an impulse. Within intermediate wave (C), minor waves 1 through to 4 may be complete. If it continues further, then minor wave 4 may not move into minor wave 1 price territory above 1,307.09.
The blue channel here is drawn using Elliott’s first technique. Minor wave 4 would be most likely to remain contained within this channel, and may find resistance about the upper edge if it gets there. A strong breach of this channel by upwards movement would reduce the probability of this wave count.
Minor wave 2 was a double zigzag lasting nine weeks. Minor wave 4 exhibits little alternation as a single zigzag and reasonable proportion lasting seven weeks.
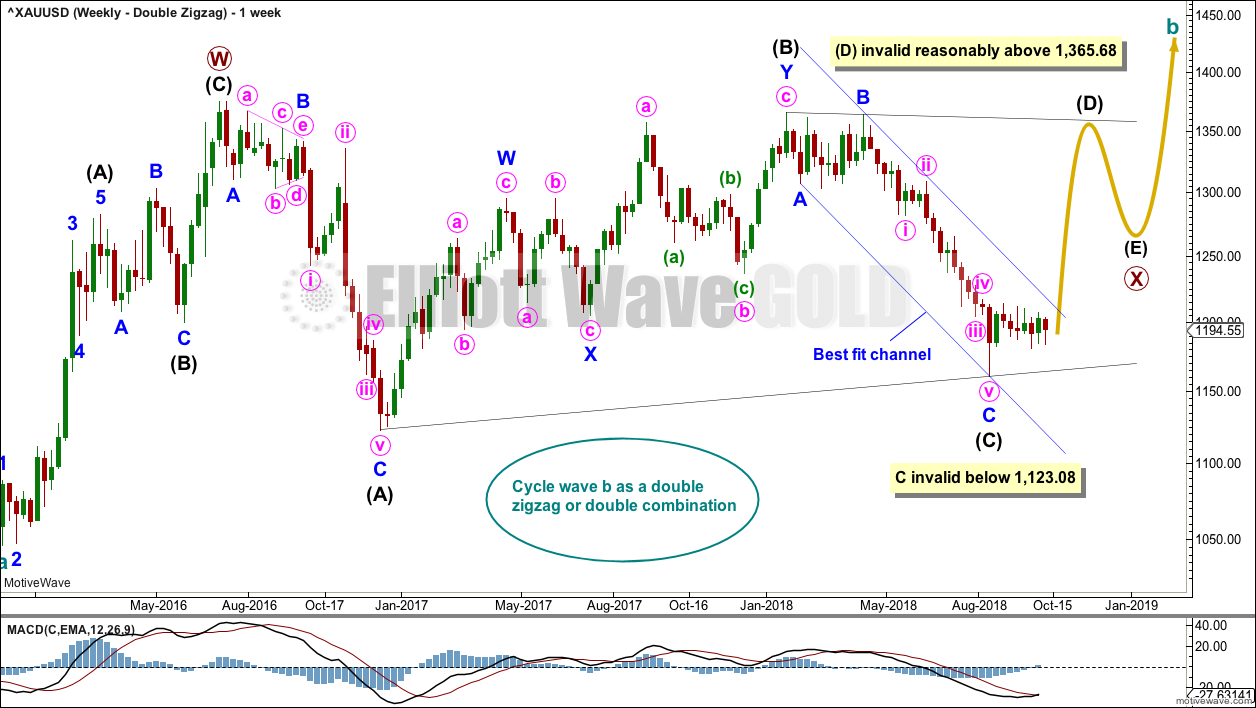
WEEKLY CHART – DOUBLE ZIGZAG
Click chart to enlarge.
Finally, it is also possible that cycle wave b may be a double zigzag or a double combination.
The first zigzag in the double is labelled primary wave W. This has a good fit.
The double may be joined by a corrective structure in the opposite direction, a triangle labelled primary wave X. The triangle would be about two thirds complete.
Within the triangle of primary wave X, intermediate wave (C) may now be complete. It may not move beyond the end of intermediate wave (A) below 1,123.08. The A-C trend line for both a barrier and contracting triangle should have some reasonable slope. For the triangle of primary wave X to have the right look, intermediate wave (C) should end here or very soon indeed.
This wave count may now expect choppy overlapping movement in an ever decreasing range for several more months.
Primary wave Y would most likely be a zigzag because primary wave X would be shallow; double zigzags normally have relatively shallow X waves.
Primary wave Y may also be a flat correction if cycle wave b is a double combination, but combinations normally have deep X waves. This would be less likely.
This wave count has good proportions and no problems in terms of subdivisions.
TECHNICAL ANALYSIS
WEEKLY CHART
Click chart to enlarge. Chart courtesy of StockCharts.com.
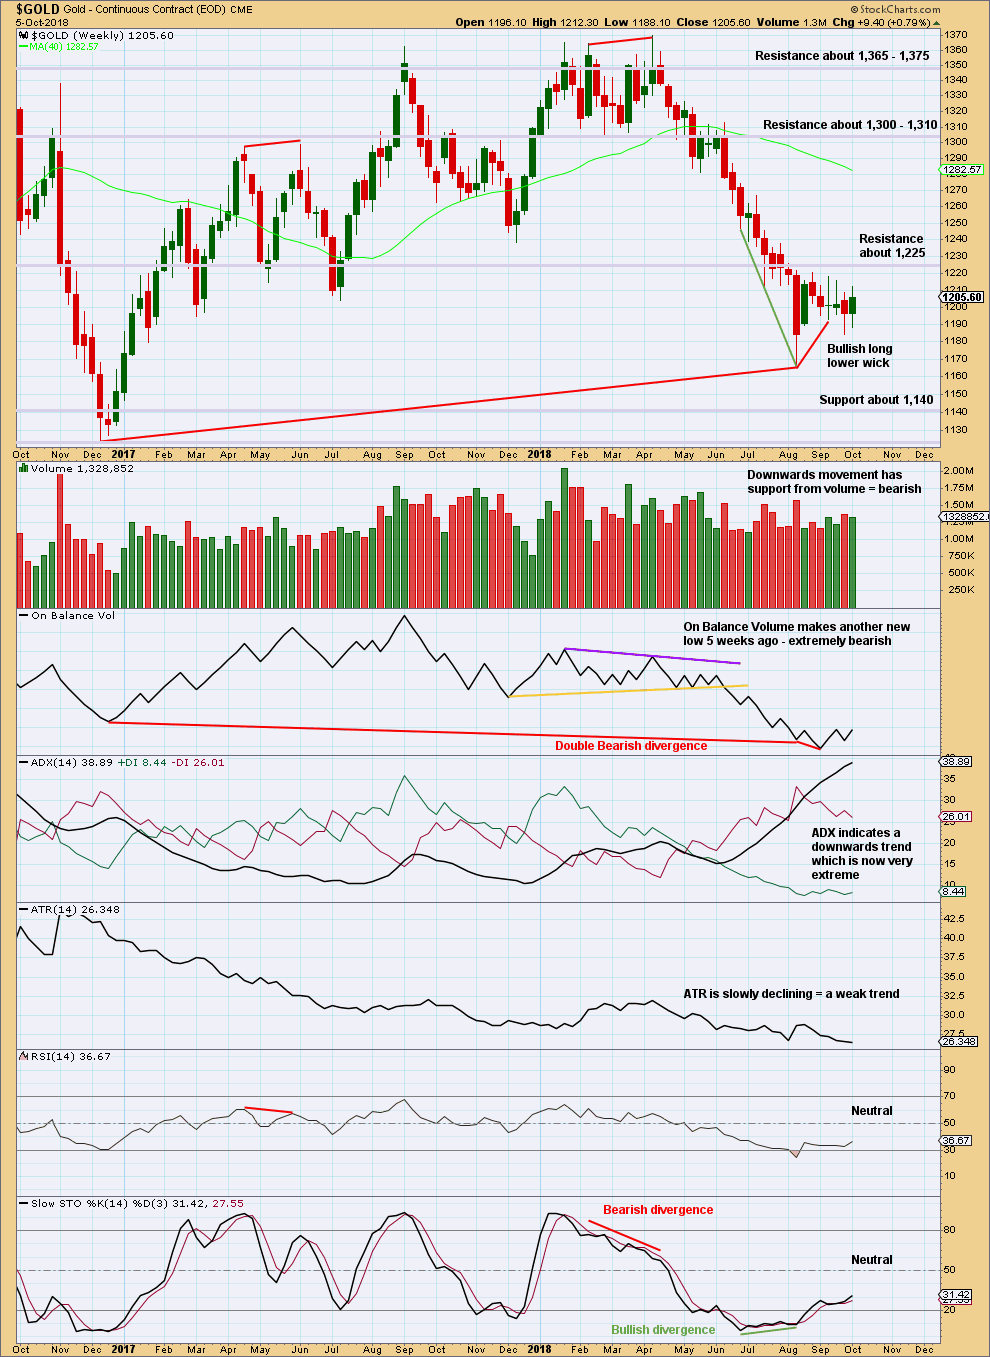
On Balance Volume is lower than its prior point at the end of November 2015. This divergence is extremely bearish but does not rule out a consolidation unfolding here; the divergence does strongly support the Triangle wave count, which expects a consolidation or bounce up to test resistance now and then a continuation of a major bear market. It could also support the flat wave count that allows for a new low below 1,046.27 in coming months.
On Balance Volume has made another new low, but price has not. There is now double bearish divergence between price and On Balance Volume.
The consolidation of the last seven weeks has brought RSI and Stochastics up from oversold, but ADX remains very extreme. If the downwards trend resumes here, then it may be limited by extreme indicators. The consolidation may continue further to relieve extreme ADX.
If price does continue lower, then look for next support about 1,140.
The short term volume profile remains bearish.
DAILY CHART
Click chart to enlarge. Chart courtesy of StockCharts.com.
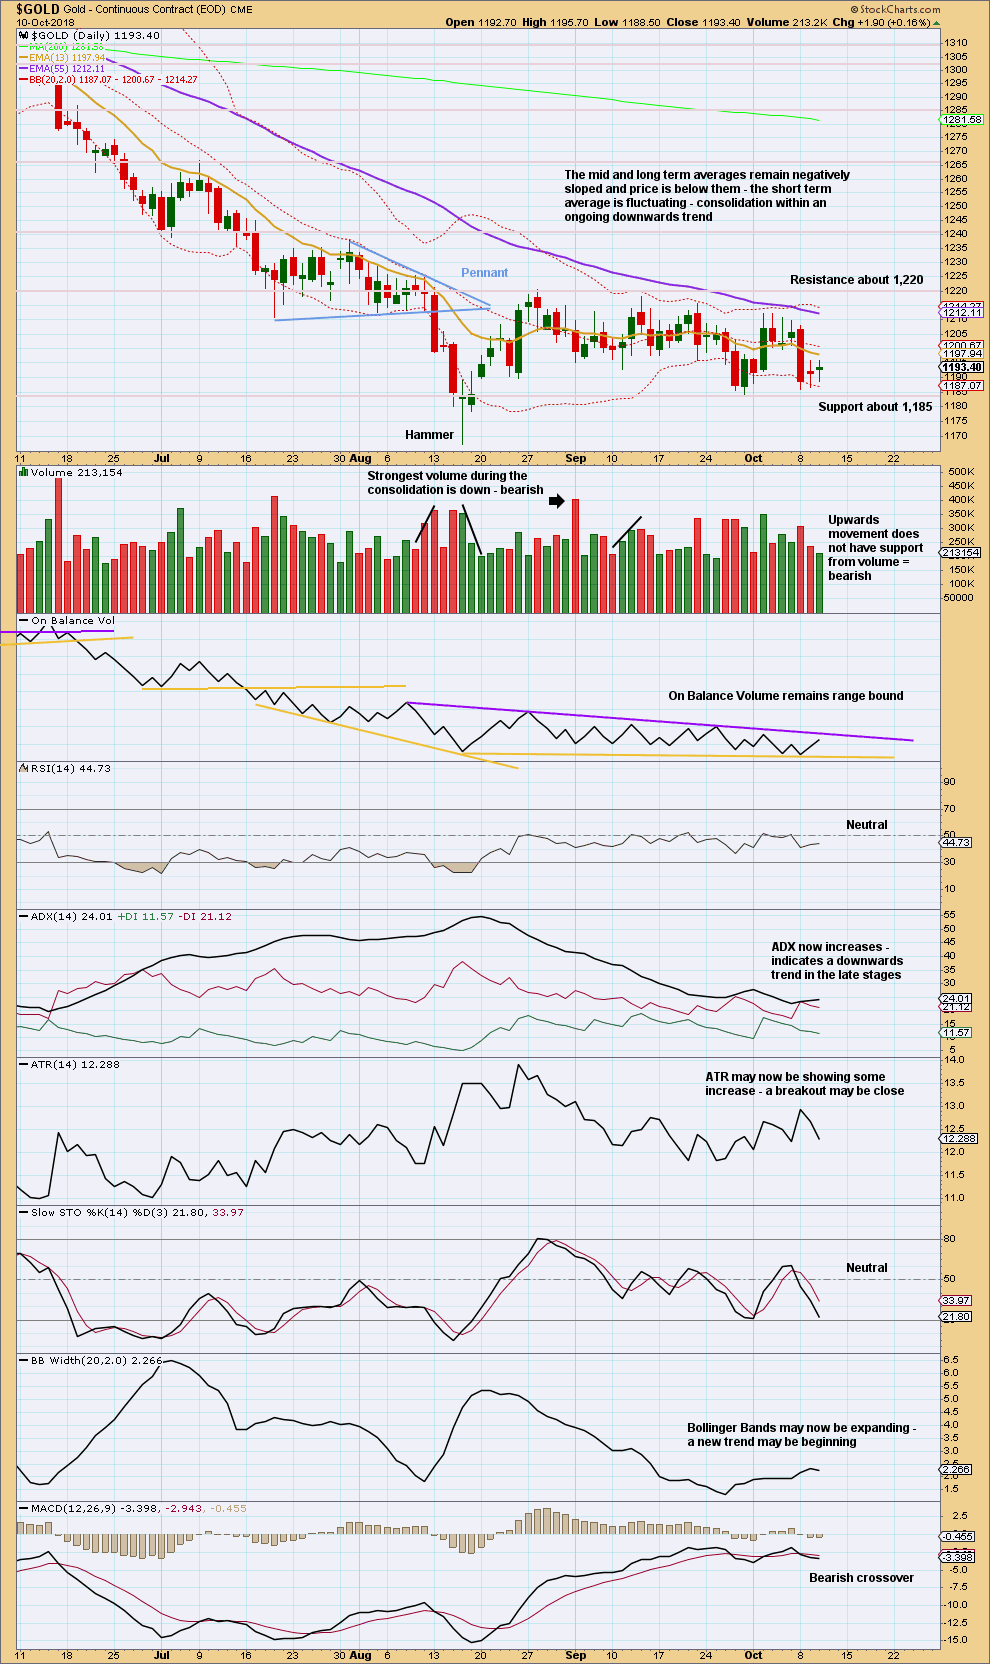
Price remains range bound with resistance about 1,220 and support about 1,885. The downwards day of the 4th of September still has the strongest volume during the consolidation, which still suggests a downwards breakout may be more likely than upwards. The short term volume profile remains bearish; upwards movement does not have support from volume.
However, downwards movement may be limited: ADX remains extreme (the ADX line remains above both directional lines).
The trend lines for On Balance Volume are converging, so it will breakout soon. If it breaks out prior to price, then it may indicate the breakout direction for price.
Another small range day today does not alter this analysis.
GDX WEEKLY CHART
Click chart to enlarge. Chart courtesy of StockCharts.com.
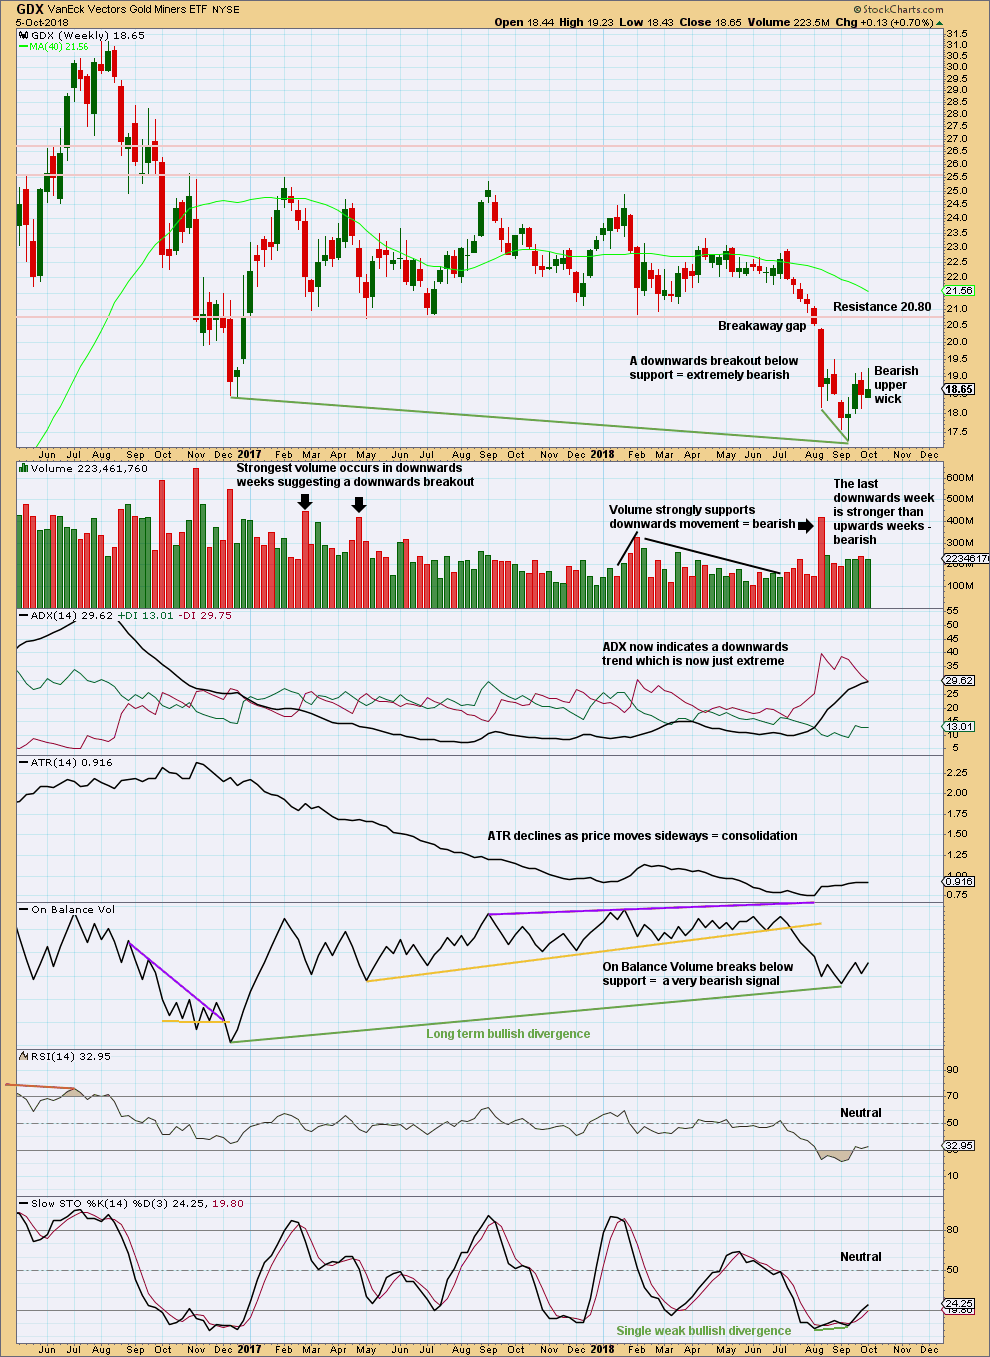
After a breakout, a technical principle is the longer that price consolidates sideways the longer the resulting trend may be expected to be. Also, the longer that price meanders sideways the more energy may be released after a breakout. This is what has happened for GDX.
A target for this downwards trend to end calculated using the measured rule is at 16.02. That is not yet met.
At the weekly chart level, there is a clear downwards breakout with a breakaway gap. As breakaway gaps should not be closed, they may be used to set stops that may be set just above a downwards breakaway gap.
The bullish divergence between price and On Balance Volume noted with green trend lines is also not a strong signal. On Balance Volume is a leading indicator; when it leads, it offers a signal, but it does not always lead price.
The consolidation may continue to relieve extreme conditions.
GDX DAILY CHART
Click chart to enlarge. Chart courtesy of StockCharts.com.
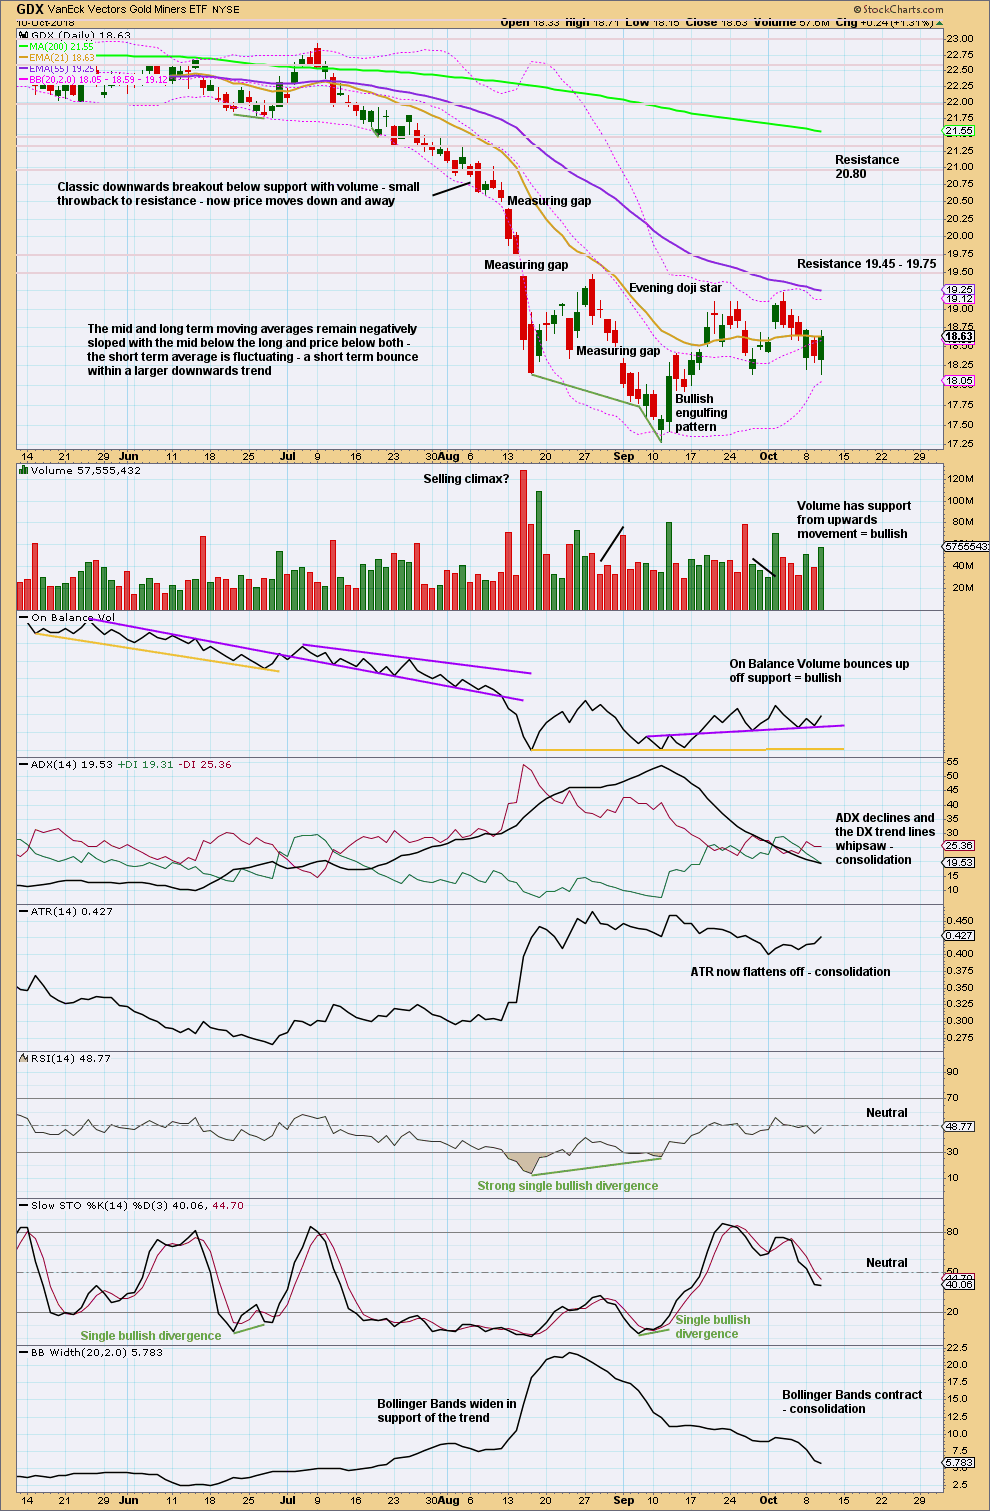
Price is consolidating after a strong downwards trend. Resistance is about 19.45 – 19.75. Support may be about 18.14; this consolidation may unfold within a very small range. Consolidations are characterised by very choppy overlapping movement.
Expect now to see price swing from resistance to support and back again, not moving in a straight line for each swing.
Look now for price to swing upwards towards resistance. The short term volume profile is bullish.
If resistance can be overcome about 19.75, then next stronger resistance is above at 20.80.
Published @ 06:52 p.m. EST.
—
Careful risk management protects your trading account(s).
Follow my two Golden Rules:
1. Always trade with stops.
2. Risk only 1-5% of equity on any one trade.
Spot prices for gold and silver are tanking.
Finally good to see some strength in this market.
For the next half hour, lets see if Gold can close above 1,220. If it can do that and has support from volume today, that would be a classic upwards breakout.
After upwards breakouts it’s common for price to curve down and back test support at prior resistance. Sometimes the back test can move slightly back into the consolidation zone before turning and moving up and away for a strong trend.
Support / resistance for a possible back test is about 1,220. If looking to enter long on the back test it’s important to set stops far away enough to allow the market room to move. That means reducing your position size so that you’re risking only 1-5% of your equity on the one trade.
This technique of entering after a breakout requires quite a lot of patience.
Also, as price is right now very close to 1,220 it would be possible to enter long here, and be prepared to hold an underwater position for a few days during a back test. It shouldn’t be for too long though.
But first, let us see where price can close and what volume tells us.
At this stage the EW triangle count is looking the best.
That technique of looking within a consolidation for the strongest volume days to indicate the breakout direction has now failed the last two consolidations for Gold. I’m wondering if that may be because Gold remains within a B wave, and they do have hugely varying price behaviour. They really are awful to analyse.
Anyway, we have a clearly upwards breakout today from the consolidation. I would now look for price to continue overall upwards to find resistance about 1,305 – 1,310. It may take weeks to get there.
Hourly chart updated:
Lara, how do you see this playing out, i.e targets and resistance? GDX as well ?
One more Q? How can I get email notification of new comments being posted to this forum? It that possible or do we have to look here on a continual basis? Thx
Your first questions will all be answered in today’s end of session analysis. I’ll post a quick updated chart in a moment also.
Cesar says your last question is a good one and he will look into it.
Thx
massive rally by gold price 1224+. unprecedented? expect a reversal to play out soon; hourly/4-hourly RSI is way overbought… lets see.
Lara any comments about this rally. Start of E?
I almost always am here prior to 4pm EST to post a comment and a chart.
It’s just done now.
What a beautiful day for gold and miners. They didn’t sell off yesterday was a hint of strong relative strengths. 🙂
Inverted H&S for miners neckline breakout today
Maybe wave VI 5-3 -5 off the low? If it reverses at 1230.
I’m meant Wave IV.