
Upwards movement has continued, which was allowed for in the main Elliott wave count.
Volume and candlestick analysis are used today to indicate the most likely short term Elliott wave count.
Summary: Upwards movement today has substantially weaker volume and a long upper candlestick wick, which suggests it may be a B wave. Some sideways movement may continue for another one to few days; it may reach as low as 1,210, but should not move below 1,207.78. Thereafter, upwards movement may resume towards a short term target about 1,246.
The final target for this bounce to end is at strong resistance about 1,305 – 1,310.
New updates to this analysis are in bold.
Grand SuperCycle analysis is here.
Last historic analysis with monthly charts is here.
There are four remaining weekly wave counts at this time for cycle wave b: a triangle, a flat, a combination, and a double zigzag.
At this stage, they will now be presented roughly in order of probability. The triangle and the double zigzag wave counts have about an even probability; the combination and flat wave counts now look less likely.
MAIN ELLIOTT WAVE COUNT
WEEKLY CHART – TRIANGLE
Click chart to enlarge.
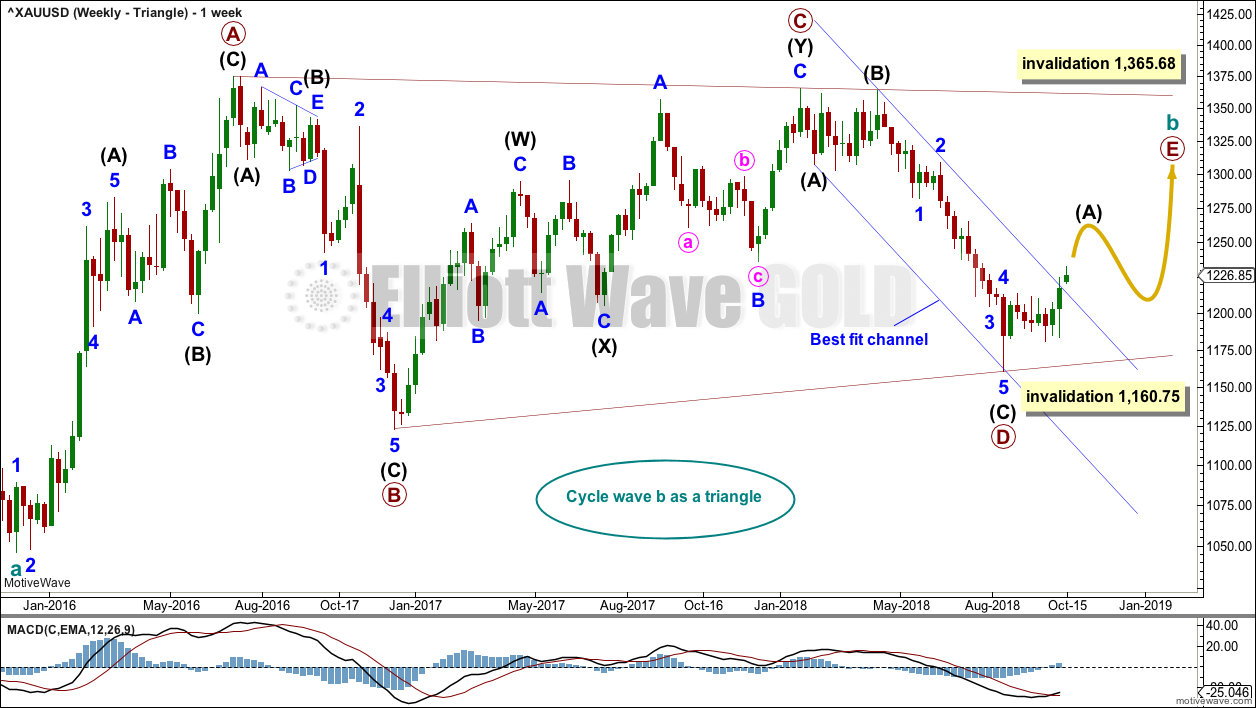
Cycle wave b may be an incomplete regular contracting triangle. Primary wave E may not move beyond the end of primary wave C above 1,365.68. Within primary wave E, intermediate wave B may not move beyond the start of intermediate wave A below 1,160.75.
Four of the five sub-waves of a triangle must be zigzags, with only one sub-wave allowed to be a multiple zigzag. Wave C is the most common sub-wave to subdivide as a multiple, and this is how primary wave C for this example fits best. Primary wave E would most likely be a single zigzag. It is also possible that it may subdivide as a triangle to create a rare nine wave triangle.
There are no problems in terms of subdivisions or rare structures for this wave count. It has an excellent fit and so far a typical look.
A channel is drawn on all charts about the downwards wave of primary wave D. Here, it is labelled a best fit channel. This channel is now fully breached with a full daily candlestick above and not touching it, providing reasonable confidence in this weekly triangle wave count and the double zigzag count, and putting doubt on the combination and flat wave counts.
Primary wave E may now continue higher as a large three wave structure.
DAILY CHART – TRIANGLE
Click chart to enlarge.
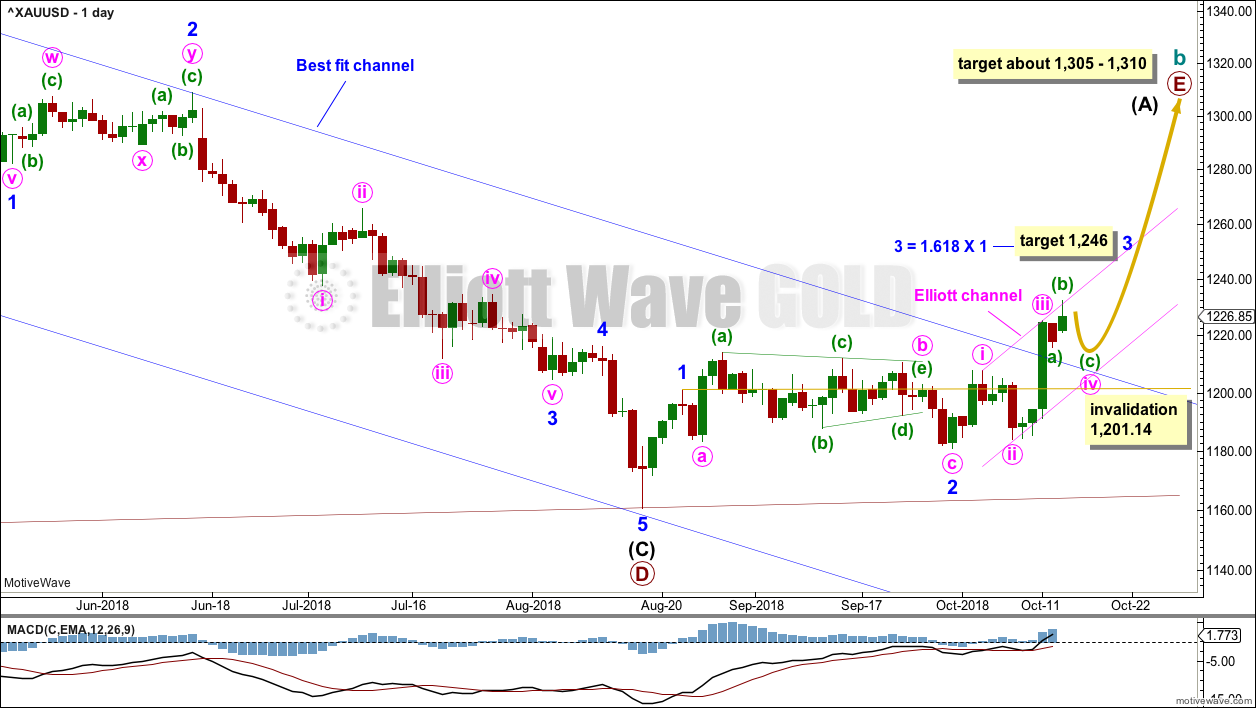
Primary wave D may be complete.
Minor wave 1 may have been over on the 22nd of August.
Minor wave 2 may be a complete expanded flat correction.
Minor wave 3 may only subdivide as an impulse. So far that would be incomplete. A target is calculated for minor wave 3 to end using the most common Fibonacci ratio to minor wave 1. The next target would be about 1,287 where minor wave 3 would reach 2.618 the length of minor wave 1.
Draw an Elliott channel about minor wave 3. Draw the first trend line from the ends of minute waves i to iii, then place a parallel copy on the low of minute wave ii. Minute wave v may end about the upper edge of this channel. If minute wave v exhibits typical commodity like behaviour, then it may be very strong and may end with a strong overshoot of the i-iii trend line.
A target for primary wave E is the strong zone of resistance about 1,305 to 1,310. Primary wave E is most likely to subdivide as a zigzag (although it may also subdivide as a triangle to create a rare nine wave triangle), and it should last at least a Fibonacci 13 weeks. It may also last a total Fibonacci 21 or 34 weeks. So far it has lasted only 8 weeks. Primary wave E may not move beyond the end of primary wave C above 1,365.68.
HOURLY CHART – TRIANGLE
Click chart to enlarge.
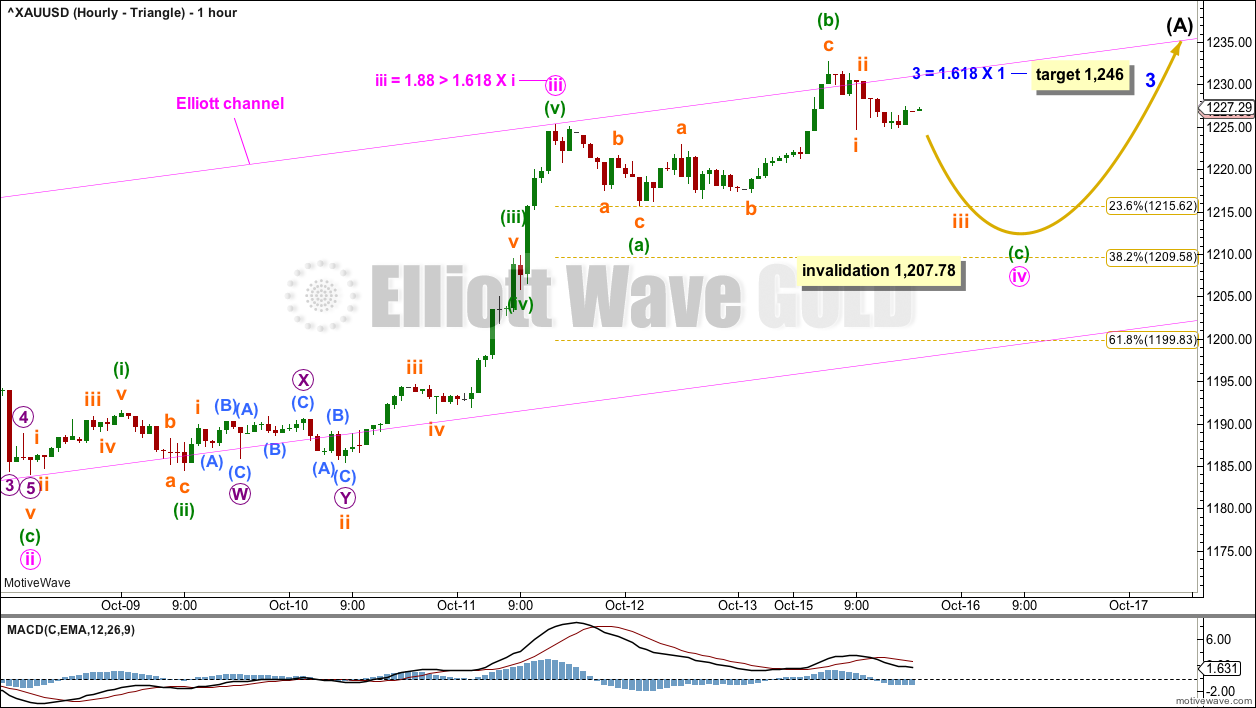
Minor wave 3 may only subdivide as an impulse.
Within the impulse, minute waves i, ii and now iii may be complete.
Minute wave ii was a very deep 0.89 zigzag. Minute wave iv may last about one to a very few days and exhibit alternation as a shallow flat, triangle or combination. All of a flat, triangle or combination begin with a three wave structure for minuette wave (a) or (w), and so far this is how it fits best.
Minute wave iv may be unfolding as an expanded flat or running triangle. Within minute wave iv, minuette wave (b) is now a 1.77 length of minuette wave (a), which is longer than the most common range of up to 1.38 but still within allowable guidelines of up to 2. Upwards movement today exhibits reasonably weaker volume and the candlestick has a long upper wick; this looks weak enough to be considered as a B wave.
If minute wave iv continues as an expanded flat, then minuette wave (c) should move below the end of minuette wave (a) at 1,215.80 to avoid a truncation and a very rare running flat. Minute wave iv may end close to the 0.382 Fibonacci ratio.
If minute wave iv continues as a running triangle, then minuette wave (c) may not move beyond the end of minuette wave (a) below 1,215.80. A triangle would expect sideways movement in an ever decreasing range for a few days.
Minute wave iv may also continue sideways as a combination. If this structure shows itself to be true, then minute wave iv would be relabelled. Combinations are sideways movements; price would be expected to continue to find support about 1,215.
Minute wave iv may not move into minute wave i price territory below 1,207.78.
Gold has a tendency, typical of commodities, to exhibit very swift and strong fifth waves. This tendency is especially prevalent for fifth waves to end third wave impulses. Look out for the possibility of minute wave v to end minor wave 3 to be very swift and strong; it may end with another blowoff top.
WEEKLY CHART – DOUBLE ZIGZAG
Click chart to enlarge.
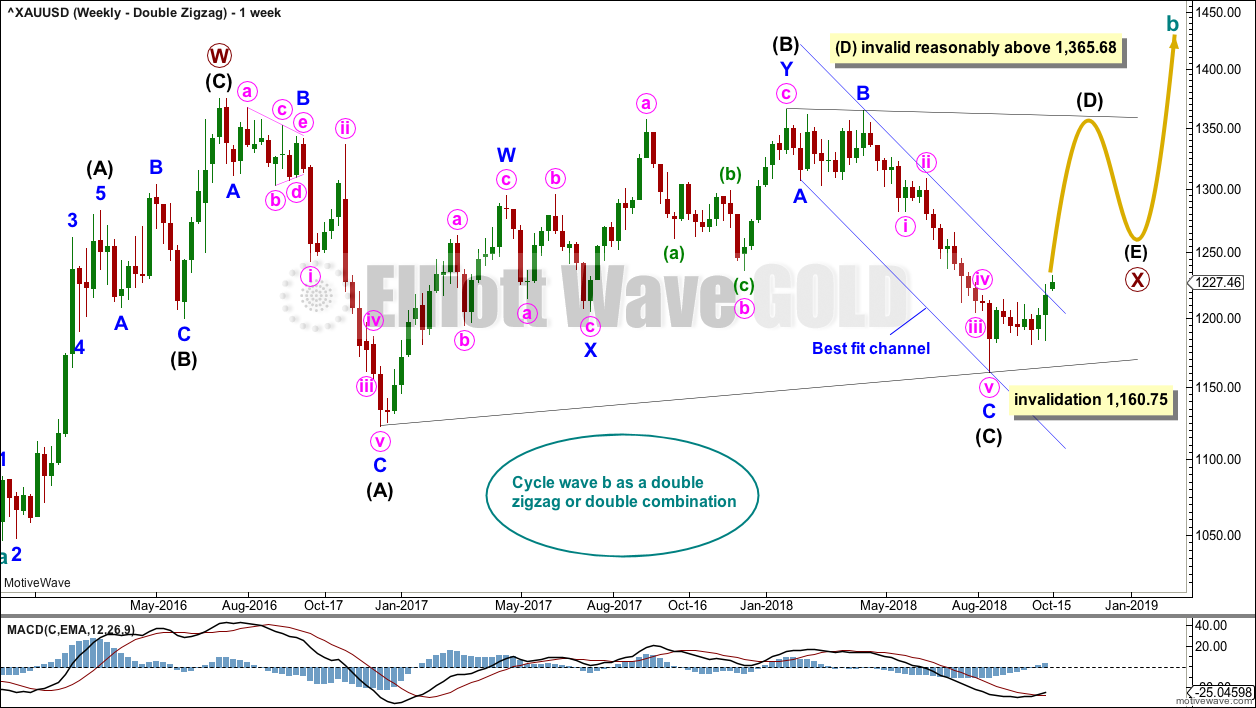
It is also possible that cycle wave b may be a double zigzag or a double combination.
The first zigzag in the double is labelled primary wave W. This has a good fit.
The double may be joined by a corrective structure in the opposite direction, a triangle labelled primary wave X. The triangle would be about three quarters complete.
Within the triangle of primary wave X, intermediate wave (C) should be complete. Within intermediate wave (D), minor wave B may not move beyond the start of minor wave A below 1,160.75.
Intermediate wave (D) would most likely subdivide as a single zigzag. The subdivisions at the daily and hourly chart level for this wave count would be the same as for the first triangle wave count above; a zigzag unfolding higher would be labelled A-B-C.
This wave count may now expect choppy overlapping movement in an ever decreasing range for several more months.
Primary wave Y would most likely be a zigzag because primary wave X would be shallow; double zigzags normally have relatively shallow X waves.
Primary wave Y may also be a flat correction if cycle wave b is a double combination, but combinations normally have deep X waves. This would be less likely.
This wave count has good proportions and no problems in terms of subdivisions.
WEEKLY CHART – COMBINATION
Click chart to enlarge.
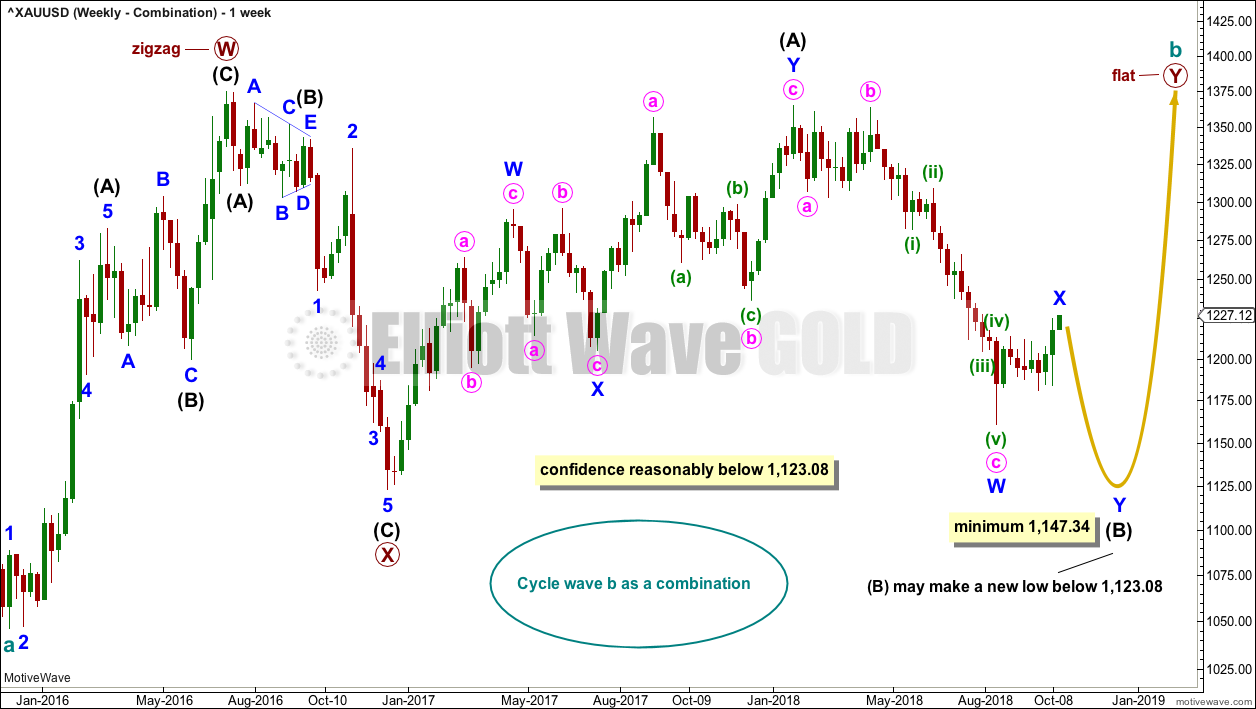
If cycle wave b is a combination, then the first structure in a double may be a complete zigzag labelled primary wave W.
The double may be joined by a three in the opposite direction, a zigzag labelled primary wave X.
The second structure in the double may be a flat correction labelled primary wave Y. My research on Gold so far has found that the most common two structures in a double combination are one zigzag and one flat correction. I have found only one instance where a triangle unfolded for wave Y. The most likely structure for wave Y would be a flat correction by a very wide margin, so that is what this wave count shall expect.
Within a flat correction for primary wave Y, the current downwards wave of intermediate wave (B) may be a double zigzag. Intermediate wave (B) must retrace a minimum 0.9 length of intermediate wave (A) at 1,147.34. Intermediate wave (B) may move beyond the start of intermediate wave (A) as in an expanded flat.
Because the minimum requirement for intermediate wave (B) is not yet met, this wave count requires that intermediate wave (B) continues lower. This is the most immediately bearish of all four weekly wave counts.
When intermediate wave (B) is complete, then intermediate wave (C) would be expected to make at least a slight new high above the end of intermediate wave (A) at 1,365.68 to avoid a truncation. Primary wave Y would be most likely to end about the same level as primary wave W at 1,374.91, so that the whole structure takes up time and moves price sideways, as that is the purpose of double combinations.
While double combinations are very common, triples are extremely rare. I have found no examples of triple combinations for Gold at daily chart time frames or higher back to 1976. When the second structure in a double is complete, then it is extremely likely (almost certain) that the whole correction is over.
DAILY CHART – COMBINATION
Click chart to enlarge.
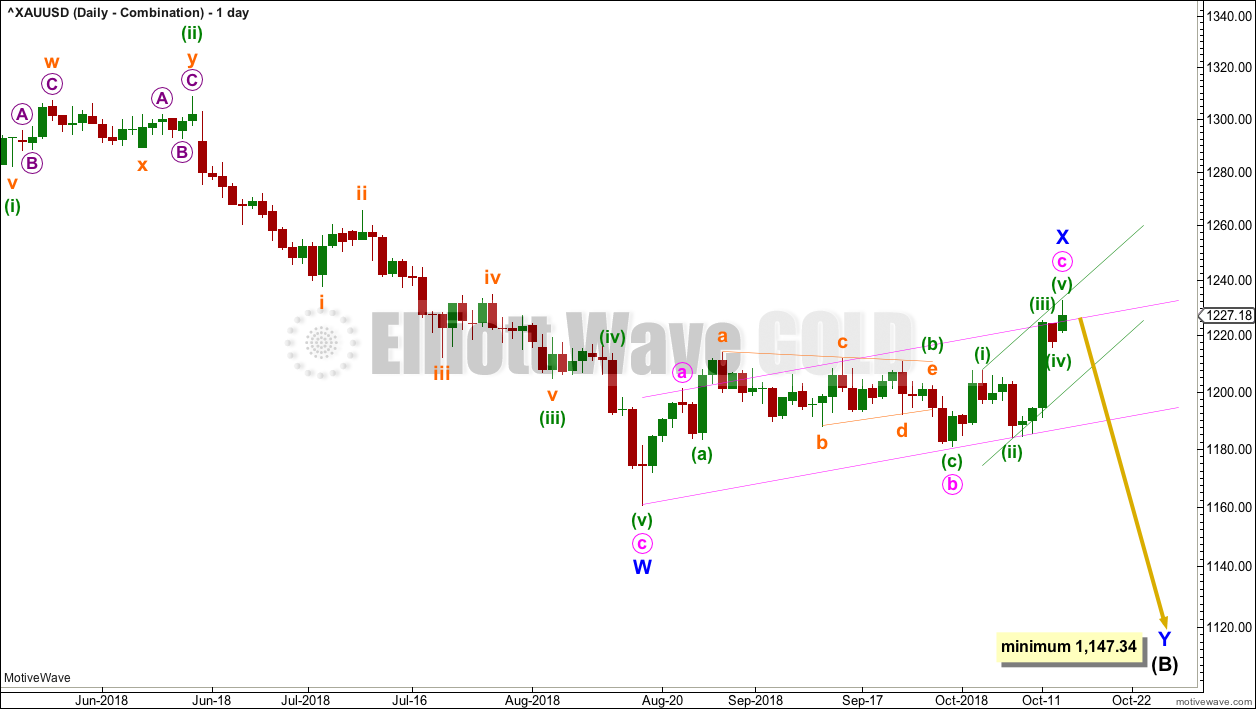
Intermediate wave (B) may be unfolding lower as a double zigzag.
The first zigzag may be complete, labeled minor wave W. The double may now be joined by an incomplete three in the opposite direction, a zigzag labelled minor wave X. X waves within double zigzags are usually fairly shallow and often also reasonably brief. Minor wave X may end fairly soon.
This wave count now expects that the upwards breakout may turn out to be false.
HOURLY CHART
Click chart to enlarge.
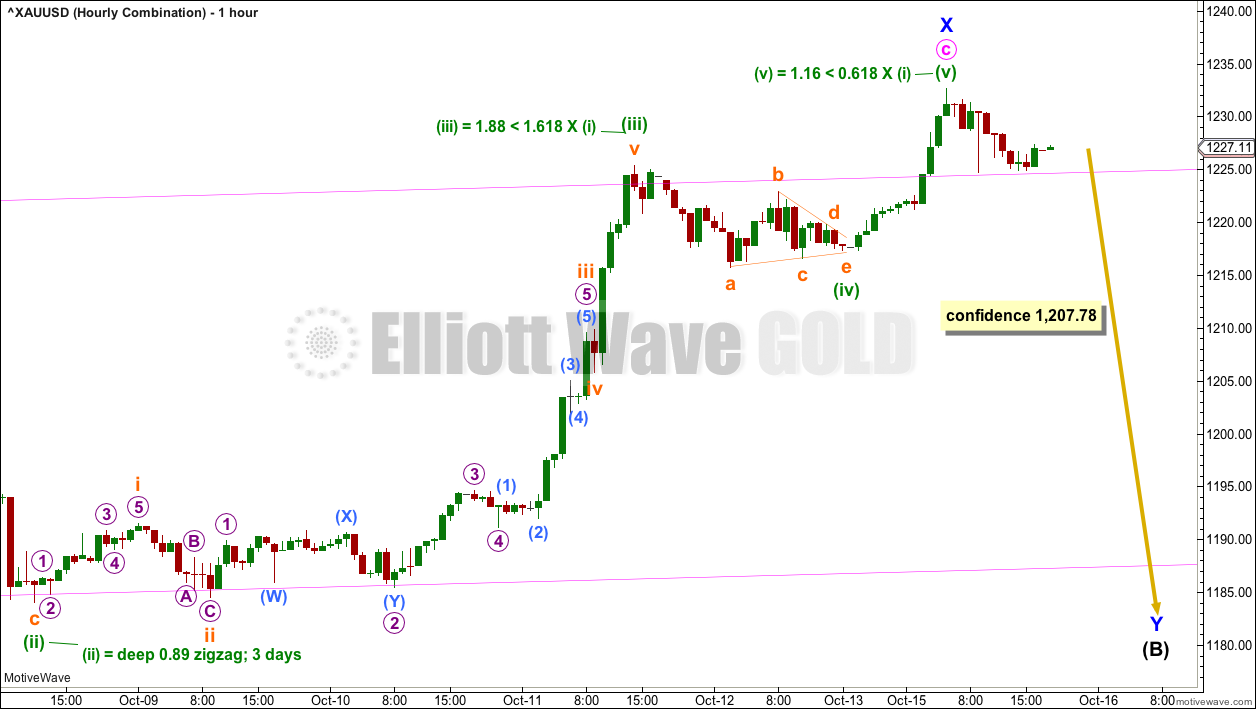
Minor wave X must complete as a zigzag. Within the zigzag, minute wave c may now be a complete impulse.
This wave count would now expect a new downwards wave to new lows, at least below 1,147.34. This new downwards wave may last from about two to a few weeks.
WEEKLY CHART – FLAT
Click chart to enlarge.
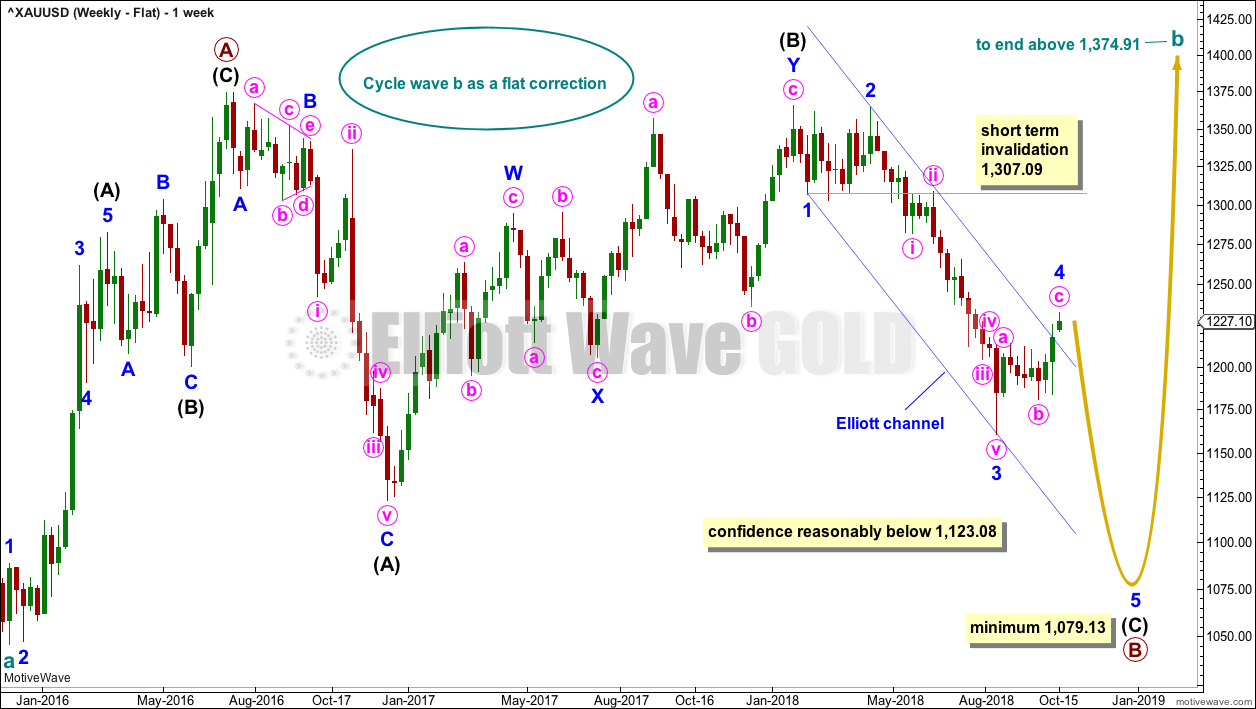
It is possible that cycle wave b may be a flat correction. Within a flat correction, primary wave B must retrace a minimum 0.9 length of primary wave A at 1,079.13 or below. Primary wave B may make a new low below the start of primary wave A at 1,046.27 as in an expanded flat correction.
Only a new low reasonably below 1,123.08 would provide reasonable confidence in this wave count.
Intermediate wave (C) must subdivide as a five wave structure; it may be unfolding as an impulse. Within intermediate wave (C), minor waves 1 through to 4 may be complete. If it continues further, then minor wave 4 may not move into minor wave 1 price territory above 1,307.09.
The blue channel here is drawn using Elliott’s first technique. Minor wave 4 would be most likely to remain contained within this channel, and may find resistance about the upper edge if it gets there. A strong breach of this channel by upwards movement would reduce the probability of this wave count.
Minor wave 2 was a double zigzag lasting nine weeks. Minor wave 4 exhibits little alternation as a single zigzag and reasonable proportion lasting eight weeks so far.
TECHNICAL ANALYSIS
WEEKLY CHART
Click chart to enlarge. Chart courtesy of StockCharts.com.
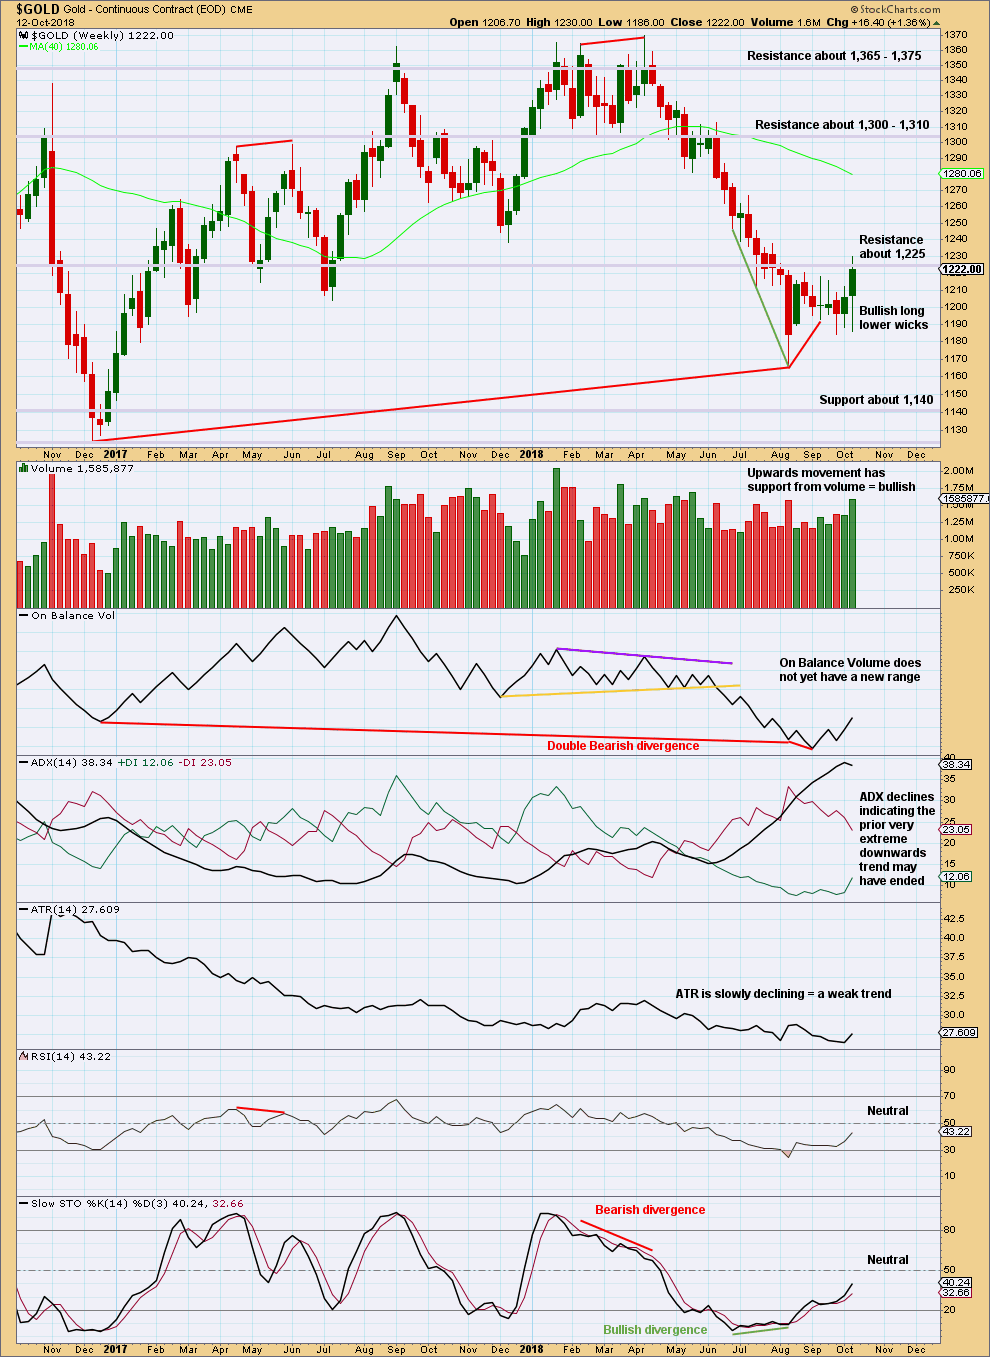
On Balance Volume is lower than its prior point at the end of November 2015. This divergence is extremely bearish but does not rule out a consolidation unfolding here; the divergence does strongly support the Triangle wave count, which expects a consolidation or bounce up to test resistance now and then a continuation of a major bear market. It could also support the flat wave count that allows for a new low below 1,046.27 in coming months.
On Balance Volume has made another new low, but price has not. There is now double bearish divergence between price and On Balance Volume.
The short term volume profile is now bullish. With a bullish long lower wick on the last weekly candlestick, it looks like this week may see price continue higher.
DAILY CHART
Click chart to enlarge. Chart courtesy of StockCharts.com.
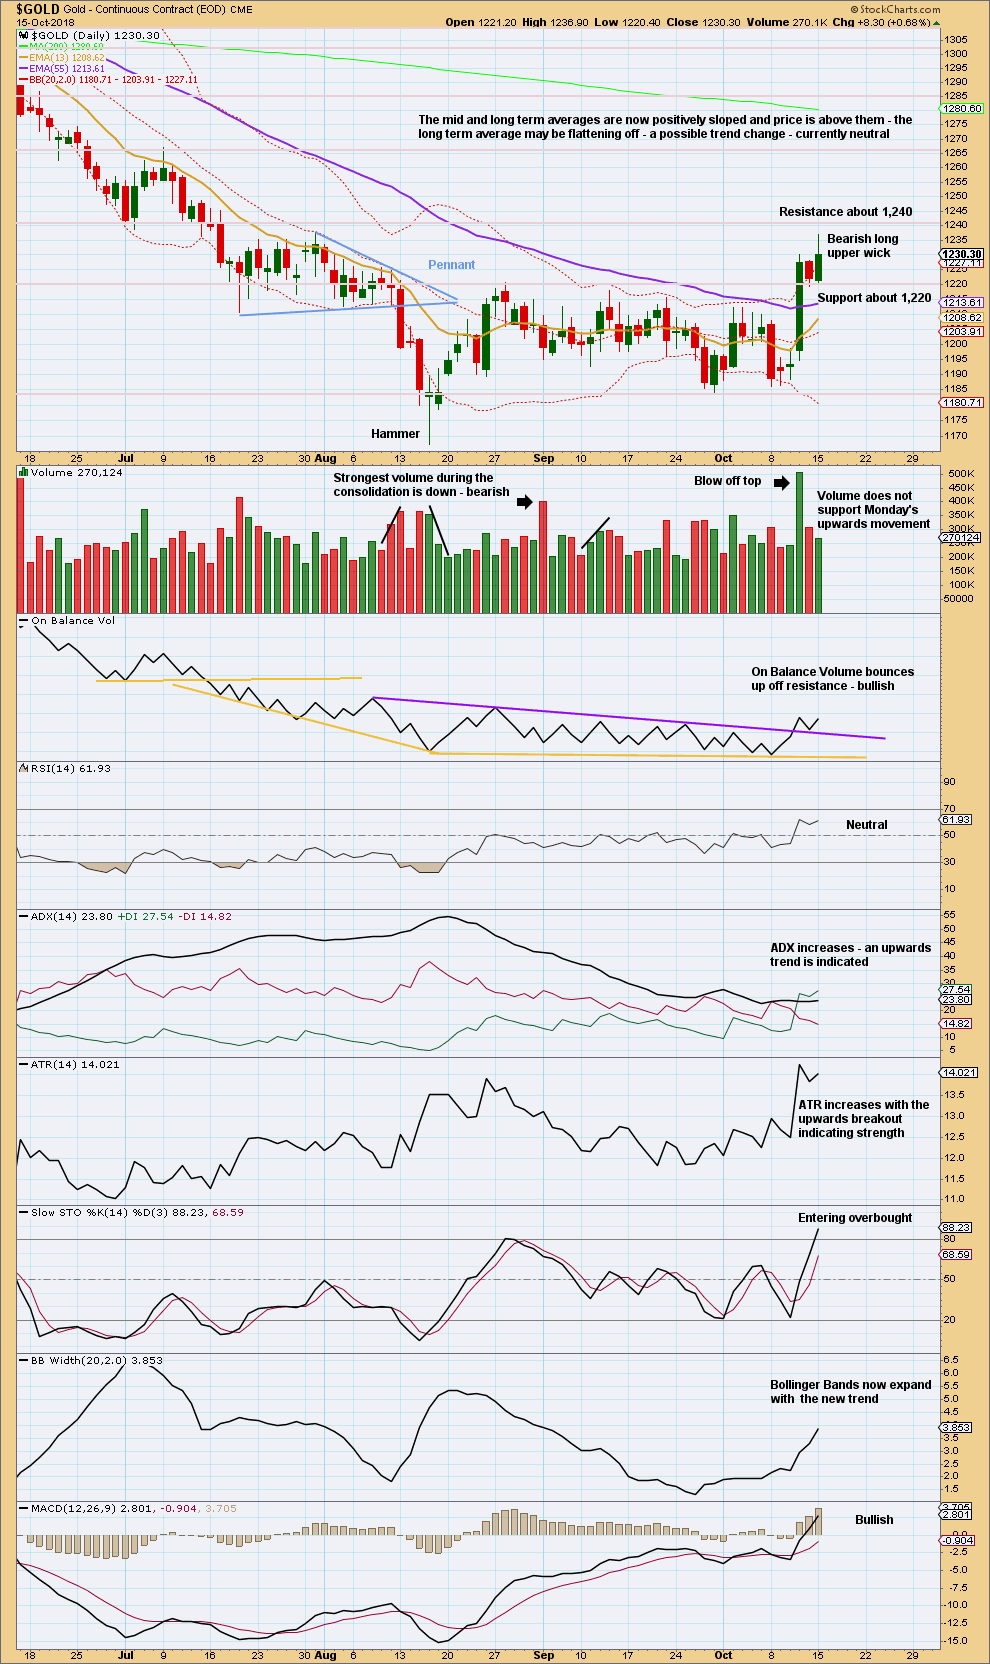
With strong support from volume, Thursday completes an upwards breakout above resistance at 1,220. Support is now tested on Friday. It would be typical now to see price move up and away.
The long upper wick and lack of support for upwards movement today indicates weakness in upwards movement. The test of support may be incomplete.
There is resistance above about 1,240.
The bullish signal from On Balance Volume is strong: the trend line breached was long held and tested multiple times, and it has a shallow slope. This adds confidence in an upwards breakout.
GDX WEEKLY CHART
Click chart to enlarge. Chart courtesy of StockCharts.com.
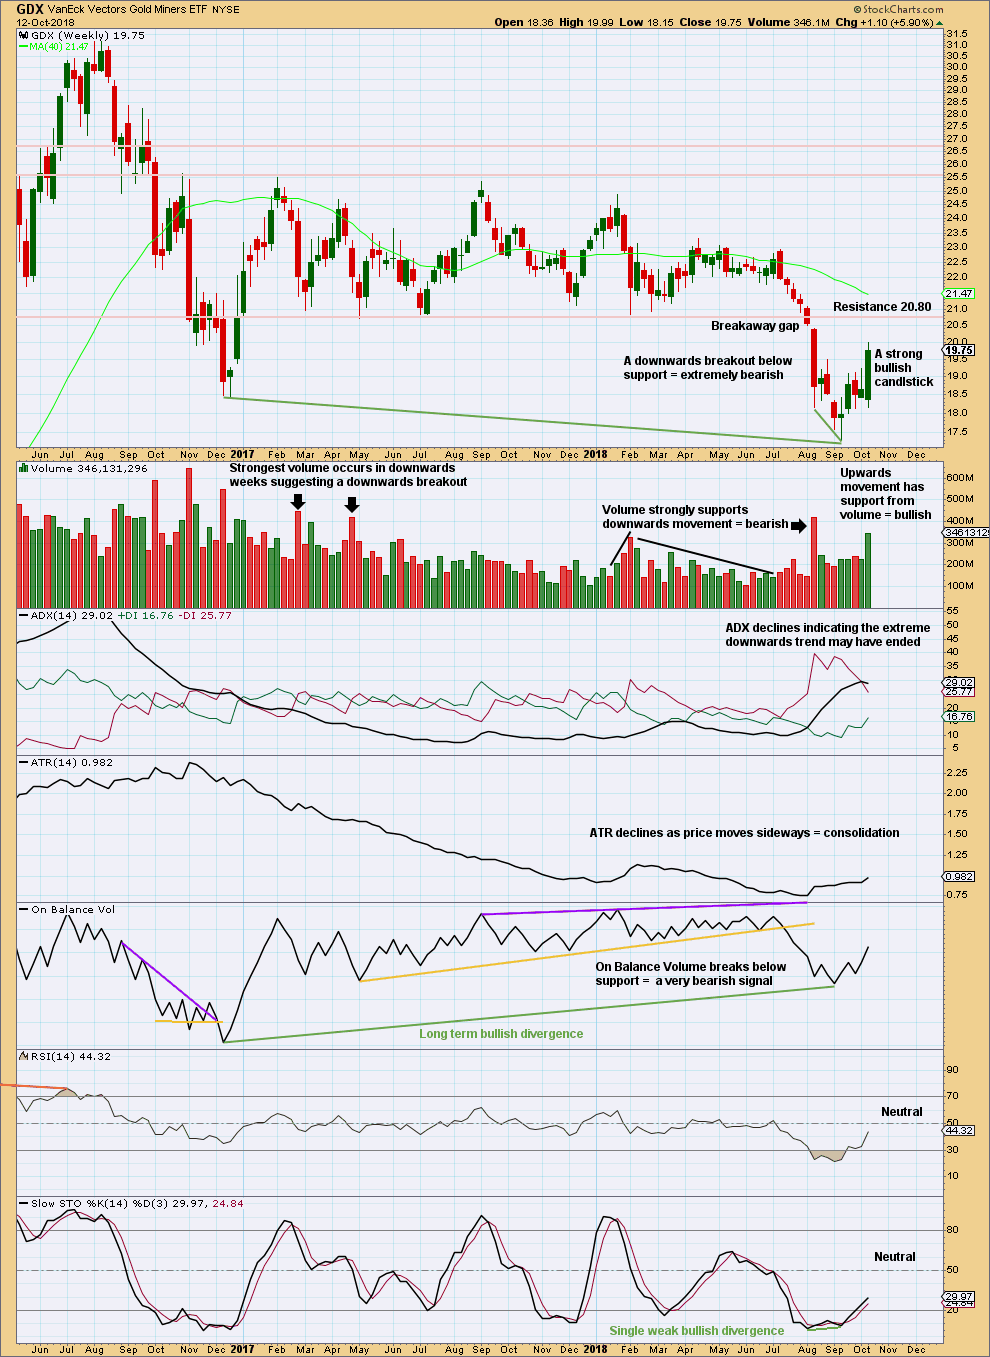
After a breakout, a technical principle is the longer that price consolidates sideways the longer the resulting trend may be expected to be. Also, the longer that price meanders sideways the more energy may be released after a breakout. This is what has happened for GDX.
A target for this downwards trend to end calculated using the measured rule is at 16.02. That is not yet met.
At the weekly chart level, there is a clear downwards breakout with a breakaway gap. As breakaway gaps should not be closed, they may be used to set stops that may be set just above a downwards breakaway gap. The upper edge of the gap is at 20.51.
It looks like upwards movement of the last week may now continue to back test resistance at prior support. When price behaves like this after a clear breakout from a long held consolidation, it offers a low risk high reward entry opportunity to join a new trend. If price does get up close to 20.80, then it may turn there and move strongly lower.
GDX DAILY CHART
Click chart to enlarge. Chart courtesy of StockCharts.com.
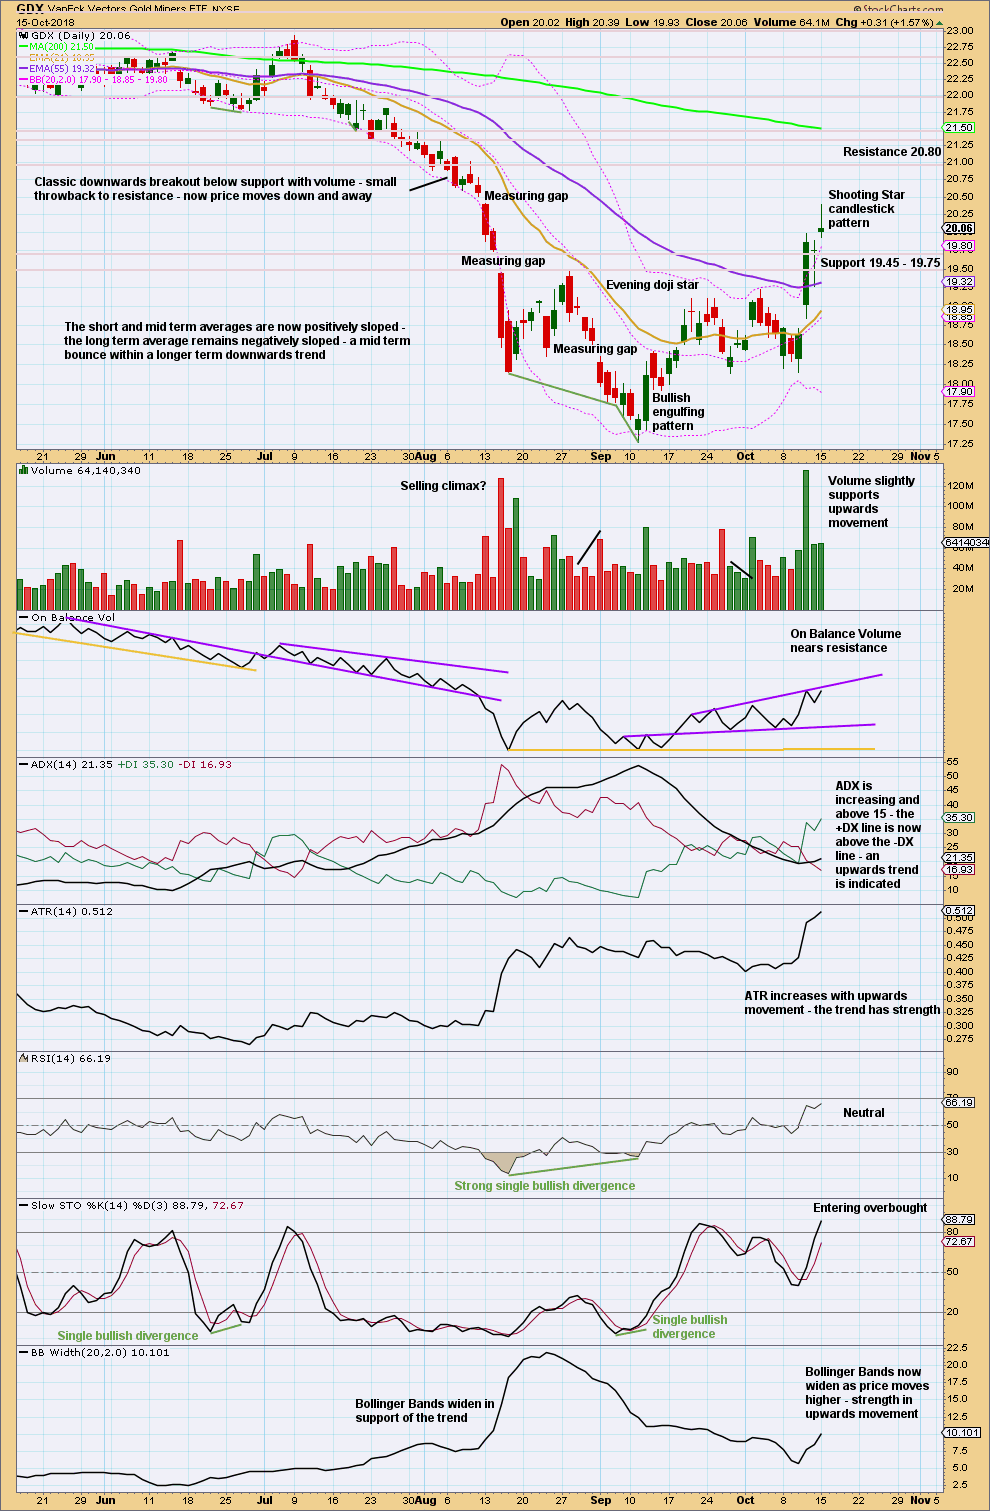
It now looks like GDX may be curving back up to test very strong resistance about 20.80. If it does get up to this point, then that may offer a very good entry point for a short position which may be held for a reasonably long term.
For the short term, it looks like a downwards day may result tomorrow; the Shooting Star pattern and resistance on On Balance Volume suggest upwards movement here may halt.
Published @ 07:40 p.m. EST.
—
Careful risk management protects your trading account(s).
Follow my two Golden Rules:
1. Always trade with stops.
2. Risk only 1-5% of equity on any one trade.
Hourly triangle wave count updated:
Minute c may take a few more days to move slowly lower. If this wave count is correct.