
For the mid term, volume and On Balance Volume this week give an important signal. For the short term, Friday’s candlestick gives a contradictory signal. The main Elliott wave count remains the same.
Summary: Another multi week consolidation may have begun, which may end about 1,217 and may not move below 1,201.14.
For the short term, next week may see a small downwards swing to support. The short term target is about 1,220.
Resistance is about 1,240 and support is about 1,220.
The final target for this bounce to end is at strong resistance about 1,305 – 1,310.
New updates to this analysis are in bold.
Grand SuperCycle analysis is here.
Last historic analysis with monthly charts is here.
There are four remaining weekly wave counts at this time for cycle wave b: a triangle, a flat, a combination, and a double zigzag.
At this stage, they will now be presented roughly in order of probability. The triangle and the double zigzag wave counts have about an even probability; the combination and flat wave counts now look less likely.
MAIN ELLIOTT WAVE COUNT
WEEKLY CHART – TRIANGLE
Click chart to enlarge.
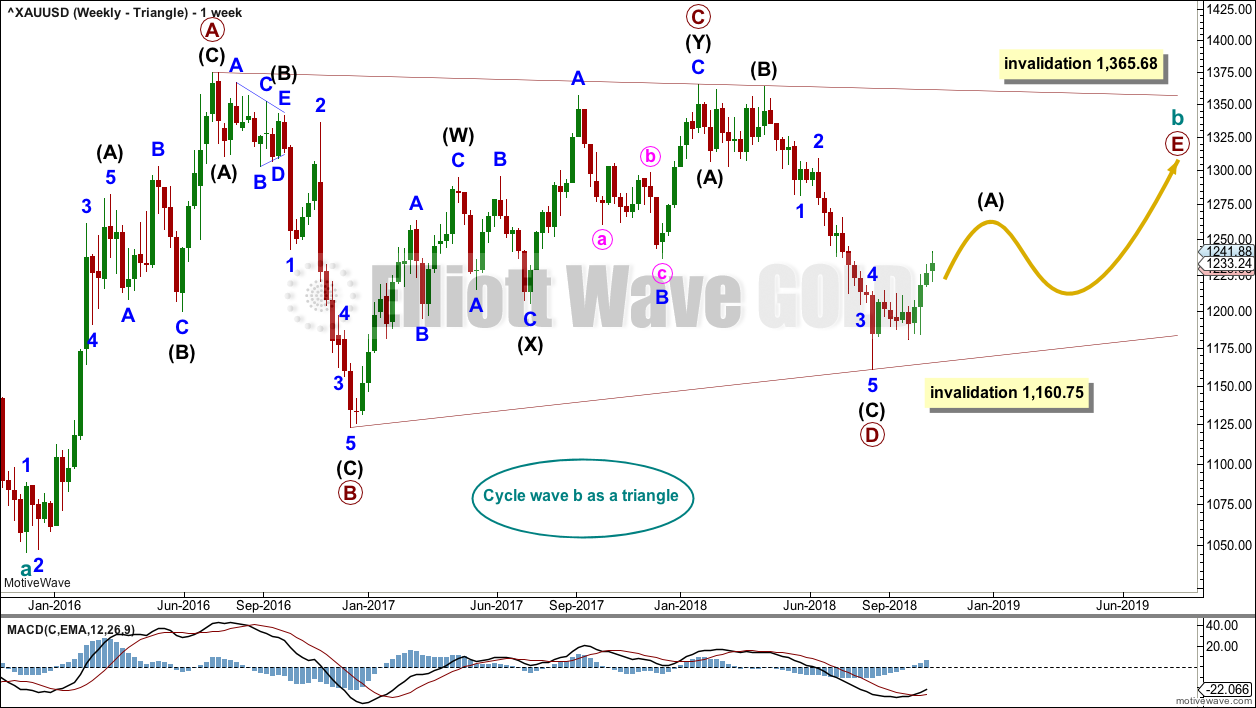
Cycle wave b may be an incomplete regular contracting triangle. Primary wave E may not move beyond the end of primary wave C above 1,365.68. Within primary wave E, intermediate wave B may not move beyond the start of intermediate wave A below 1,160.75.
Four of the five sub-waves of a triangle must be zigzags, with only one sub-wave allowed to be a multiple zigzag. Wave C is the most common sub-wave to subdivide as a multiple, and this is how primary wave C for this example fits best. Primary wave E would most likely be a single zigzag. It is also possible that it may subdivide as a triangle to create a rare nine wave triangle.
There are no problems in terms of subdivisions or rare structures for this wave count. It has an excellent fit and so far a typical look.
Primary wave E may now continue higher as a large three wave structure.
DAILY CHART – TRIANGLE
Click chart to enlarge.
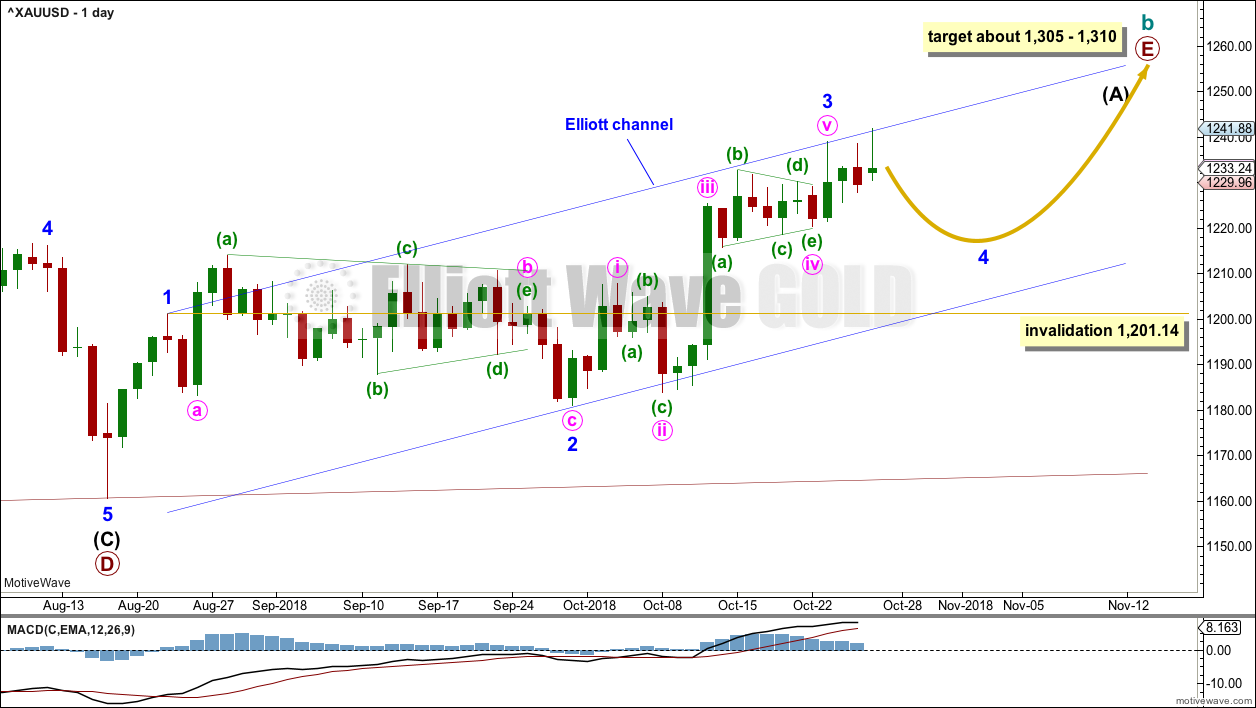
Primary wave E should now be underway for this wave count.
Primary wave E should subdivide as a zigzag. Intermediate wave (A) should subdivide as a five wave structure.
Within intermediate wave (A), so far minor waves 1 through to 3 may now be complete. Minor wave 3 exhibits no Fibonacci ratio to minor wave 1. Minor wave 2 was a relatively shallow 0.497 flat correction. Minor wave 4 may exhibit alternation as a deeper zigzag, or it may also be a more shallow sideways combination or triangle.
Minor wave 4 may not move into minor wave 1 price territory below 1,201.14.
Minor wave 2 lasted 27 sessions. Minor wave 4 may exhibit reasonable proportion to minor wave 2; it may last about a Fibonacci 21 or 34 sessions. If minor wave 4 unfolds as a zigzag, then it may be quicker, possibly lasting about a Fibonacci 13 sessions.
Draw the channel about intermediate wave (A) using Elliott’s first technique. Draw the first trend line from the ends of minor waves 1 to 3, then place a parallel copy on the end of minor wave 2. If it is time consuming enough, then minor wave 4 may find support about the lower edge of this channel. Upwards movement for Friday found strong resistance about the upper edge of this channel.
A target for primary wave E is the strong zone of resistance about 1,305 to 1,310. Primary wave E is most likely to subdivide as a zigzag (although it may also subdivide as a triangle to create a rare nine wave triangle), and it should last at least a Fibonacci 13 weeks. It may also last a total Fibonacci 21 or 34 weeks. So far it has lasted only 8 weeks. Primary wave E may not move beyond the end of primary wave C above 1,365.68.
HOURLY CHART – TRIANGLE
Click chart to enlarge.
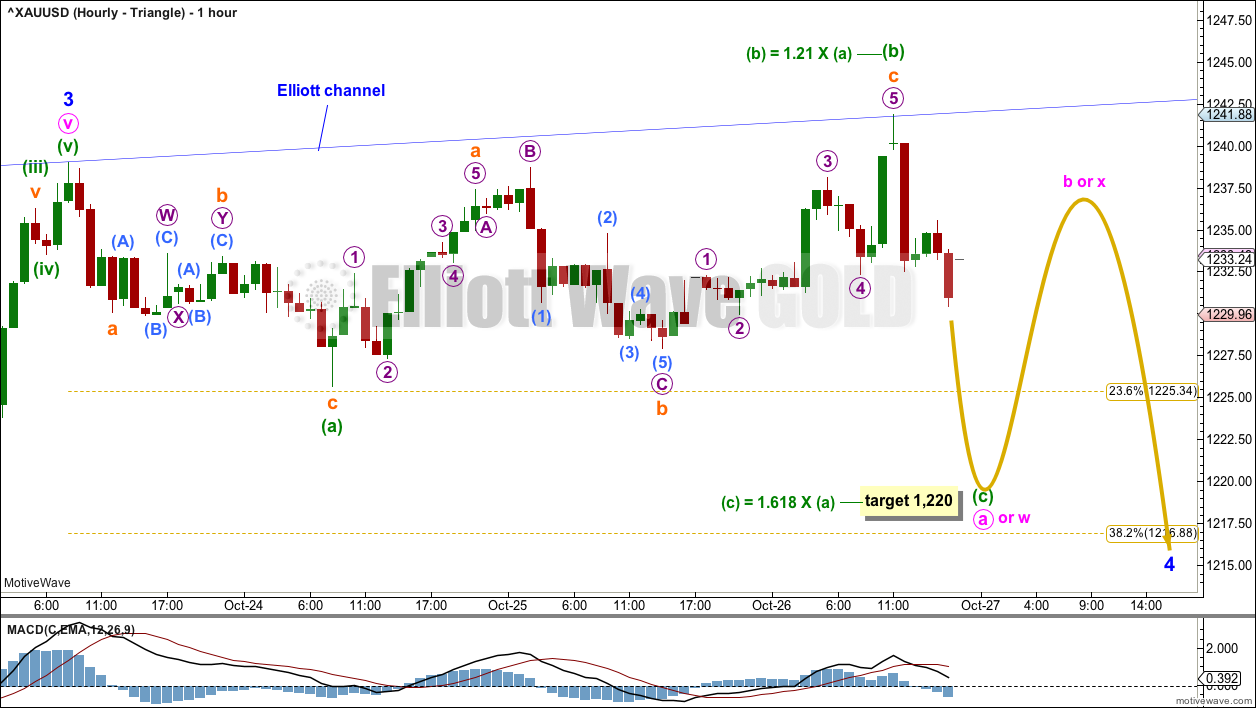
Minor wave 4 may be beginning with a three wave structure, a flat correction. This flat correction may be labelled as either minute wave a or minute wave w.
If minute wave a subdivides as a three, then minor wave 4 may be unfolding as a flat or a triangle.
If minute wave w subdivides as a flat correction, then minor wave 4 may be unfolding as a double flat or double combination.
The flat correction which is labeled minute wave a or w may be an expanded flat correction. Minuette wave (b) is now 1.21 length of minuette wave (a), which is within the most common range of up to 1.38. The most common ratio for minuette wave (c) would be 1.618 in length with minuette wave (a), which is at support.
Overall, minor wave 4 may be expected to continue for a few more weeks.
WEEKLY CHART – DOUBLE ZIGZAG
Click chart to enlarge.
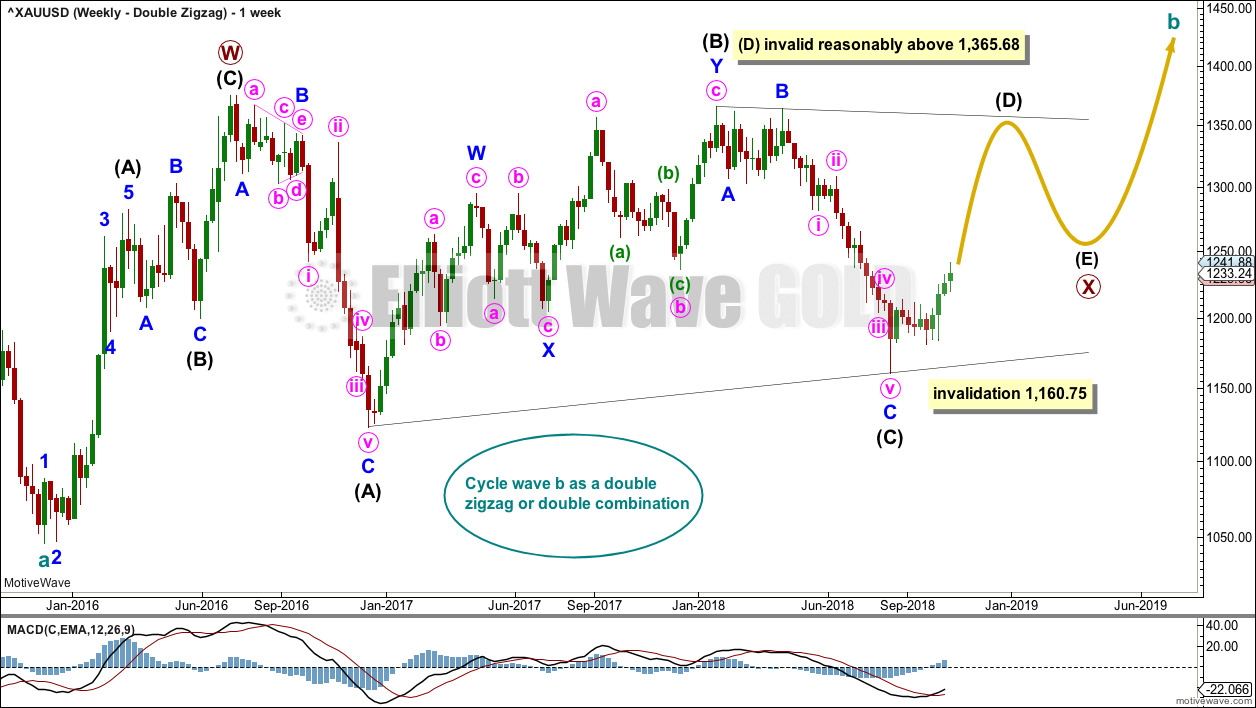
It is also possible that cycle wave b may be a double zigzag or a double combination.
The first zigzag in the double is labelled primary wave W. This has a good fit.
The double may be joined by a corrective structure in the opposite direction, a triangle labelled primary wave X. The triangle would be about three quarters complete.
Within the triangle of primary wave X, intermediate wave (C) should be complete. Within intermediate wave (D), minor wave B may not move beyond the start of minor wave A below 1,160.75.
Intermediate wave (D) would most likely subdivide as a single zigzag. The subdivisions at the daily and hourly chart level for this wave count would be the same as for the first triangle wave count above; a zigzag unfolding higher would be labelled A-B-C.
This wave count may now expect choppy overlapping movement in an ever decreasing range for several more months.
Primary wave Y would most likely be a zigzag because primary wave X would be shallow; double zigzags normally have relatively shallow X waves.
Primary wave Y may also be a flat correction if cycle wave b is a double combination, but combinations normally have deep X waves. This would be less likely.
This wave count has good proportions and no problems in terms of subdivisions.
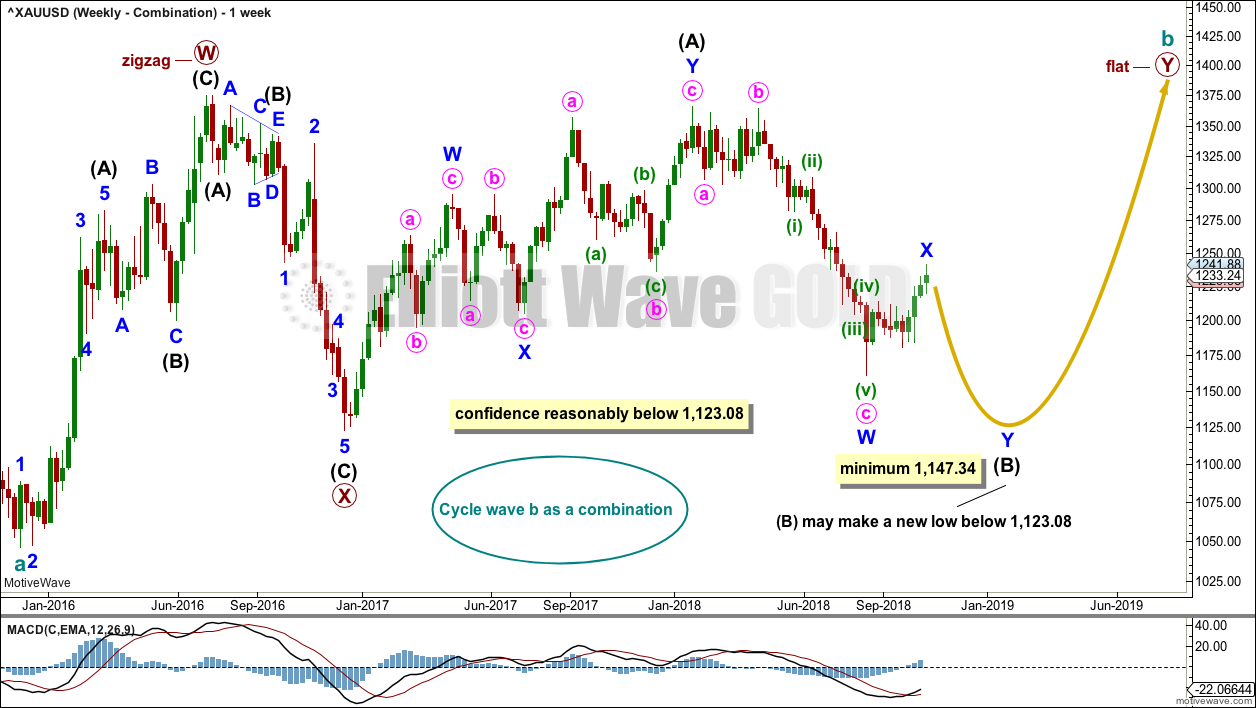
WEEKLY CHART – COMBINATION
Click chart to enlarge.
If cycle wave b is a combination, then the first structure in a double may be a complete zigzag labelled primary wave W.
The double may be joined by a three in the opposite direction, a zigzag labelled primary wave X.
The second structure in the double may be a flat correction labelled primary wave Y. My research on Gold so far has found that the most common two structures in a double combination are one zigzag and one flat correction. I have found only one instance where a triangle unfolded for wave Y. The most likely structure for wave Y would be a flat correction by a very wide margin, so that is what this wave count shall expect.
Within a flat correction for primary wave Y, the current downwards wave of intermediate wave (B) may be a double zigzag. Intermediate wave (B) must retrace a minimum 0.9 length of intermediate wave (A) at 1,147.34. Intermediate wave (B) may move beyond the start of intermediate wave (A) as in an expanded flat.
Because the minimum requirement for intermediate wave (B) is not yet met, this wave count requires that intermediate wave (B) continues lower. This is the most immediately bearish of all four weekly wave counts.
When intermediate wave (B) is complete, then intermediate wave (C) would be expected to make at least a slight new high above the end of intermediate wave (A) at 1,365.68 to avoid a truncation. Primary wave Y would be most likely to end about the same level as primary wave W at 1,374.91, so that the whole structure takes up time and moves price sideways, as that is the purpose of double combinations.
While double combinations are very common, triples are extremely rare. I have found no examples of triple combinations for Gold at daily chart time frames or higher back to 1976. When the second structure in a double is complete, then it is extremely likely (almost certain) that the whole correction is over.
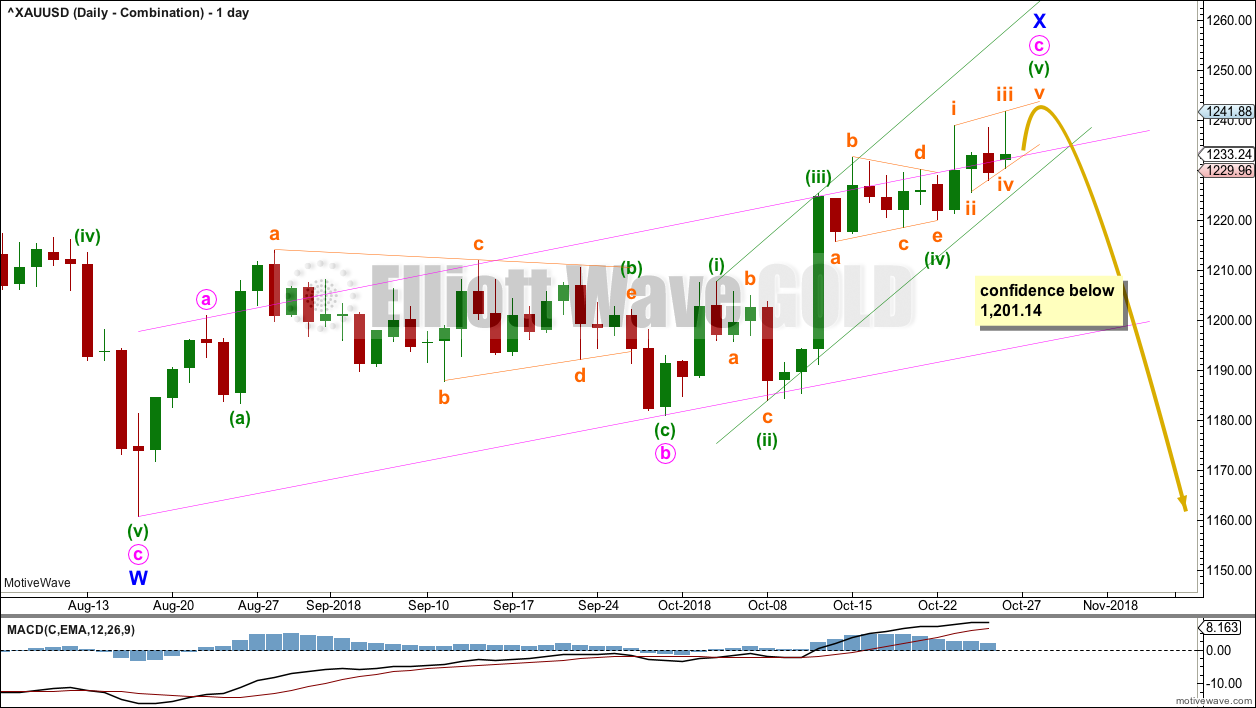
DAILY CHART – COMBINATION
Click chart to enlarge.
Minor wave X may now be incomplete. On the hourly chart, it is not possible now to see minuette wave (v) as a complete five wave structure, but it is possible to see it as an incomplete ending contracting diagonal.
When minuette wave (v) may be complete, then this wave count would again expect a trend change and a new downwards wave to a minimum at 1,147.34.
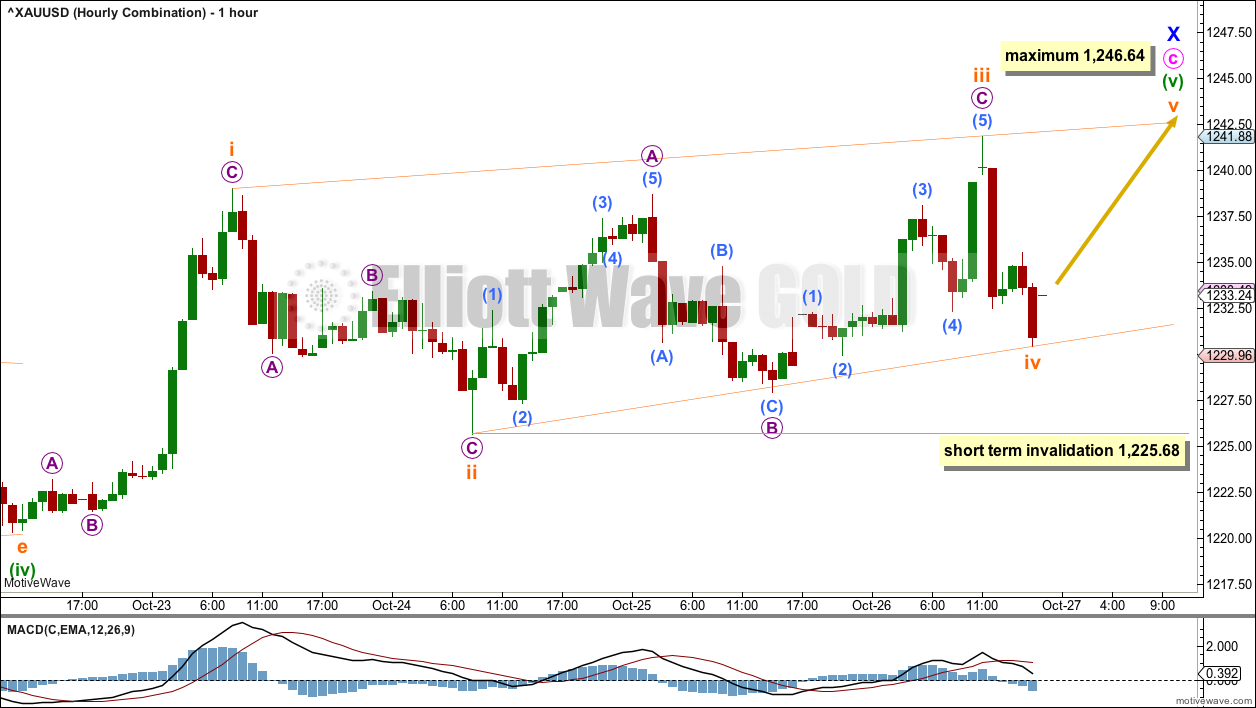
HOURLY CHART – COMBINATION
Click chart to enlarge.
Minuette wave (v) may be an incomplete ending contracting diagonal.
Within the diagonal, subminuette wave iii is shorter than subminuette wave i and subminuette wave iv is shorter than subminuette wave ii. Subminuette wave v may not be longer than subminuette wave iii; it may not move above 1,246.64.
Subminuette wave v may end with a small overshoot of the i-iii trend line. Subminuette wave v must move at least slightly above the end of subminuette wave iii at 1,241.88 to avoid a truncation. Diagonals almost never end with truncated fifth waves.
Subminuette wave iv may not move beyond the end of subminuette wave ii below 1,225.68.
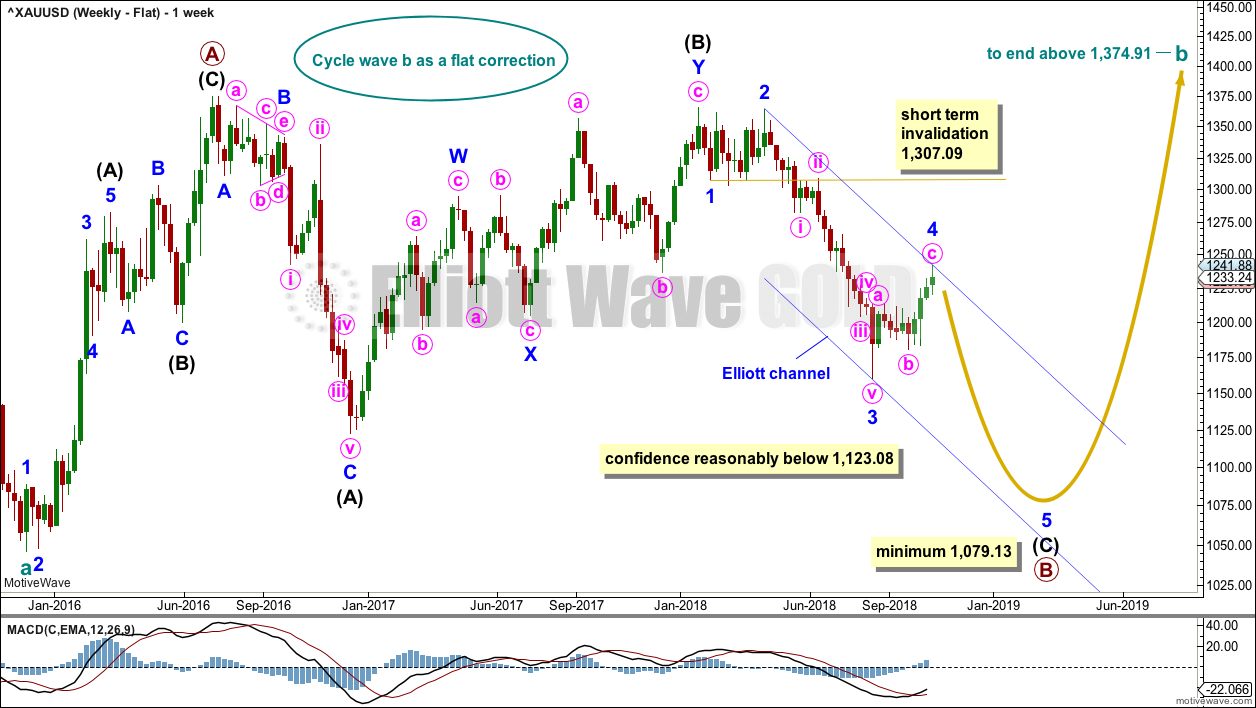
WEEKLY CHART – FLAT
Click chart to enlarge.
It is possible that cycle wave b may be a flat correction. Within a flat correction, primary wave B must retrace a minimum 0.9 length of primary wave A at 1,079.13 or below. Primary wave B may make a new low below the start of primary wave A at 1,046.27 as in an expanded flat correction.
Only a new low reasonably below 1,123.08 would provide reasonable confidence in this wave count.
Intermediate wave (C) must subdivide as a five wave structure; it may be unfolding as an impulse. Within intermediate wave (C), minor waves 1 through to 4 may be complete. If it continues further, then minor wave 4 may not move into minor wave 1 price territory above 1,307.09.
The blue channel is drawn using Elliott’s second technique. Minor wave 5 may end at support about the lower edge of this channel.
Minor wave 2 was a double zigzag lasting nine weeks. Minor wave 4 exhibits little alternation as a single zigzag and reasonable proportion lasting ten weeks.
TECHNICAL ANALYSIS
WEEKLY CHART
Click chart to enlarge. Chart courtesy of StockCharts.com.
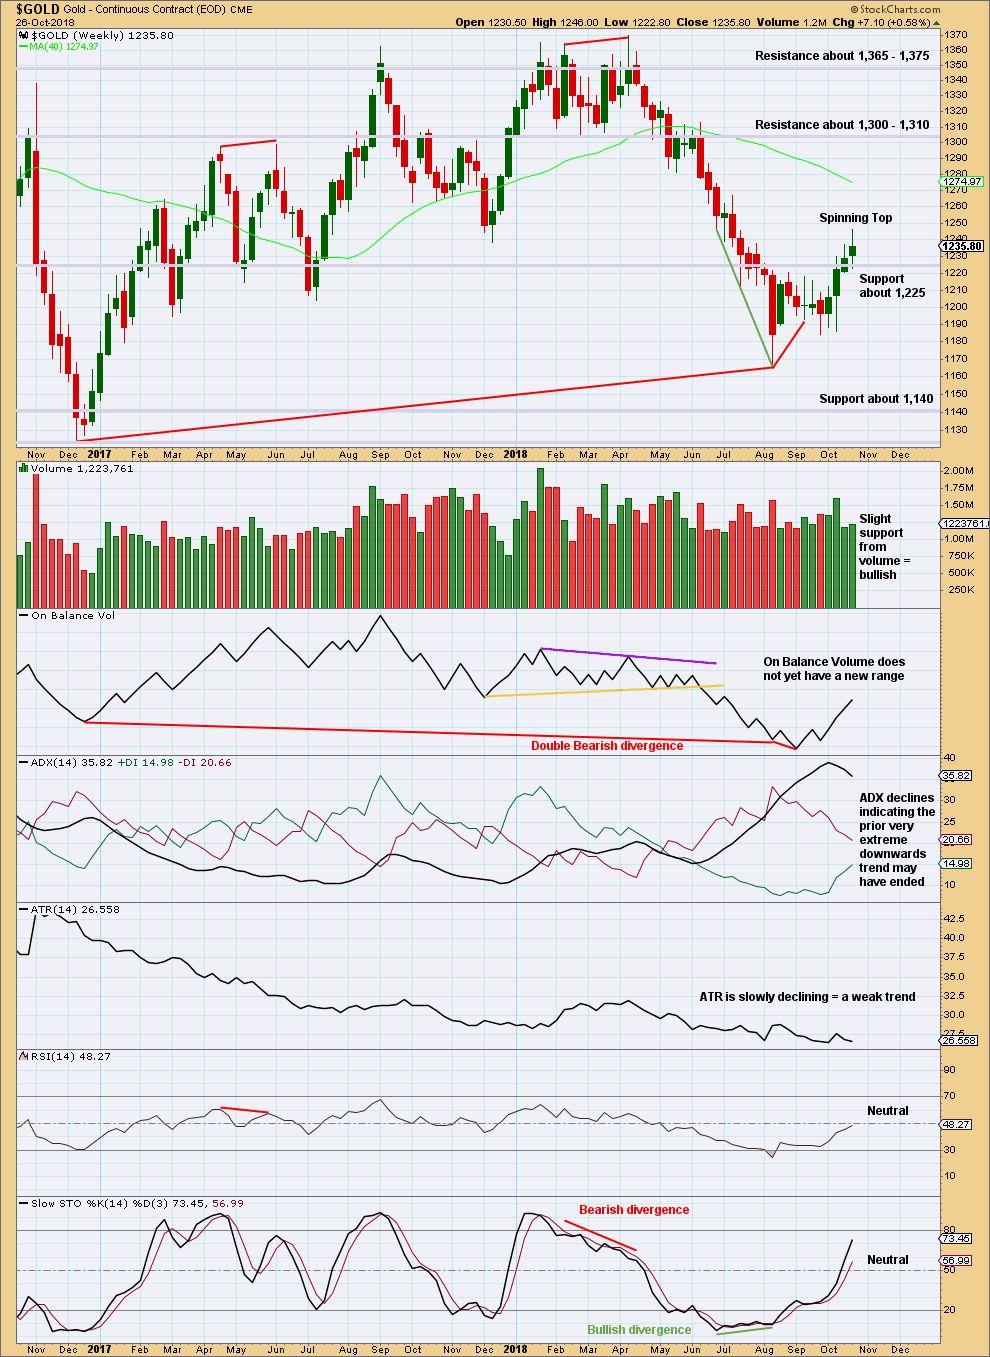
On Balance Volume has made a lower low than its prior low at the end of November 2015. This divergence is extremely bearish but does not rule out a consolidation unfolding here; the divergence does strongly support the Triangle wave count, which expects a consolidation or bounce up to test resistance now and then a continuation of a major bear market. It could also support the flat wave count that allows for a new low below 1,046.27 in coming months.
This week’s Spinning Top candlestick pattern puts the trend from up to neutral.
DAILY CHART
Click chart to enlarge. Chart courtesy of StockCharts.com.
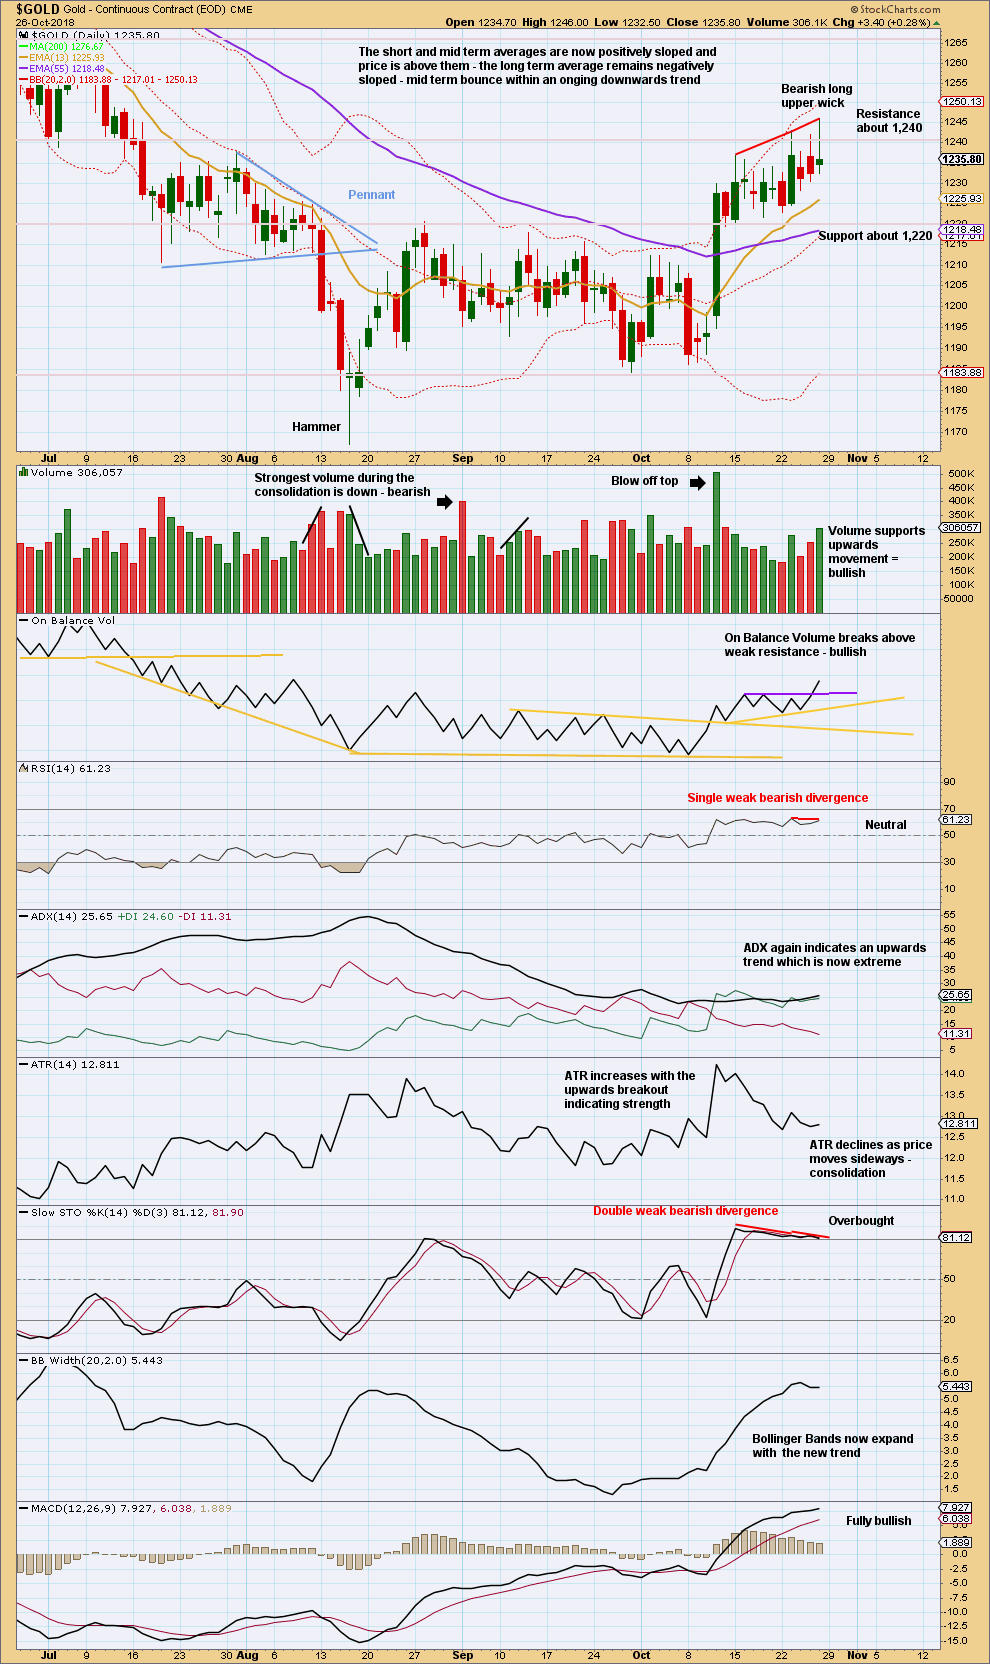
Price remains range bound with resistance about 1,240 and support about 1,220. With a long upper wick, which is bearish, this Friday’s candlestick failed to close outside this range.
While ADX still indicates an upwards trend, the ADX line is now just above the directional lines indicating the trend is becoming extreme.
On Friday volume was strong and On Balance Volume gave a bullish signal. However, the close back into the consolidation zone is a stronger indicator. Price, with support from volume, needs to close above 1,240 for a breakout.
GDX WEEKLY CHART
Click chart to enlarge. Chart courtesy of StockCharts.com.
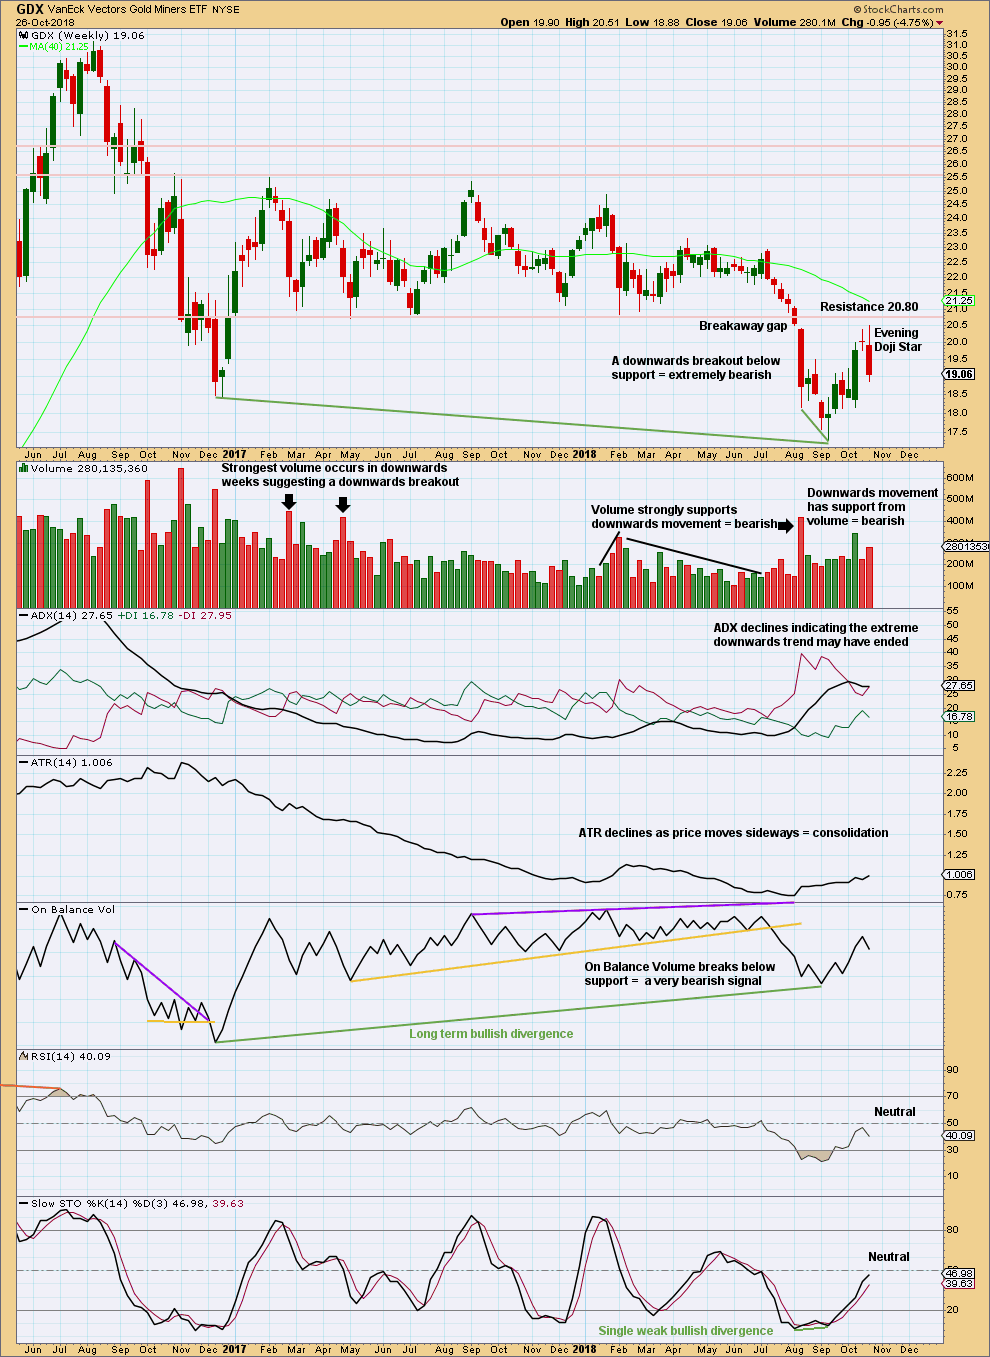
GDX had a large consolidation that lasted from January 2017 to August 2018. A downwards breakout below support at 20.80 in early August 2018 is highly significant. The breakout had support from volume, which adds confidence.
Upwards movement to the high this week now looks like a completed back test of resistance close to prior support at 20.80. The Evening doji star pattern indicates the bounce may be complete. The high this week at 20.51 is exactly the upper edge of the breakaway gap.
It would now be typical to see price move down and away. The target is at 16.02.
GDX DAILY CHART
Click chart to enlarge. Chart courtesy of StockCharts.com.
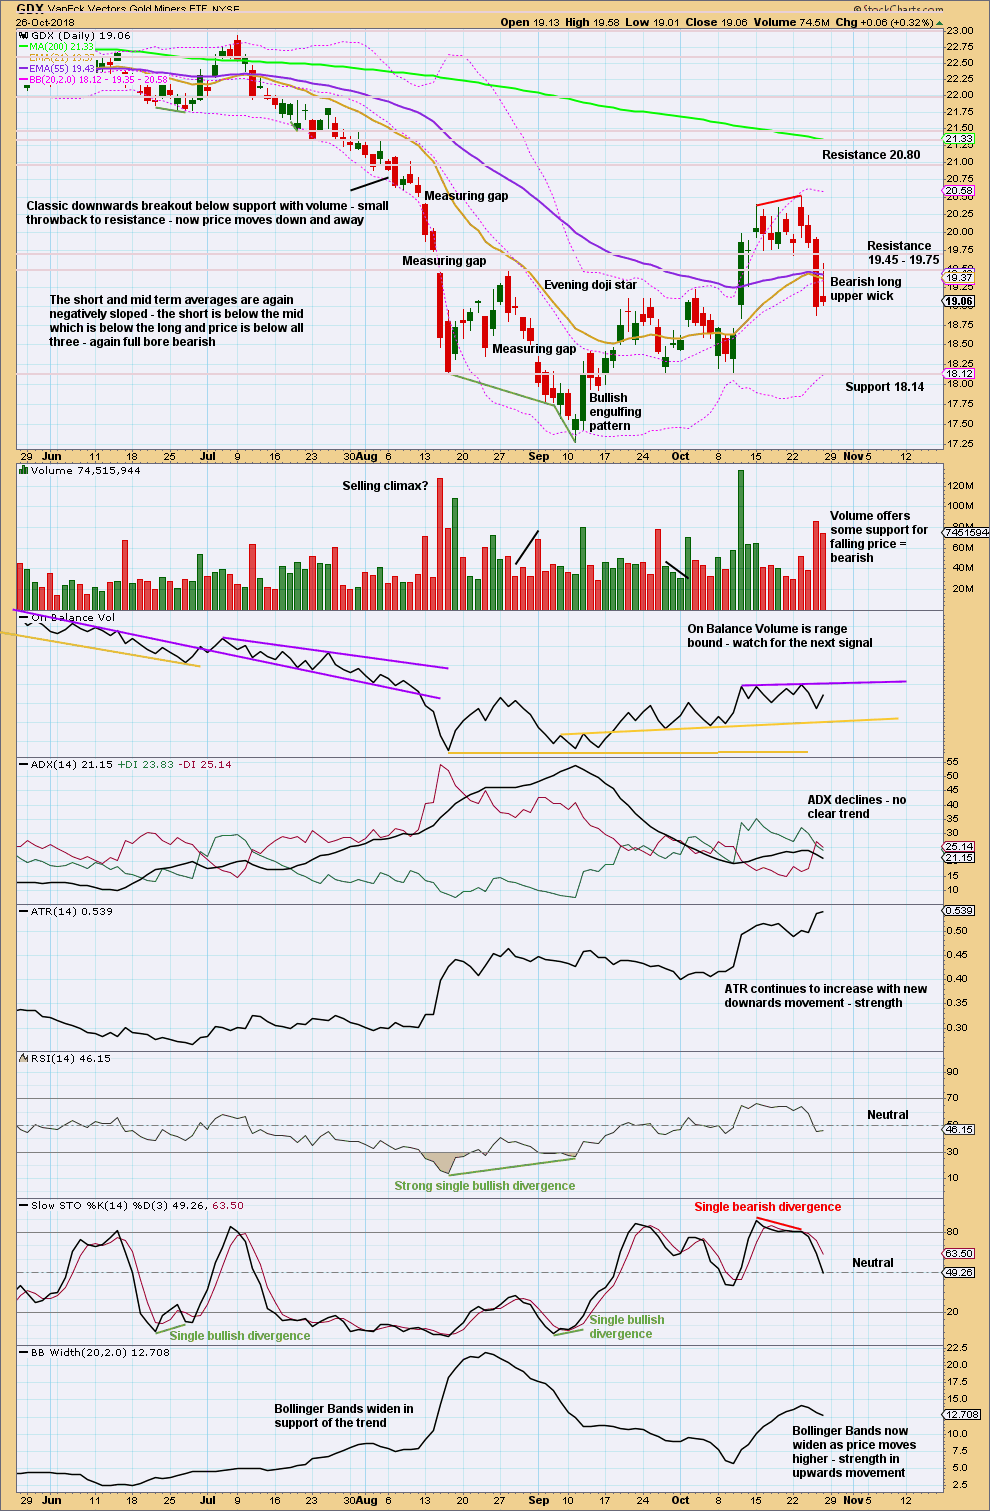
The back test looks complete. It did not manage to get right up to 20.80.
The target is at 16.02. Price will not move in a straight line to this target; there will be consolidations and bounces along the way. Next support is about 18.15.
Published @ 12:09 a.m. EST on 27th October, 2018.
—
Careful risk management protects your trading account(s).
Follow my two Golden Rules:
1. Always trade with stops.
2. Risk only 1-5% of equity on any one trade.
Updated hourly triangle wave count:
Minute a could now be a complete flat correction. Now this wave count would expect the downwards swing to support is over, and a new upwards swing may now begin to resistance.