

S&P 500
To end the week, upwards movement has continued as expected.
Summary: A low looks to be in place at least for the short to mid term. A target for the next wave up is now 2,882 or 3,013 (alternate wave count).
Five daily charts today look at five different structures for primary wave 4, in order of probability (roughly): triangle, combination, zigzag, double zigzag, and flat.
Primary wave 4 could be over. The alternate wave count outlines this possibility.
The biggest picture, Grand Super Cycle analysis, is here.
Last published monthly chart is here, video is here.
ELLIOTT WAVE COUNT
WEEKLY CHART
Click chart to enlarge.
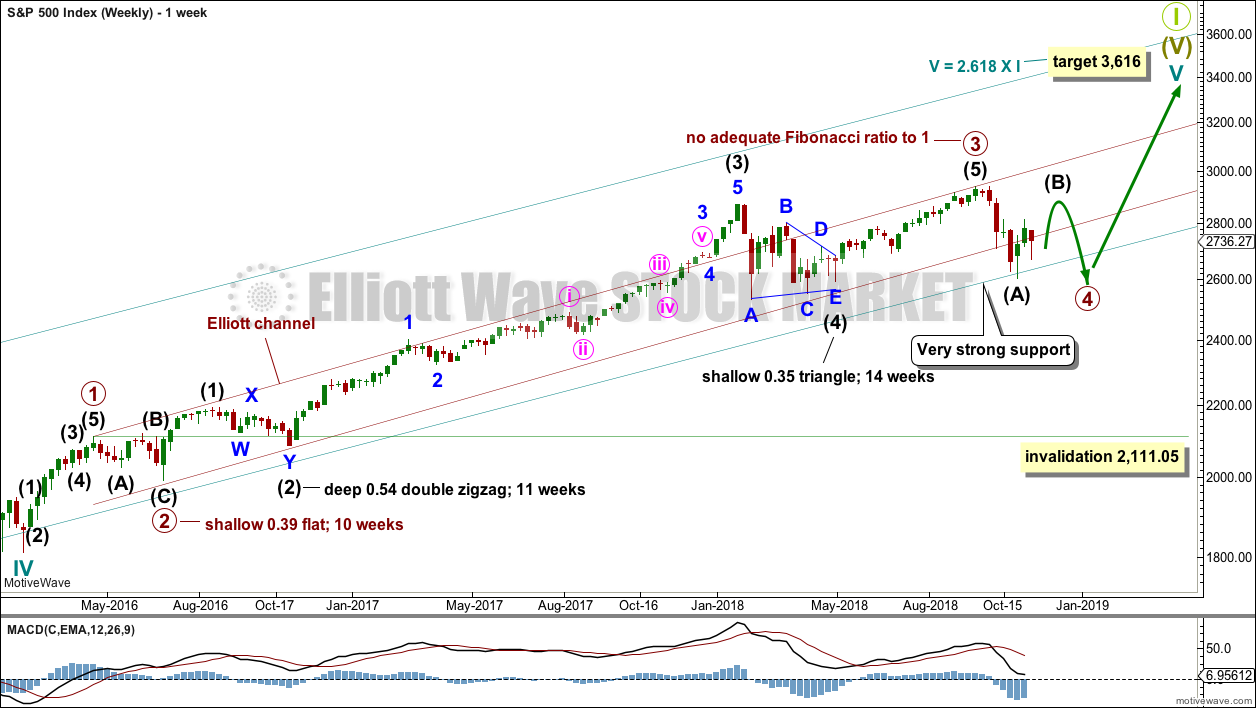
Cycle wave V must complete as a five structure, which should look clear at the weekly chart level and also now at the monthly chart level. It may only be an impulse or ending diagonal. It is clear it is an impulse.
Cycle wave V has passed equality in length with cycle wave I, and 1.618 the length of cycle wave I. The next Fibonacci ratio is used to calculate a target. When primary wave 4 is complete and the starting point for primary wave 5 is known, then the final target may also be calculated at primary degree. At that stage, there may be two targets, or the final target may widen to a small zone.
Within cycle wave V, the third waves at all degrees may only subdivide as impulses.
Within primary wave 3, there is perfect alternation and excellent proportion between intermediate waves (2) and (4).
The maroon channel is drawn about primary degree waves. The first trend line is drawn from the ends of primary waves 1 to 3, then a parallel copy is placed upon the low of primary wave 2. The overshoot of the upper edge of this channel by the end of intermediate wave (3) looks typical. For the S&P, its tghird waves are usually the strongest portion of an impulse; they often exhibit enough strength to overshoot channels.
Primary wave 4 now has an overshoot on the lower edge of the channel. This is acceptable; fourth waves are not always neatly contained within channels drawn using this technique.
Primary wave 4 may find very strong support about the lower edge of the teal channel, and it looks like this is from where price bounced on the 29th of October. This channel is copied over from the monthly chart and contains the entire bull market since its beginning in March 2009. While Super Cycle wave (V) is incomplete, this channel should not be breached at the weekly chart level.
Primary wave 4 may not move into primary wave 1 price territory below 2,111.05.
At this stage, the expectation is for the final target to be met in October 2019. If price gets up to this target and either the structure is incomplete or price keeps rising through it, then a new higher target would be calculated.
At this stage, the various possible structures for primary wave 4 will be published as separate daily charts, presented in order of probability.
DAILY CHART – TRIANGLE

Click chart to enlarge.
If primary wave 4 unfolds as a triangle, it would have perfect alternation with the regular flat correction of primary wave 2. It would also continue to find support about the lower edge of the teal trend channel. Triangles are fairly common structures for fourth waves. For these reasons this wave count may have a slightly higher probability than the other daily charts.
If primary wave 4 is unfolding as a triangle, then within it intermediate wave (B) would most likely be incomplete. To label intermediate wave (B) over at the last swing high is possible, but it would look too shallow for a normal looking Elliott wave triangle.
Triangle sub-waves are often about 0.8 to 0.85 the length of the prior wave. This gives a target range for intermediate wave (B).
One triangle sub-wave may subdivide as a multiple; this is most often wave C, but it may also be wave B. Intermediate wave (B) may be unfolding higher as a double zigzag. A target is calculated for intermediate wave (B) to end.
There is no upper invalidation point for this wave count. Intermediate wave (B) may make a new high above the start of intermediate wave (A) as in a running triangle. Intermediate wave (B) should exhibit clear weakness. If price does make a new high, then for this wave count it should come with weak volume and bearish divergence between price and one or both of RSI or Stochastics.
Within the triangle, intermediate wave (C) may not move beyond the end of intermediate wave (A) below 2,603.54.
DAILY CHART – COMBINATION
Click chart to enlarge.
This wave count is judged to have only a very slightly lower probability than the triangle.
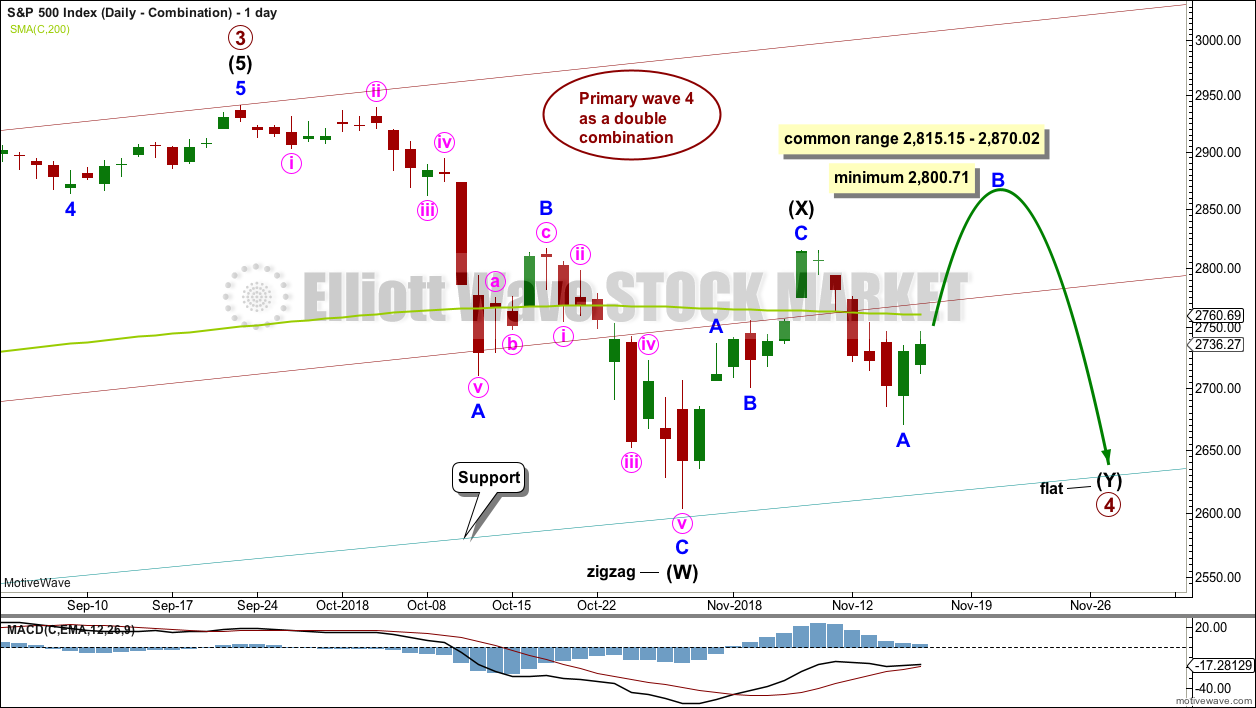
Primary wave 4 may be unfolding as a double combination. The first structure in the double may be a complete zigzag labelled intermediate wave (W). The double may be joined by a three in the opposite direction labelled intermediate wave (X). Intermediate wave (X) may be complete as a single zigzag; it is deep at 0.63 the length of intermediate wave (W), which looks reasonable.
Intermediate wave (Y) would most likely be a flat correction, which should subdivide 3-3-5. At its end, it may still find strong support about the lower edge of the teal trend channel.
Within the flat correction of intermediate wave (Y), minor wave B must retrace a minimum 0.9 length of minor wave A. The common range for minor wave B is from 1 to 1.38 times the length of minor wave A. Minor wave B may make a new high above the start of minor wave A at 2,815.15 as in an expanded flat.
DAILY CHART – ZIGZAG

Click chart to enlarge.
Primary wave 4 may be unfolding as a single zigzag, which is the most common type of corrective structure.
Within the zigzag, intermediate wave (B) may now be a complete structure, ending close to the 0.618 Fibonacci ratio of intermediate wave (A).
Intermediate wave (C) may now unfold lower as a five wave structure. Intermediate wave (C) would be very likely to end at least slightly below the end of intermediate wave (A) at 2,603.54 to avoid a truncation. It may end about support at 2,600.
This wave count would expect a fairly large overshoot of the teal trend channel. This reduces the probability of this wave count.
Within intermediate wave (C), minor wave 2 may not move beyond the start of minor wave 1 above 2,815.15.
DAILY CHART – DOUBLE ZIGZAG

Click chart to enlarge.
Primary wave 4 may also be unfolding as a double zigzag.
The first zigzag in the double may be complete, labelled intermediate wave (W). The double may joined by a complete three in the opposite direction, a zigzag labelled intermediate wave (X).
The second zigzag in the double may have begun. It is labelled intermediate wave (Y). Within intermediate wave (Y), minor wave B may not move beyond the start of minor wave A above 2,815.15.
The purpose of a second zigzag in a double is to deepen the correction when the first zigzag does not move price deep enough. To achieve this purpose intermediate wave (Y) should be expected to end reasonably below the end of intermediate wave (W) at 2,603.54. This would expect a very large overshoot of the teal trend channel; for this reason, this wave count is judged to have the lowest probability.
DAILY CHART – FLAT
Click chart to enlarge.
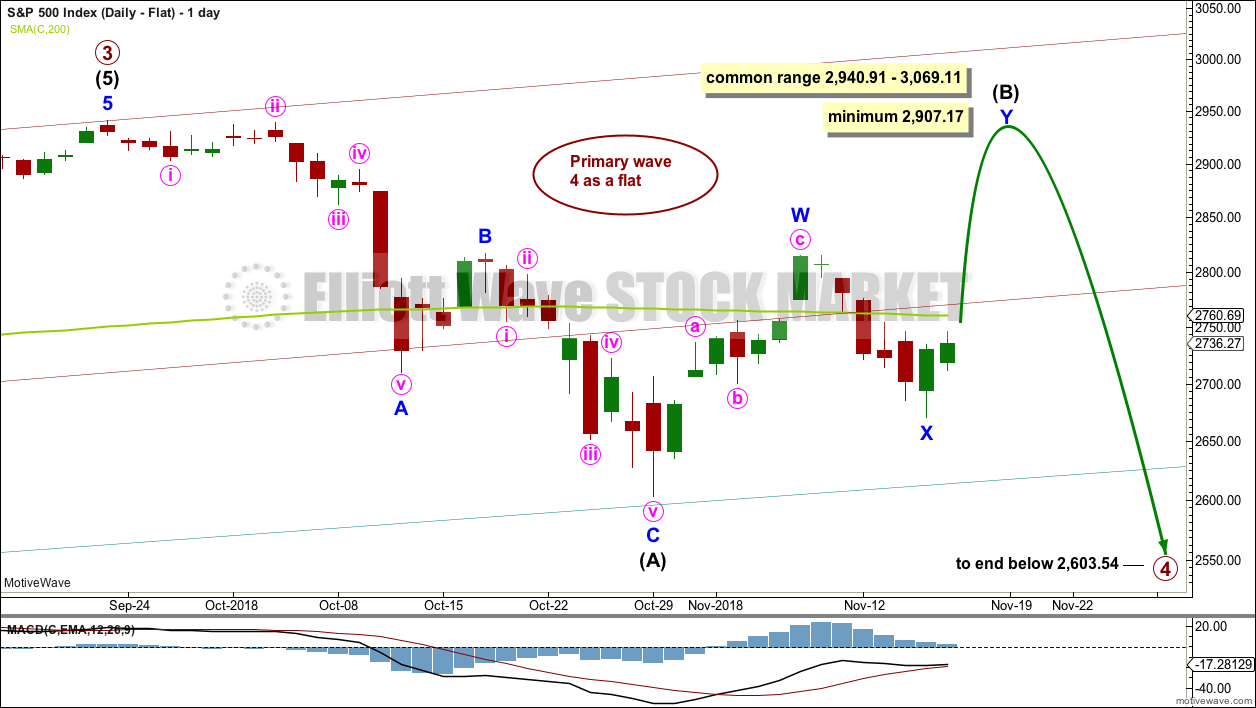
Primary wave 2 was a regular flat correction. If primary wave 4 unfolds as a flat correction, then there would be no alternation in structure between the two corrections; for this reason, this wave count is judged to have a low probability.
However, alternation is a guideline, not a rule, and it is not always seen. This wave count is possible.
If primary wave 4 is a flat correction, then within it intermediate wave (B) must move higher to retrace a minimum 0.9 length of intermediate wave (A).
When intermediate wave (B) is complete, then intermediate wave (C) should move below the end of intermediate wave (A) at 2,603.54 to avoid a truncation. This would expect a reasonable overshoot of the teal trend line, which further reduces the probability of this wave count.
BULLISH ALTERNATE ELLIOTT WAVE COUNT
WEEKLY CHART
Click chart to enlarge.
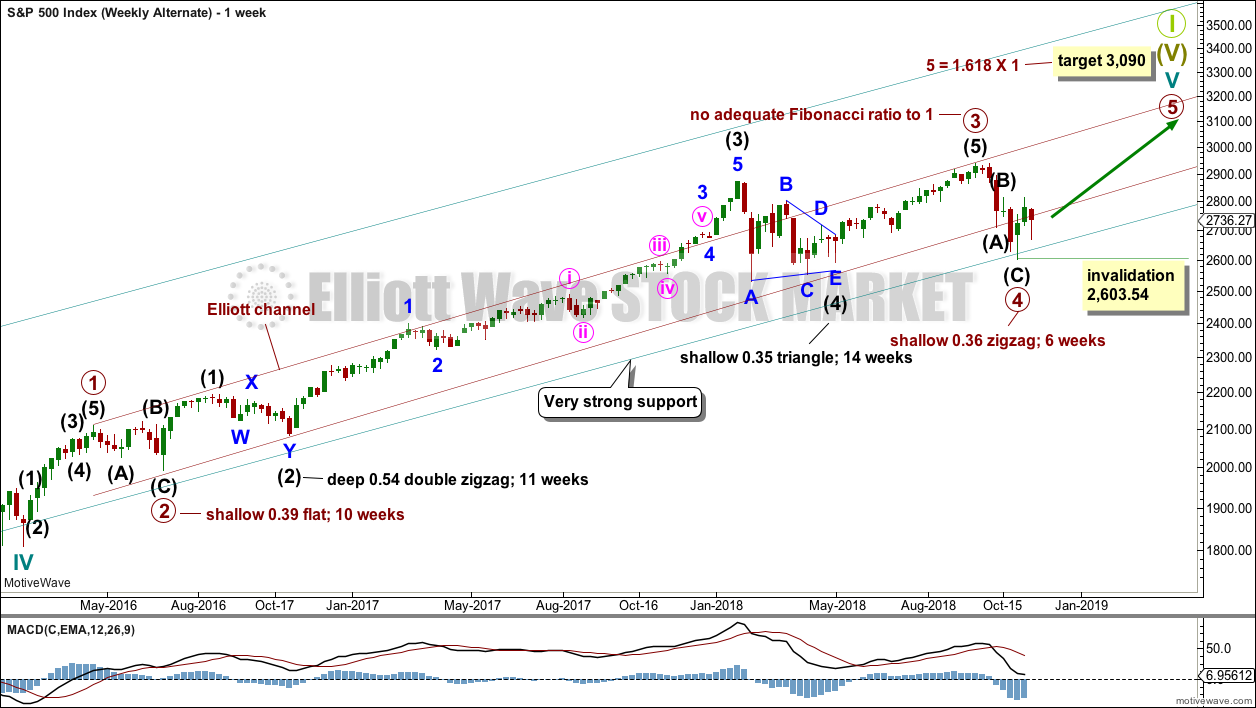
It is possible that primary wave 4 could be over as a relatively quick zigzag, ending about support at the lower edge of the teal channel.
The proportion between primary waves 2 and 4 is reasonable. Flat corrections tend to be longer lasting structures than zigzags. There would be perfect alternation in structure and inadequate alternation in depth. This is acceptable.
This wave count has the right look at the monthly chart level.
If primary wave 5 ends at or after the end of December 2018 and the AD line fails to make new all time highs, there would then be the minimum required four months of bearish divergence between price and the AD line. If this happens, then the conditions for the end of this bull market would be in place.
A new target is calculated for primary wave 5 to end. If primary wave 5 were to be only equal in length with primary wave 1, then it would be truncated. A truncated primary wave 5 would be unlikely as then there could be no bearish divergence with the AD line. The next Fibonacci ratio in the sequence is used to calculate a target for primary wave 5.
Within primary wave 5, no second wave correction may move beyond the start of its first wave below 2,603.54.
DAILY CHART
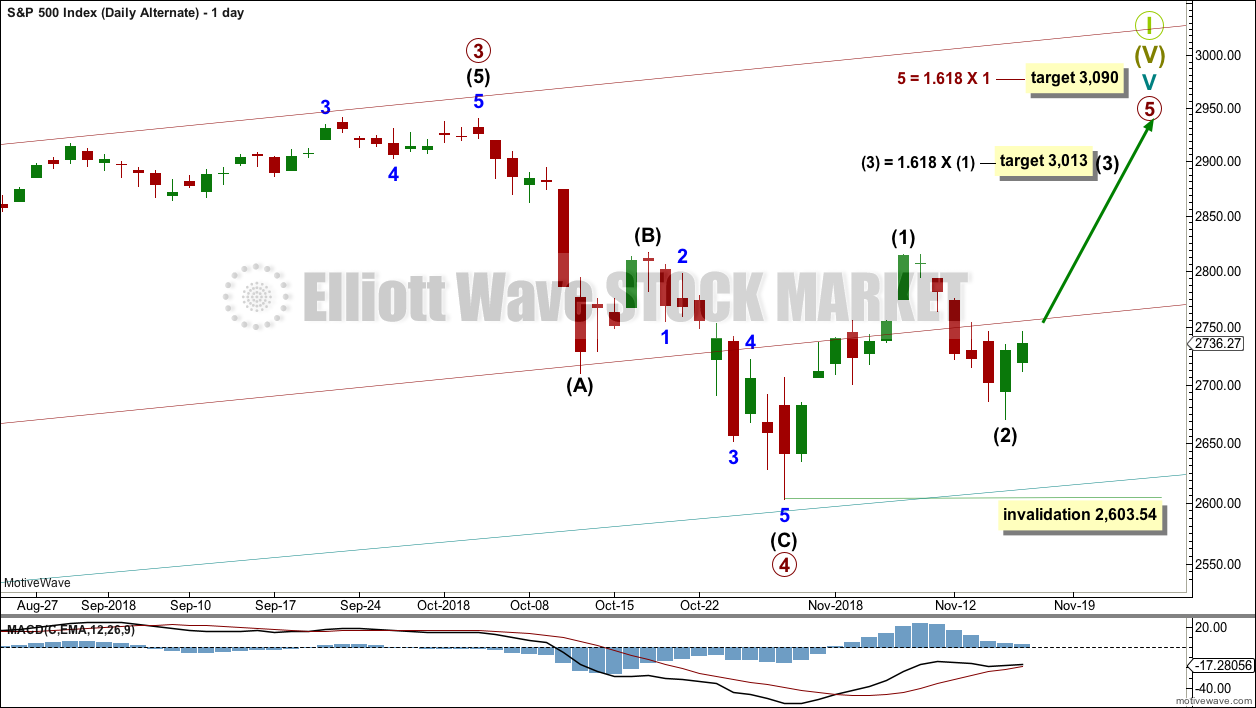
Click chart to enlarge.
The subdivisions of primary wave 4 are seen in exactly the same way as most of the charts above except the degree of labelling is just moved up one degree.
Within primary wave 5, intermediate wave (1) may be over. Intermediate wave (2) may not move beyond the start of intermediate wave (1) below 2,603.54.
Primary wave 5 may subdivide either as an impulse (more likely) or an ending diagonal (less likely). Intermediate wave (1) may be seen as either a five wave impulse or a three wave zigzag at lower time frames, and so at this stage primary wave 5 could be either an impulse or a diagonal.
Primary wave 5 at its end may be expected to exhibit reasonable weakness. At its end, it should exhibit a minimum of 4 months bearish divergence with the AD line, it may exhibit bearish divergence between price and RSI and Stochastics, and it may lack support from volume; it may not be possible to distinguish a weak fifth wave from a B wave.
TECHNICAL ANALYSIS
WEEKLY CHART
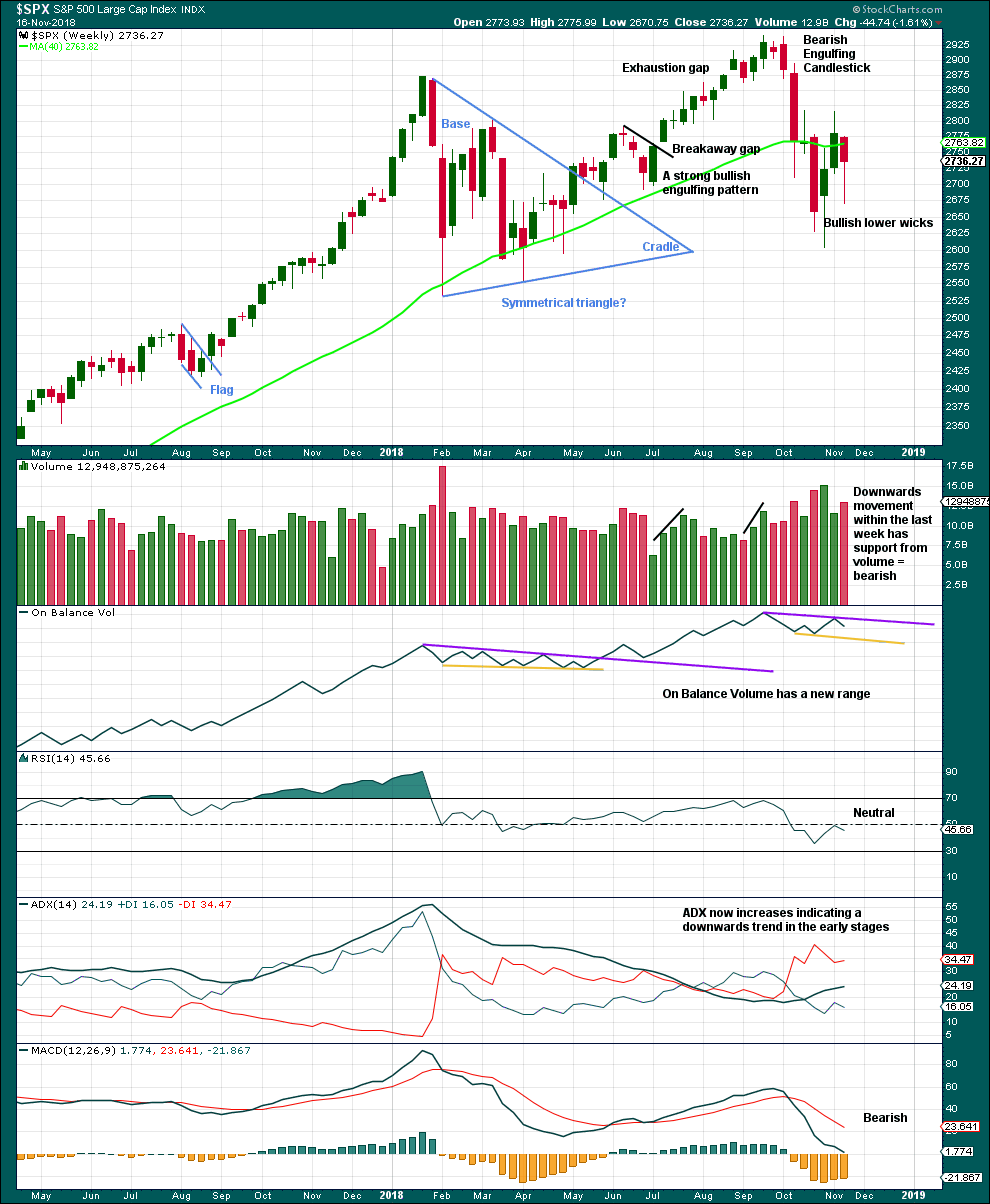
Click chart to enlarge. Chart courtesy of StockCharts.com.
Another long lower wick this week is fairly bullish. An upwards week next week looks most likely.
DAILY CHART
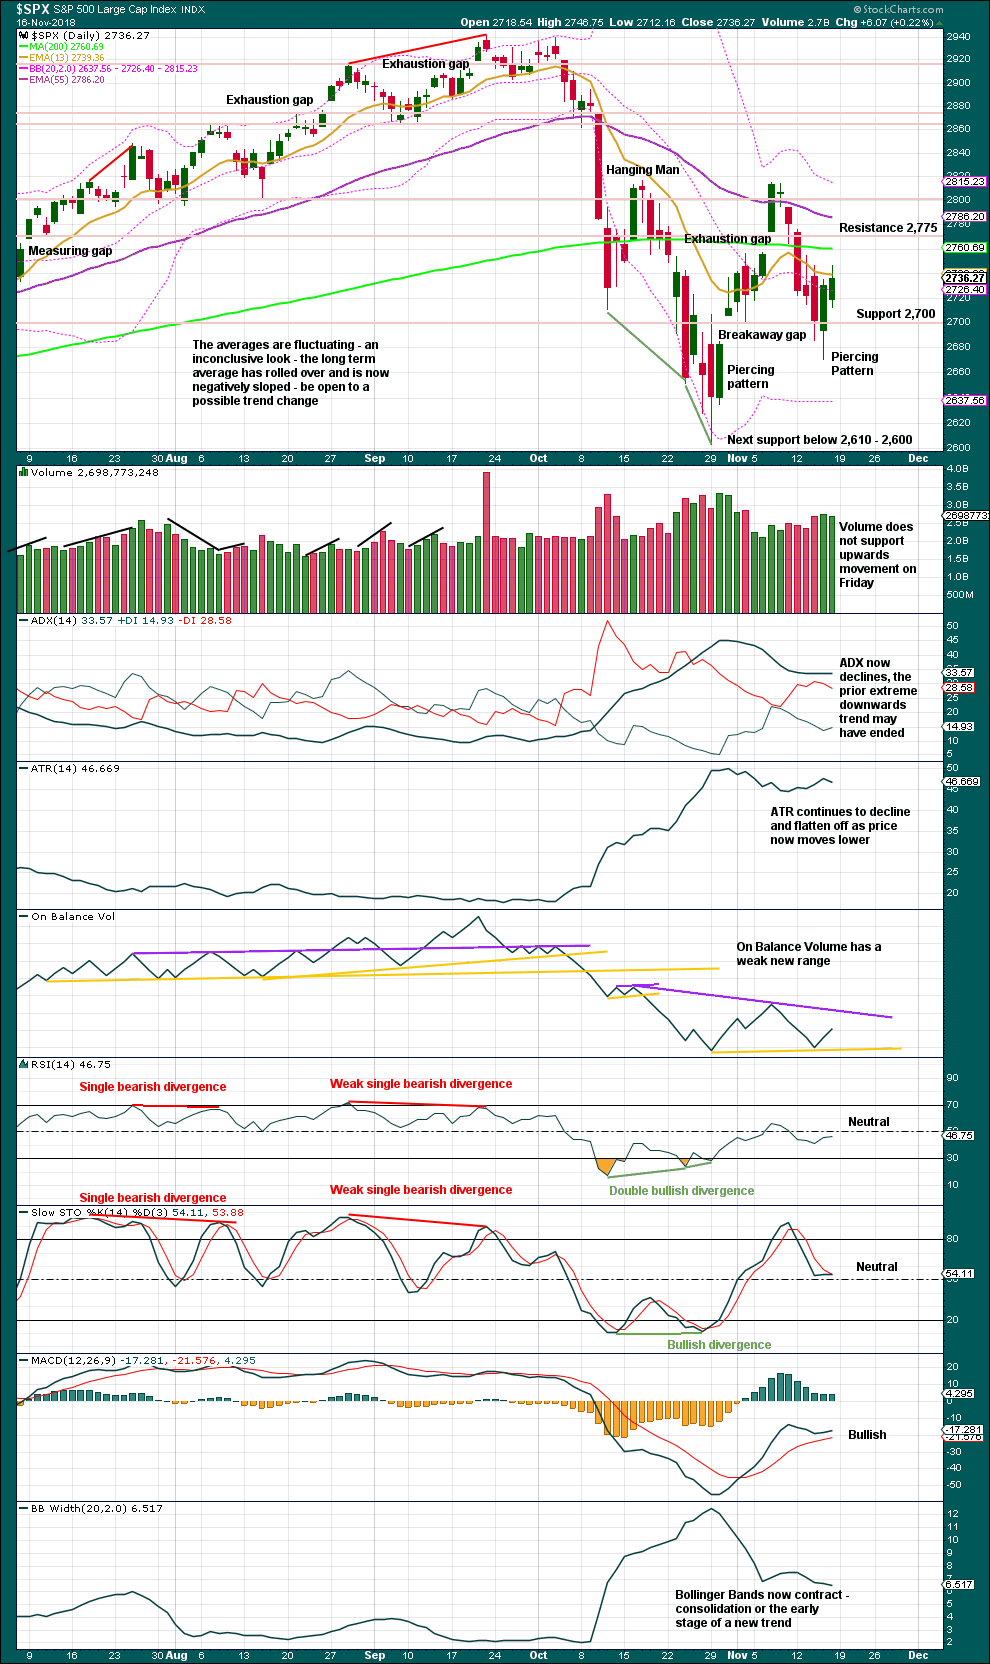
Click chart to enlarge. Chart courtesy of StockCharts.com.
Look for resistance above about 2,775 and above that about 2,800.
A lack of volume for Friday’s upwards movement is not of any concern for bullish wave counts. In current market conditions price can rise in light and declining volume for a reasonable length of time.
BREADTH – AD LINE
WEEKLY CHART
Click chart to enlarge. Chart courtesy of StockCharts.com. So that colour blind members are included, bearish signals
will be noted with blue and bullish signals with yellow.
This week both price and the AD line have moved lower. There is no new divergence.
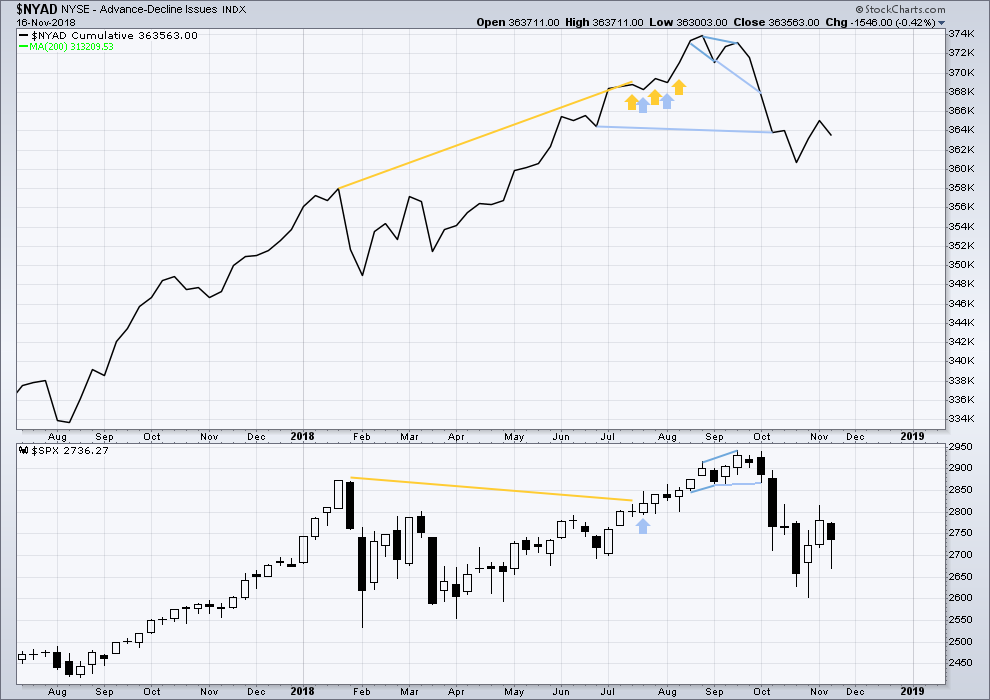
DAILY CHART

Click chart to enlarge. Chart courtesy of StockCharts.com. So that colour blind members are included, bearish signals
will be noted with blue and bullish signals with yellow.
There is normally 4-6 months divergence between price and market breadth prior to a full fledged bear market. This has been so for all major bear markets within the last 90 odd years. With no longer term divergence yet at this point, any decline in price should be expected to be a pullback within an ongoing bull market and not necessarily the start of a bear market. New all time highs from the AD line on the 29th of August means that the beginning of any bear market may be at the end of December 2018, but it may of course be a lot longer than that. My next expectation for the end of this bull market may now be October 2019.
Breadth should be read as a leading indicator.
On Friday both price and the AD line moved higher. There is no new divergence.
All of small, mid and large caps have bullish candlestick reversal patterns at Thursday’s low, and all have moved higher on Friday.
VOLATILITY – INVERTED VIX CHART
WEEKLY CHART

Click chart to enlarge. Chart courtesy of StockCharts.com. So that colour blind members are included, bearish signals
will be noted with blue and bullish signals with yellow.
This week both price and inverted VIX have moved lower. There is no new divergence.
DAILY CHART
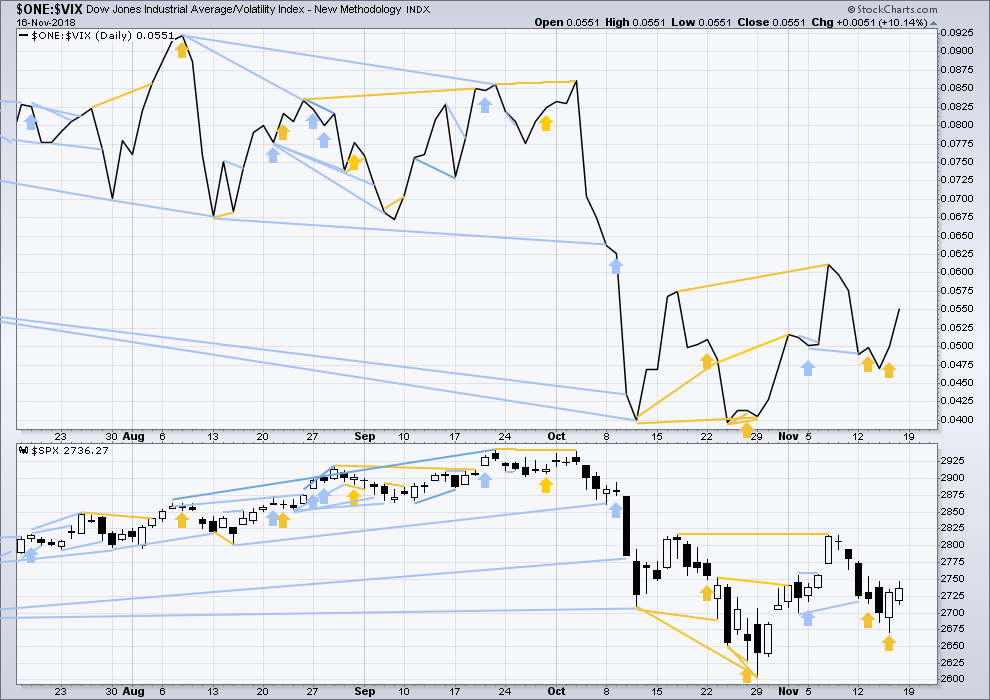
Click chart to enlarge. Chart courtesy of StockCharts.com. So that colour blind members are included, bearish signals
will be noted with blue and bullish signals with yellow.
Normally, volatility should decline as price moves higher and increase as price moves lower. This means that normally inverted VIX should move in the same direction as price.
On Friday both price and inverted VIX have moved higher. There is no new divergence.
DOW THEORY
The following lows need to be exceeded for Dow Theory to confirm the end of the bull market and a change to a bear market:
DJIA: 23,344.52.
DJT: 9,806.79.
S&P500: 2,532.69.
Nasdaq: 6,630.67.
GOLD
Upwards movement has continued at the end of the week as expected.
Summary: The target for the short term is 1,295.
The final target for this bounce to end is about 1,305 – 1,310.
Grand SuperCycle analysis is here.
Last historic analysis with monthly charts is here.
There are four remaining weekly wave counts at this time for cycle wave b: a triangle, a flat, a combination, and a double zigzag.
At this time, the Triangle wave count may again be slightly more likely.
MAIN ELLIOTT WAVE COUNT
WEEKLY CHART – TRIANGLE
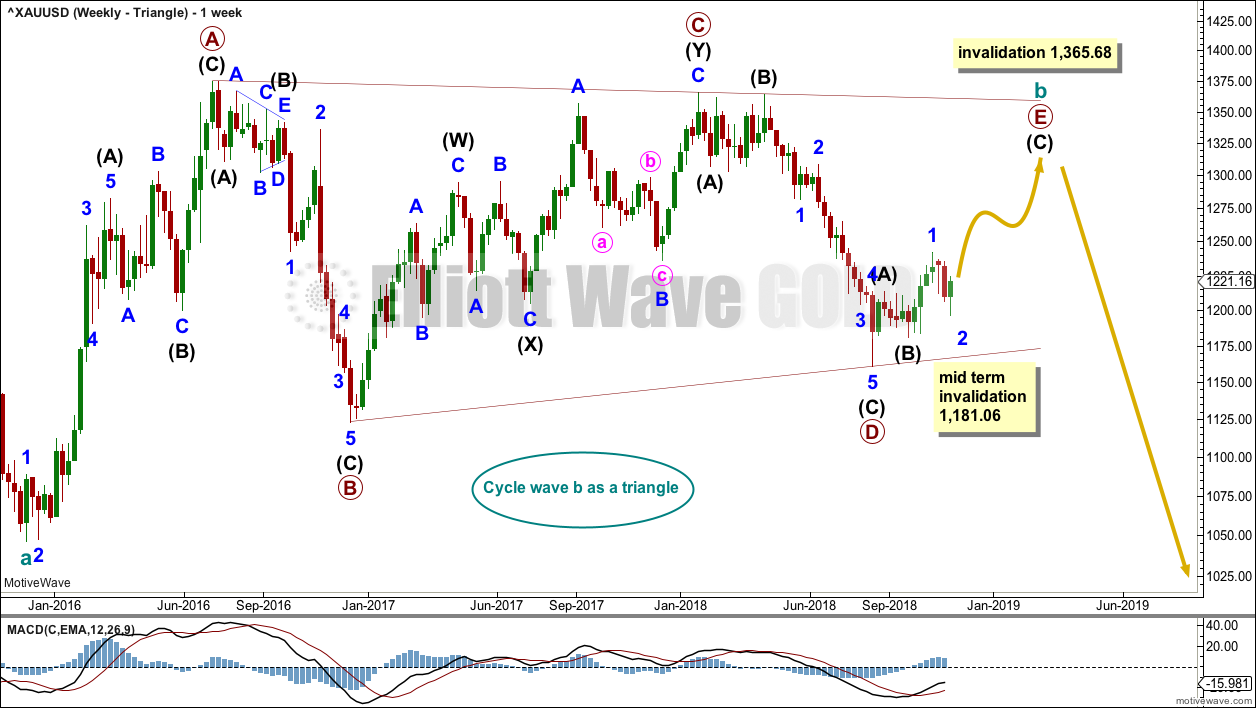
Click chart to enlarge.
Cycle wave b may be an incomplete regular contracting triangle. Primary wave E may not move beyond the end of primary wave C above 1,365.68.
Within primary wave E, intermediate waves (A) and (B) may be complete. Intermediate wave (C) must subdivide as a five wave structure. Within intermediate wave (C), minor wave 2 may not move beyond the start of minor wave 1 below 1,181.06.
Four of the five sub-waves of a triangle must be zigzags, with only one sub-wave allowed to be a multiple zigzag. Wave C is the most common sub-wave to subdivide as a multiple, and this is how primary wave C for this example fits best. Primary wave E would most likely be a single zigzag. It is also possible that it may subdivide as a triangle to create a rare nine wave triangle.
There are no problems in terms of subdivisions or rare structures for this wave count. It has an excellent fit and so far a typical look.
When primary wave E is a complete three wave structure, then this wave count would expect a cycle degree trend change. Cycle wave c would most likely make new lows below the end of cycle wave a at 1,046.27 to avoid a truncation.
DAILY CHART – TRIANGLE
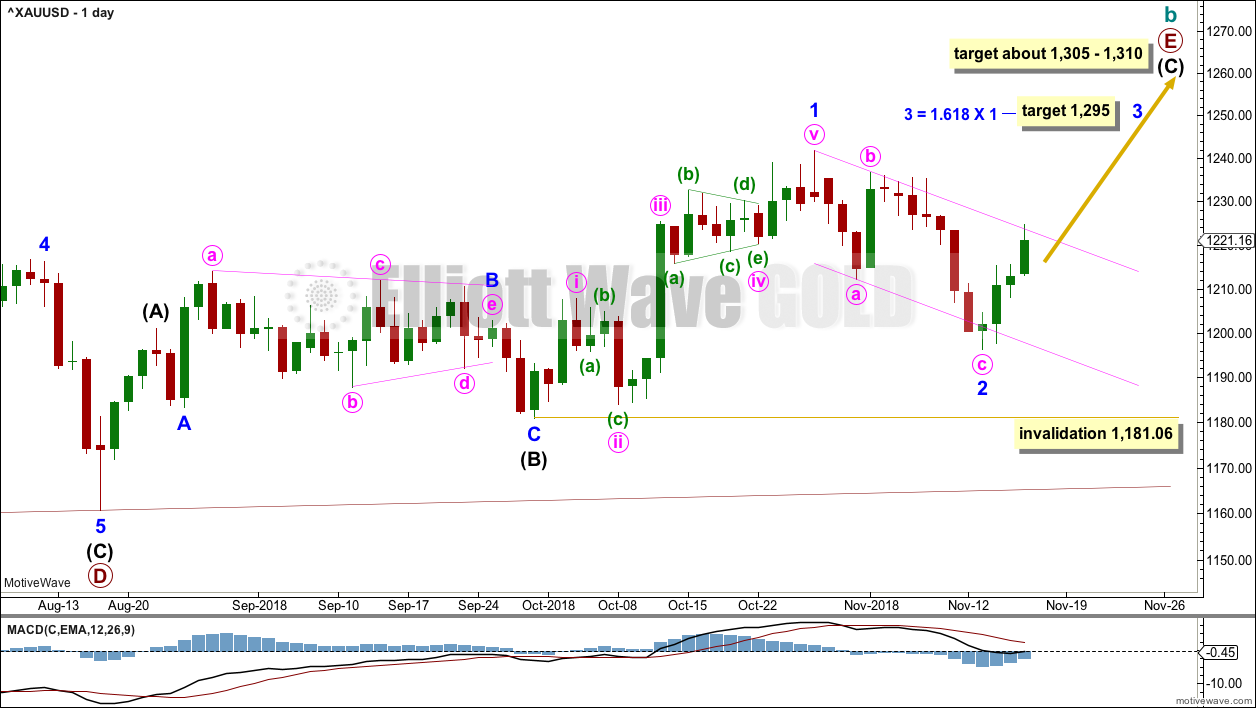
Click chart to enlarge.
Primary wave E should now be underway for this wave count.
Primary wave E should subdivide as a zigzag. Intermediate waves (A) and (B) may now be complete. Intermediate wave (C) may have begun.
Minor wave 1 fits perfectly as a five wave impulse. Minor wave 2 may now be complete as a deep zigzag. Minor wave 3 may now exhibit an increase in upwards momentum, and it should have support from volume. The target for minor wave 3 expects it to exhibit a common Fibonacci ratio to minor wave 1.
If minor wave 2 continues as a double zigzag, then it may not move beyond the start of minor wave 1 below 1,181.06.
A target for primary wave E is the strong zone of resistance about 1,305 to 1,310. Primary wave E is most likely to subdivide as a zigzag (although it may also subdivide as a triangle to create a rare nine wave triangle). It may last a total Fibonacci 21 or 34 weeks. So far it has lasted 13 weeks. Primary wave E may not move beyond the end of primary wave C above 1,365.68.
WEEKLY CHART – DOUBLE ZIGZAG
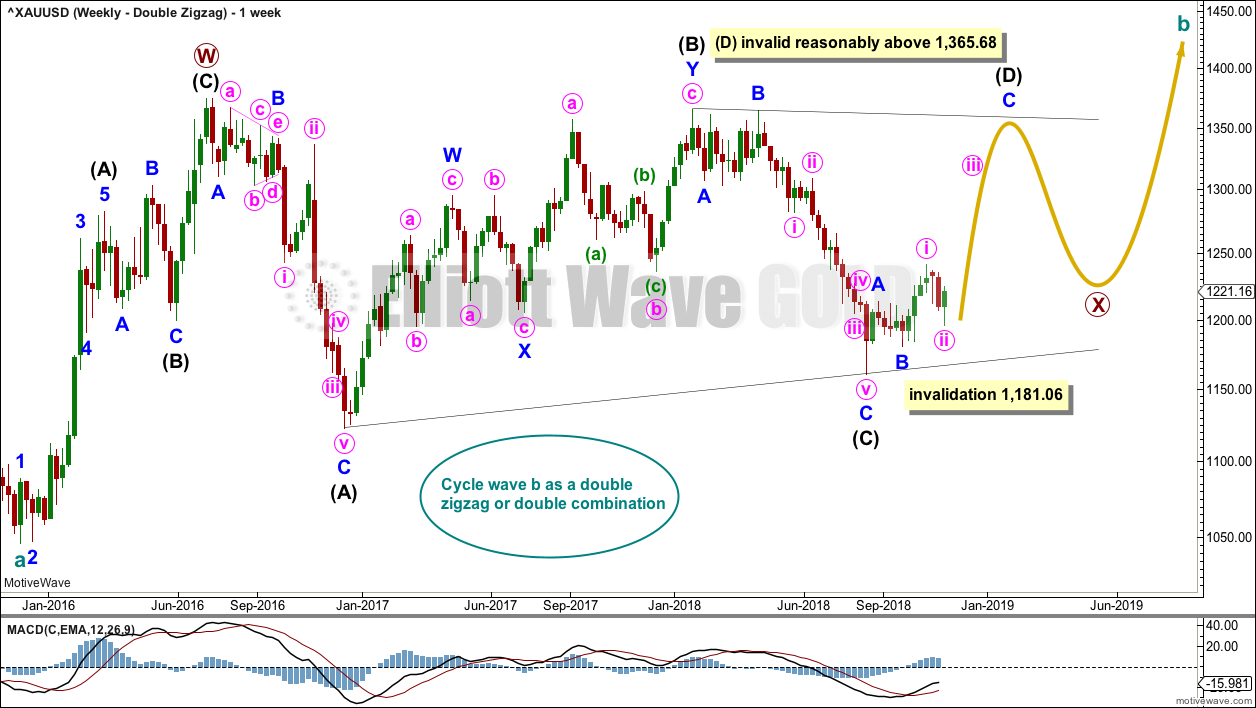
Click chart to enlarge.
It is possible that cycle wave b may be a double zigzag or a double combination.
The first zigzag in the double is labelled primary wave W. This has a good fit.
The double may be joined by a corrective structure in the opposite direction, a triangle labelled primary wave X. The triangle would be about three quarters complete.
Within the triangle of primary wave X, intermediate wave (C) should be complete. Within intermediate wave (D), minor waves A and B may be complete. Minor wave C must subdivide as a five wave structure. Within minor wave C, minute wave ii may not move beyond the start of minute wave i below 1,181.06.
Intermediate wave (D) would most likely subdivide as a single zigzag.
This wave count may now expect choppy overlapping movement in an ever decreasing range for several more months.
Primary wave Y would most likely be a zigzag because primary wave X would be shallow; double zigzags normally have relatively shallow X waves.
Primary wave Y may also be a flat correction if cycle wave b is a double combination, but combinations normally have deep X waves. This would be less likely.
This wave count has good proportions and no problems in terms of subdivisions.
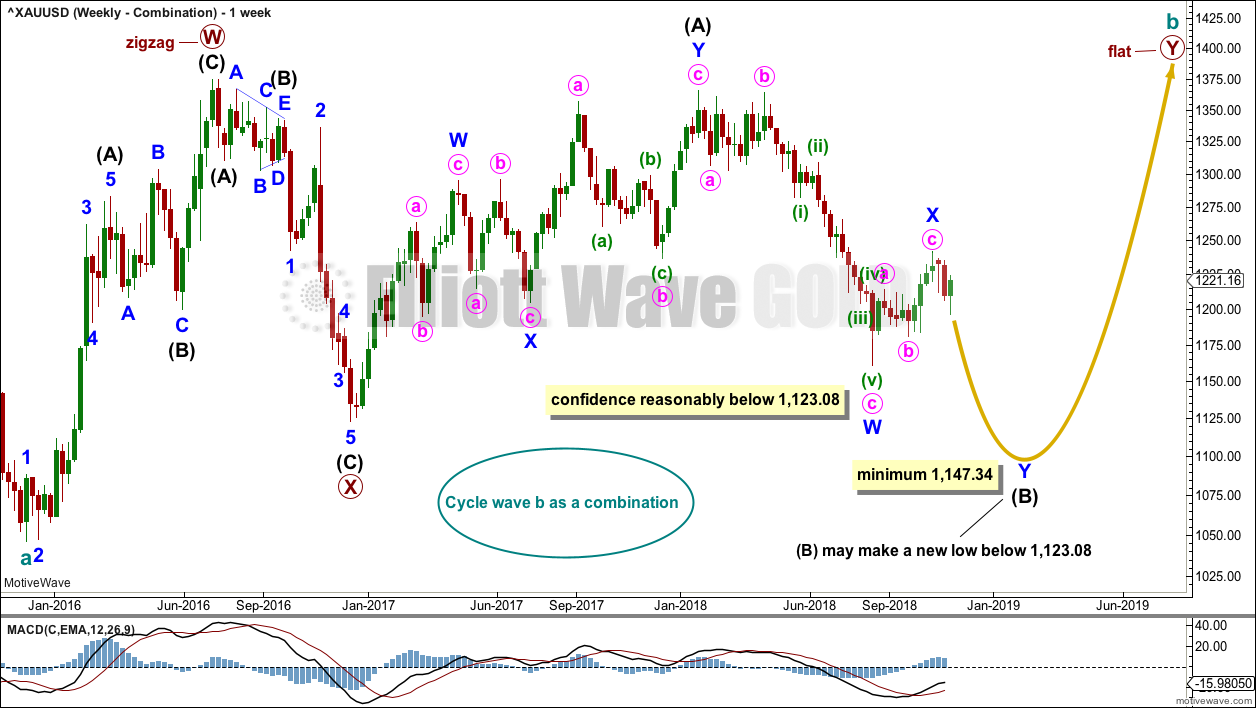
WEEKLY CHART – COMBINATION
Click chart to enlarge.
If cycle wave b is a combination, then the first structure in a double may be a complete zigzag labelled primary wave W.
The double may be joined by a three in the opposite direction, a zigzag labelled primary wave X.
The second structure in the double may be a flat correction labelled primary wave Y. My research on Gold so far has found that the most common two structures in a double combination are one zigzag and one flat correction. I have found only one instance where a triangle unfolded for wave Y. The most likely structure for wave Y would be a flat correction by a very wide margin, so that is what this wave count shall expect.
Within a flat correction for primary wave Y, the current downwards wave of intermediate wave (B) may be a double zigzag. Intermediate wave (B) must retrace a minimum 0.9 length of intermediate wave (A) at 1,147.34. Intermediate wave (B) may move beyond the start of intermediate wave (A) as in an expanded flat.
Because the minimum requirement for intermediate wave (B) is not yet met, this wave count requires that intermediate wave (B) continues lower. This is the most immediately bearish of all four weekly wave counts.
When intermediate wave (B) is complete, then intermediate wave (C) would be expected to make at least a slight new high above the end of intermediate wave (A) at 1,365.68 to avoid a truncation. Primary wave Y would be most likely to end about the same level as primary wave W at 1,374.91, so that the whole structure takes up time and moves price sideways, as that is the purpose of double combinations.
While double combinations are very common, triples are extremely rare. I have found no examples of triple combinations for Gold at daily chart time frames or higher back to 1976. When the second structure in a double is complete, then it is extremely likely (almost certain) that the whole correction is over.
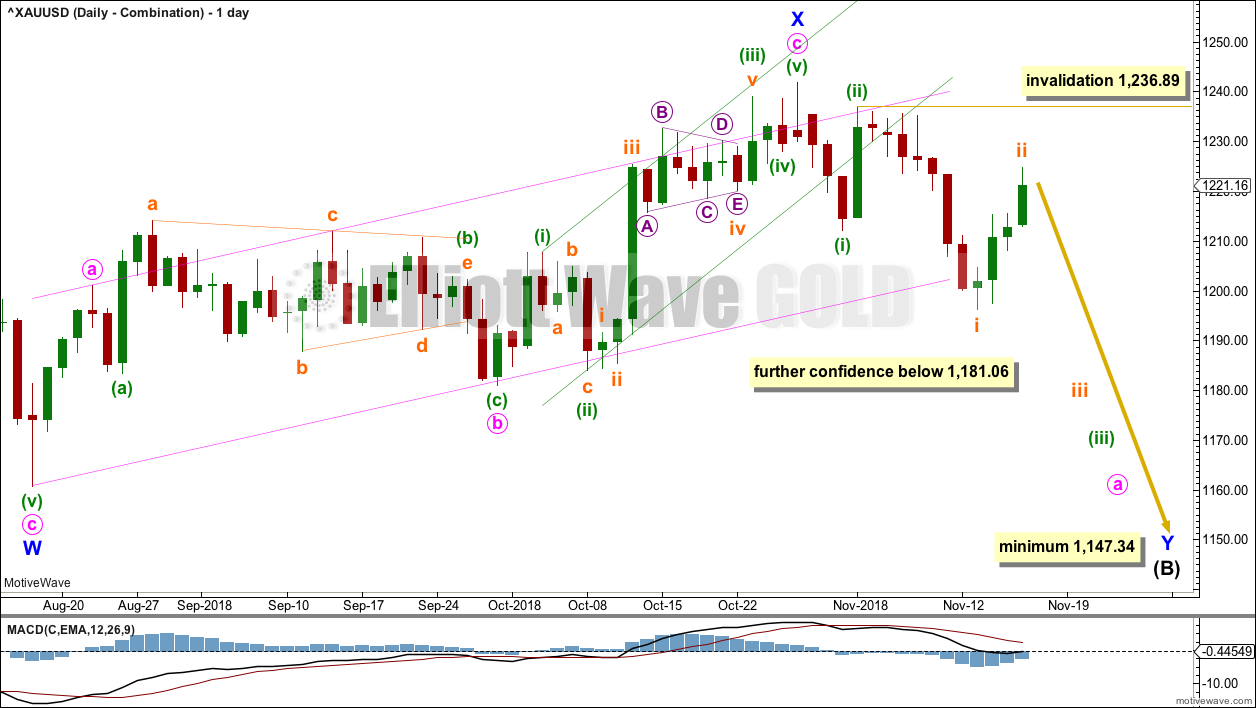
DAILY CHART – COMBINATION
Click chart to enlarge.
Minor wave X may be complete.
Minor wave Y may be underway for this wave count to continue lower to a minimum at 1,147.34. Minor wave Y may last a few weeks.
A new low below 1,181.06 would provide confidence in this wave count.
Within minor wave Y, minute wave a would be an incomplete five wave impulse. Within minute wave a, minuette waves (i) and (ii) may be complete. Minuette wave (iii) may only subdivide as an impulse.
Within minuette wave (iii), subminuette wave i may be complete. Subminuette wave ii may end on Monday. Subminuette wave ii may not move beyond the start of subminuette wave i above 1,236.89.
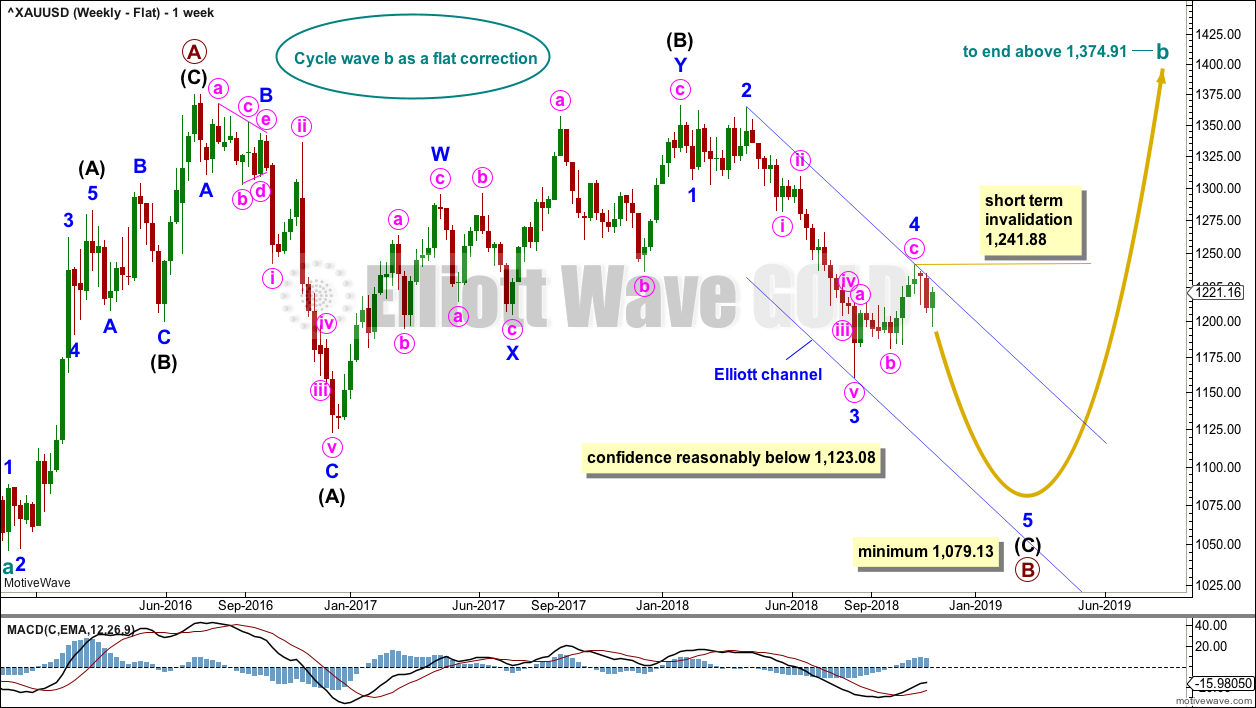
WEEKLY CHART – FLAT
Click chart to enlarge.
It is possible that cycle wave b may be a flat correction. Within a flat correction, primary wave B must retrace a minimum 0.9 length of primary wave A at 1,079.13 or below. Primary wave B may make a new low below the start of primary wave A at 1,046.27 as in an expanded flat correction.
Only a new low reasonably below 1,123.08 would provide reasonable confidence in this wave count.
Intermediate wave (C) must subdivide as a five wave structure; it may be unfolding as an impulse. Within intermediate wave (C), minor waves 1 through to 4 may be complete. Within minor wave 5, no second wave correction may move beyond its start above 1,241.88.
The blue channel is drawn using Elliott’s second technique. Minor wave 5 may end at support about the lower edge of this channel.
Minor wave 2 was a double zigzag lasting nine weeks. Minor wave 4 exhibits little alternation as a single zigzag and reasonable proportion lasting ten weeks.
TECHNICAL ANALYSIS
WEEKLY CHART
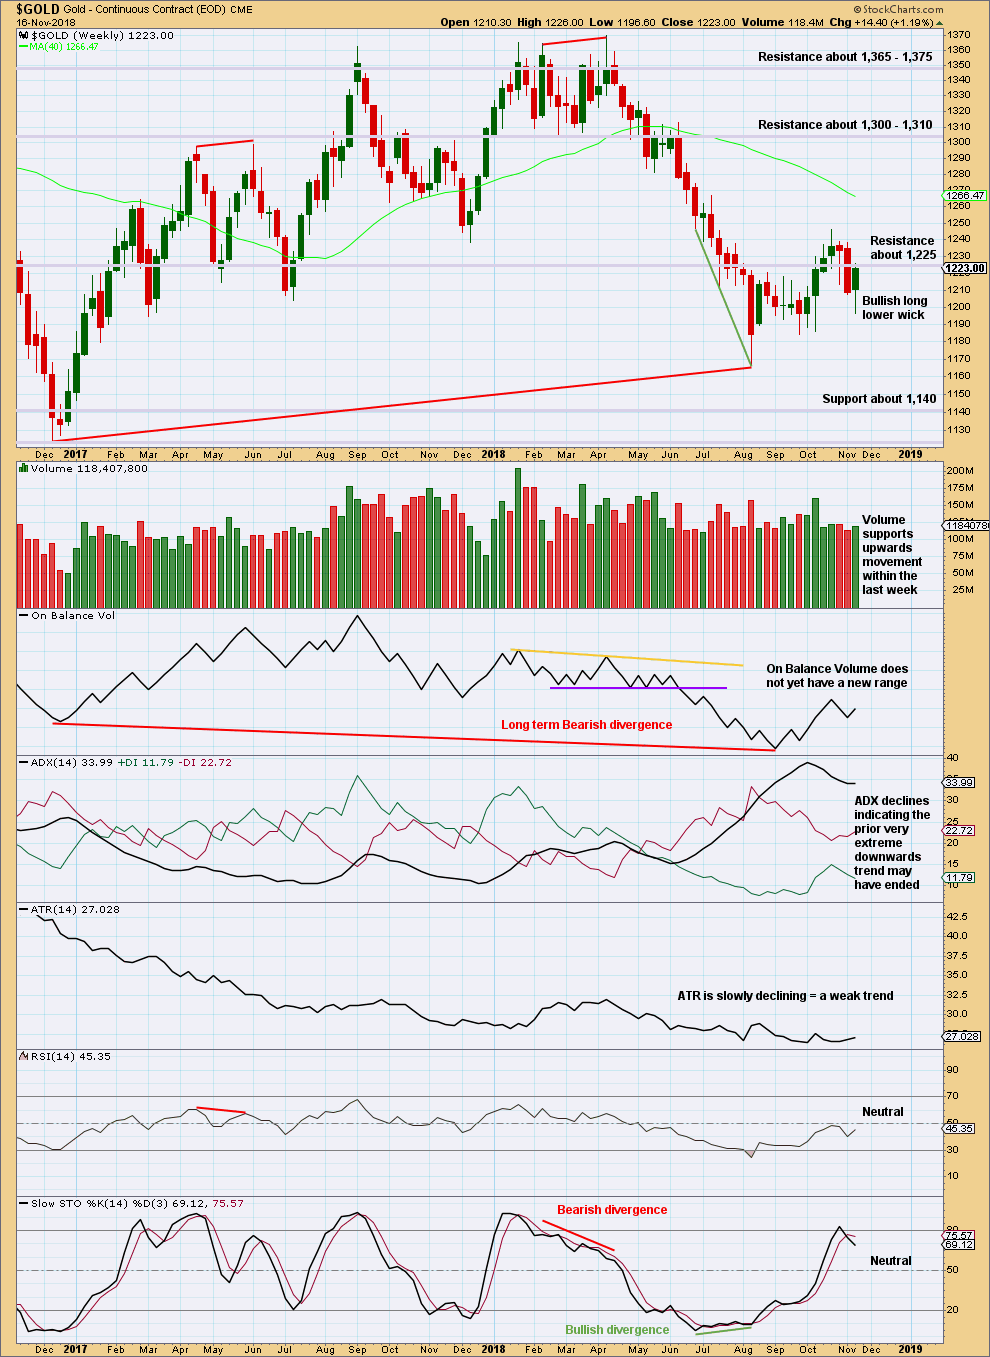
Click chart to enlarge. Chart courtesy of StockCharts.com.
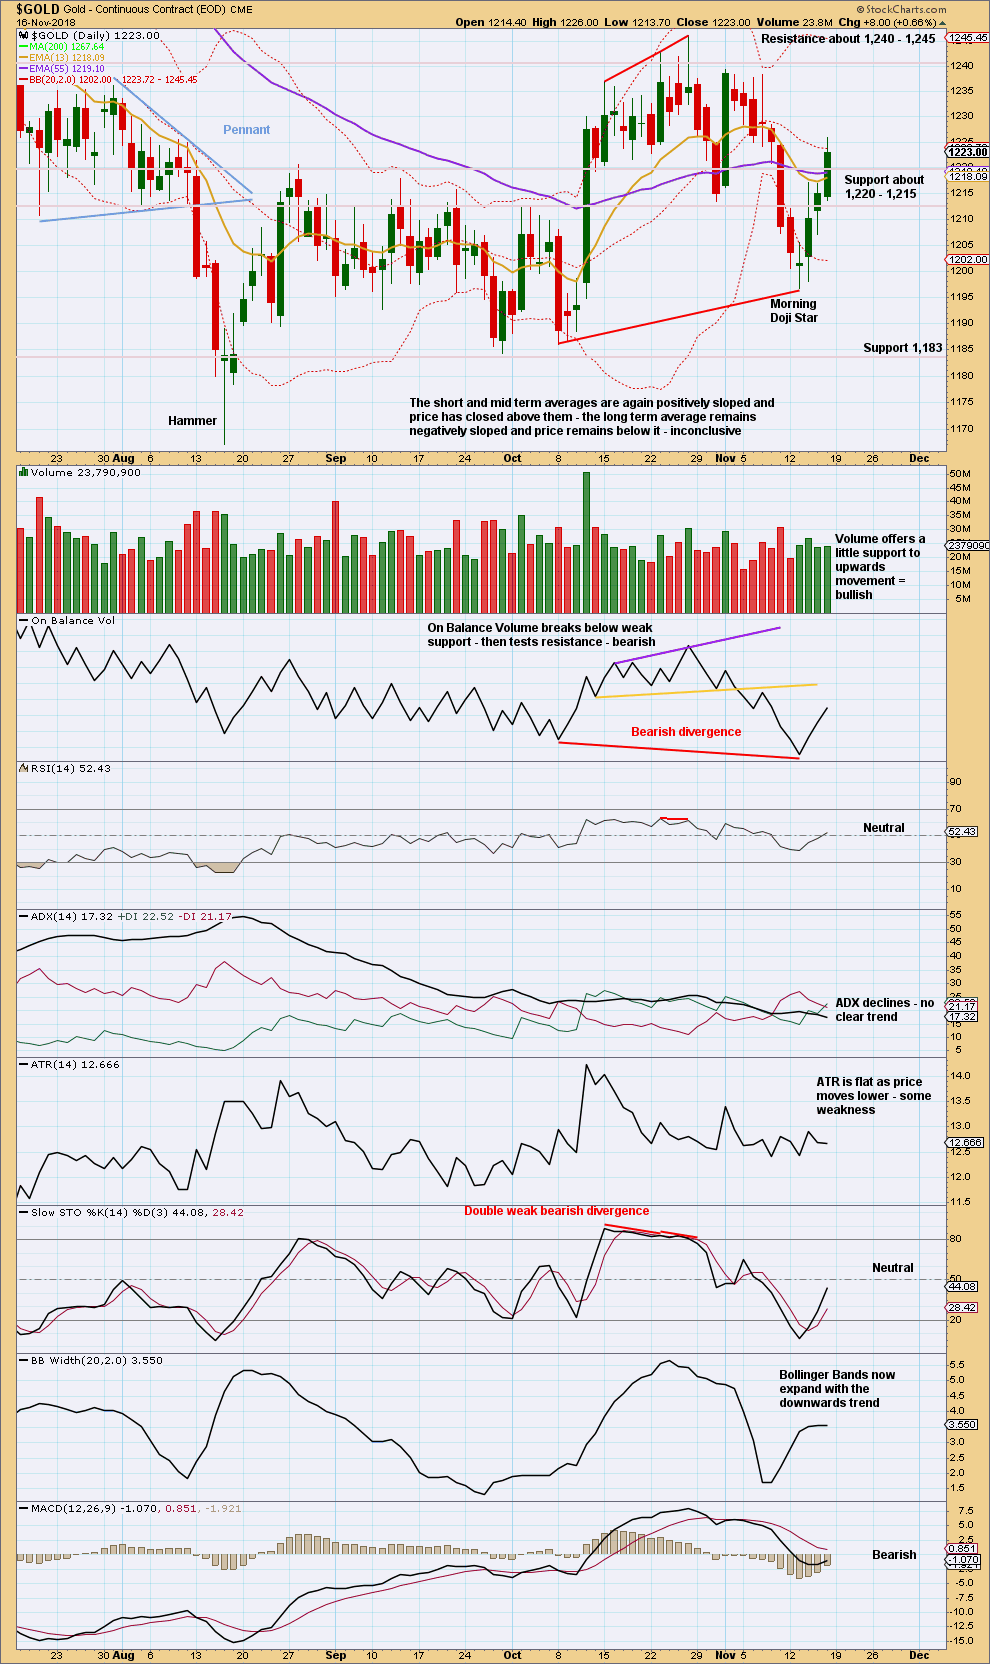
On Balance Volume has made a lower low than its prior low at the end of November 2015. This divergence is extremely bearish but does not rule out a consolidation unfolding here; the divergence does strongly support the Triangle wave count, which expects a consolidation or bounce up to test resistance now and then a continuation of a major bear market. It could also support the flat wave count that allows for a new low below 1,046.27 in coming months.
This weekly candlestick closes green. The balance of volume during the week was upwards. Upwards movement within the week has support from rising volume. This is bullish. The long lower candlestick wick this week indicates the pullback may be over.
DAILY CHART
Click chart to enlarge. Chart courtesy of StockCharts.com.
What looked like a downwards breakout below support on the 9th of November is now proven to be false as price has closed back above resistance at 1,215 on an upwards day that has some support from volume.
It now looks like Gold may be within a larger consolidation with resistance about 1,240 – 1,245 and support about 1,195 – 1,183. Price is swinging from resistance to support and back again, with Stochastics reaching overbought when price reached resistance and oversold when price reached support.
Currently, price is bouncing up off support which was found about 1,195. Look for overall upwards movement to continue towards 1,240 – 1,245 and only stop when Stochastics reaches overbought. Do not expect price to move in a straight line.
A close above resistance at 1,245 would be an upwards breakout. For confidence it would require support from volume.
GDX WEEKLY CHART
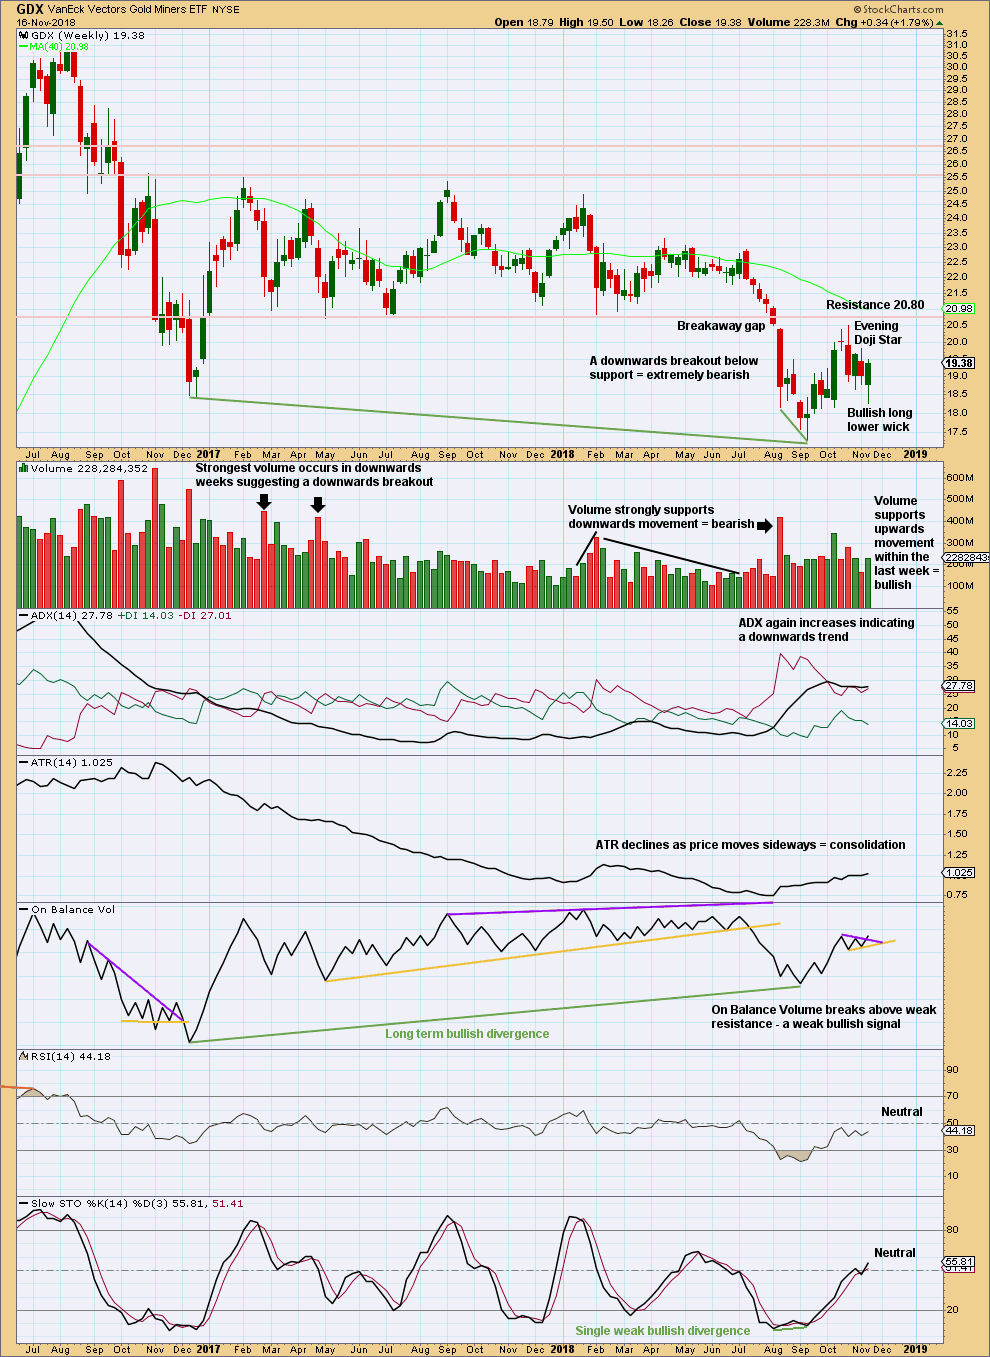
Click chart to enlarge. Chart courtesy of StockCharts.com.
GDX had a large consolidation that lasted from January 2017 to August 2018. A downwards breakout below support at 20.80 in early August 2018 is highly significant. The breakout had support from volume, which adds confidence.
The target is at 16.02.
GDX DAILY CHART
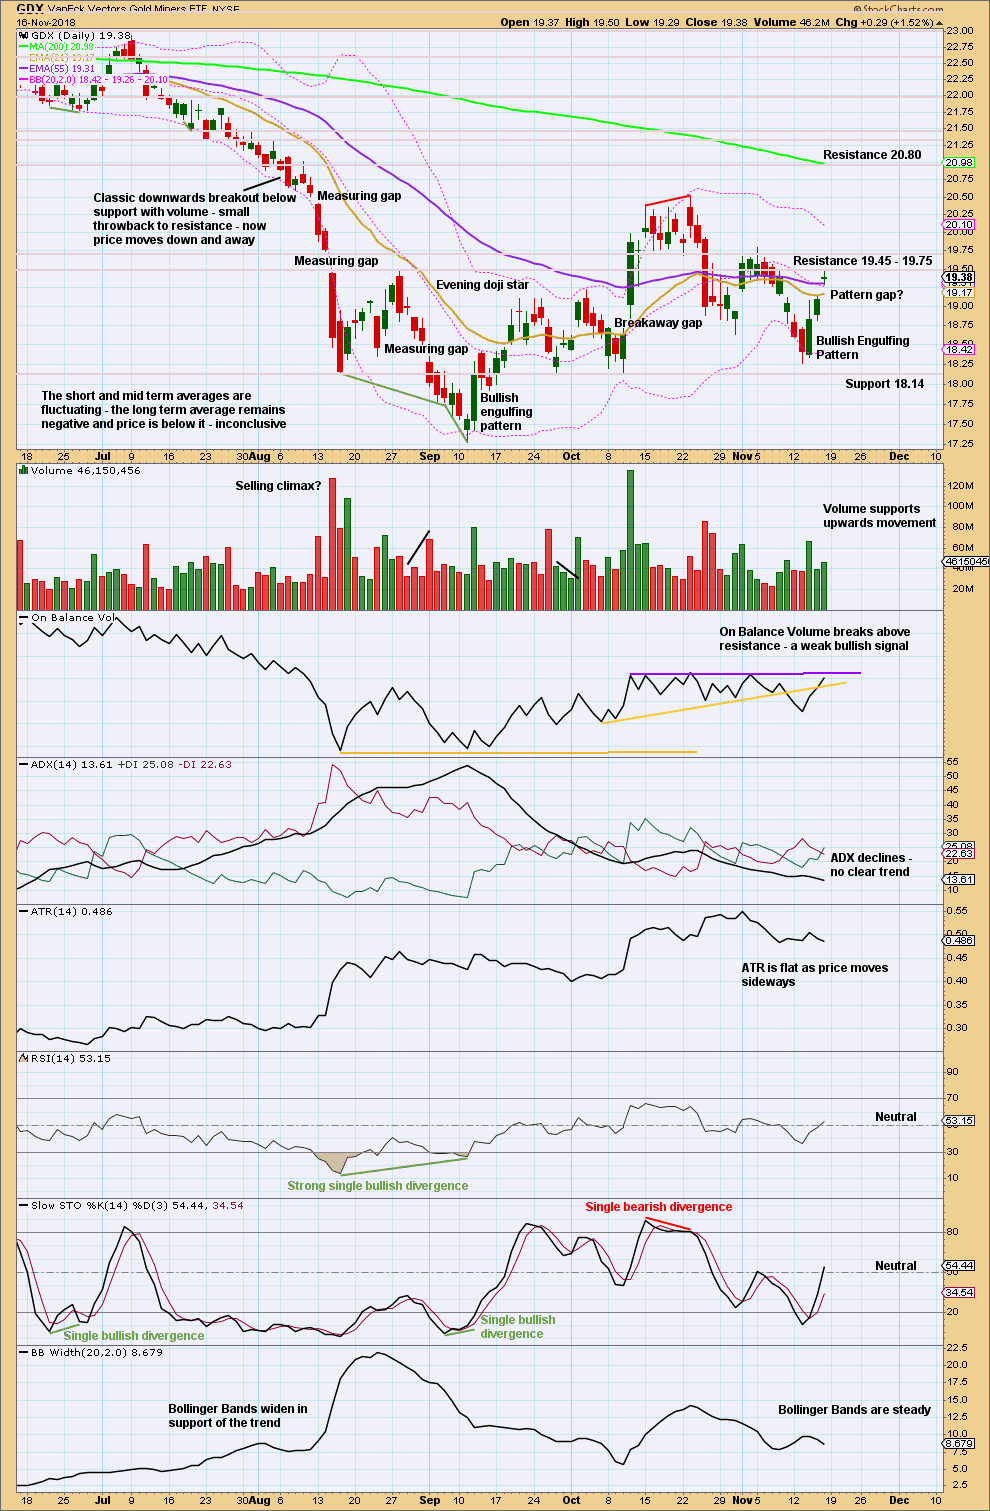
Click chart to enlarge. Chart courtesy of StockCharts.com.
If resistance here is overcome, then next resistance is just above about 19.45 – 19.75.
US OIL
It was expected that while price remained within a channel drawn on the daily chart that price would continue to fall. A new low below 55.24 was a very bearish signal.
Summary: Oil is in a downwards trend. A new low now below 51.67 would be another very strong bearish signal. If that happens, then the probability that Oil may continue to move reasonably below 26.06 would increase.
Classic analysis still favours a bearish Oil wave count.
MAIN ELLIOTT WAVE COUNT
MONTHLY CHART
Click chart to enlarge.
Classic technical analysis favours a bearish wave count for Oil at this time.
The large fall in price from the high in June 2008 to February 2016 is seen as a complete three wave structure. This large zigzag may have been only the first zigzag in a deeper double zigzag.
The first zigzag down is labelled cycle wave w. The double is joined by a now complete three in the opposite direction, a zigzag labelled cycle wave x.
The purpose of a second zigzag in a double is to deepen the correction when the first zigzag does not move price deep enough. Cycle wave y would be expected to move reasonably below the end of cycle wave w to deepen the correction. Were cycle wave y to reach equality with cycle wave w that takes Oil into negative price territory, which is not possible. Cycle wave y would reach 0.618 the length of cycle wave w at $2.33.
A better target calculation would be using the Fibonacci ratios between primary waves A and C within cycle wave y. This cannot be done until both primary waves A and B are complete.
Within cycle wave y, no second wave correction nor B wave may move beyond its start above 76.90.
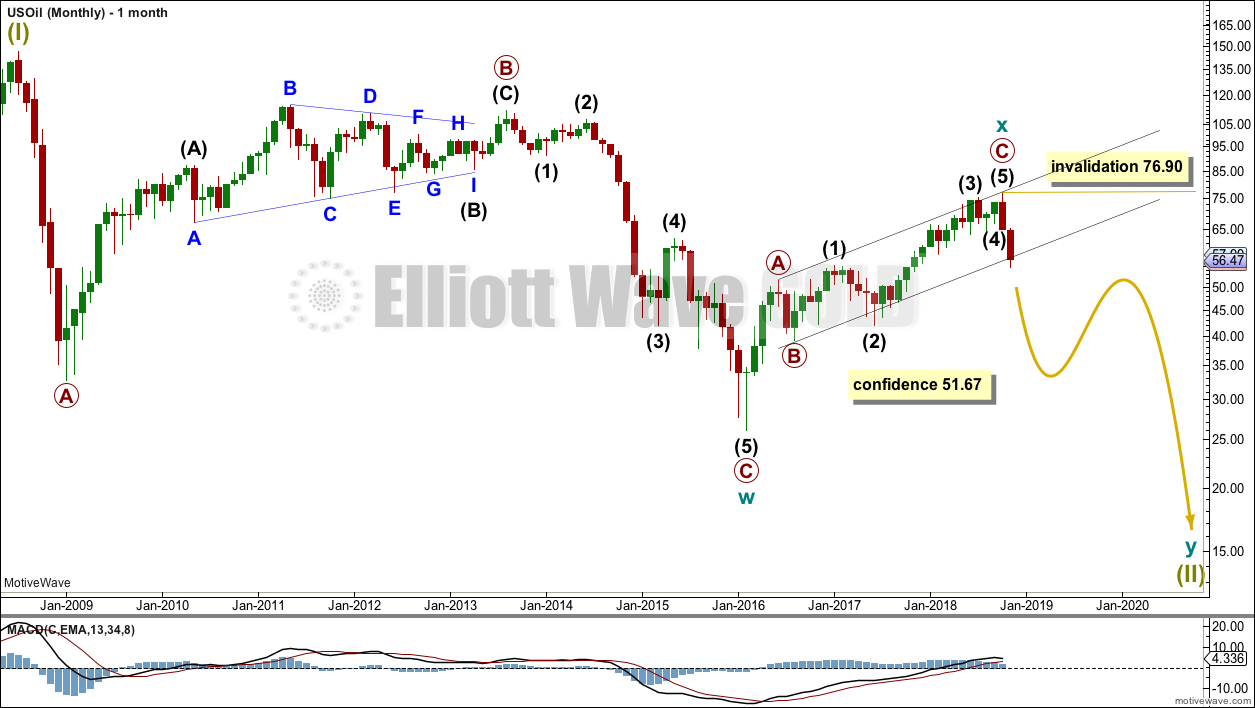
WEEKLY CHART
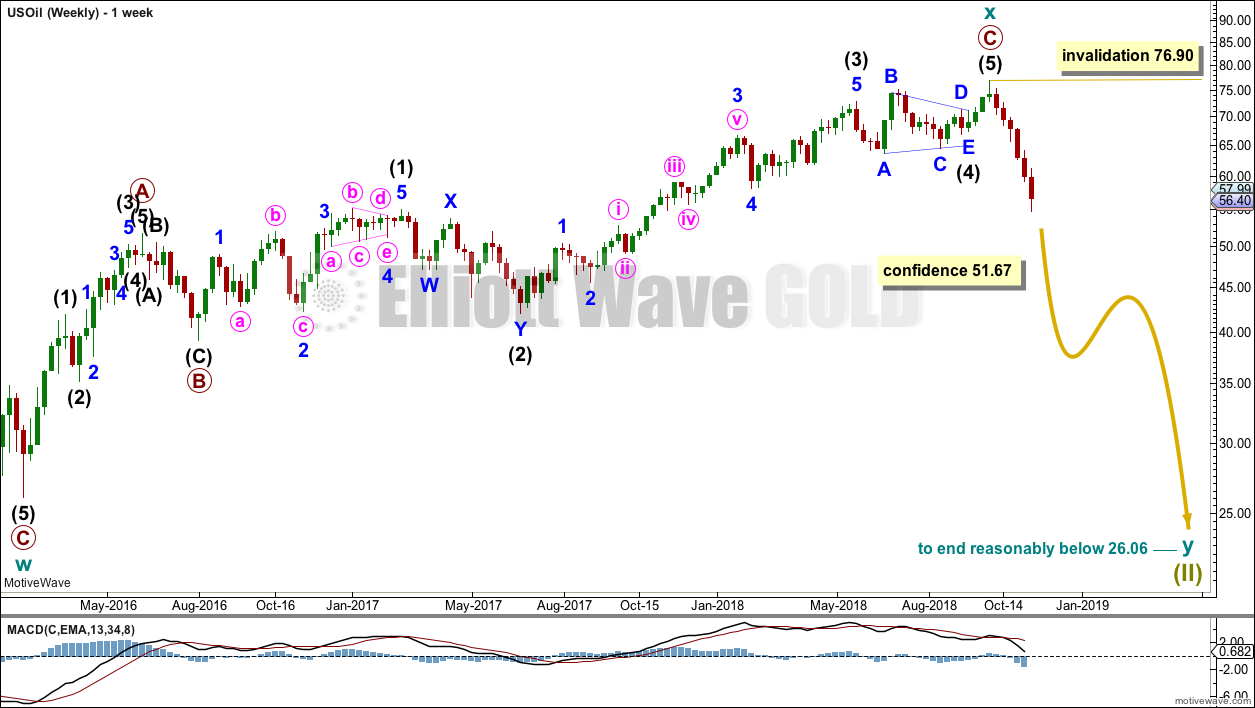
Click chart to enlarge.
Cycle wave x is seen as a complete zigzag. Within the zigzag, primary wave C is a five wave impulse and within it intermediate wave 4 is a triangle.
A new low below 51.67 would add confidence in this bearish wave count. At that stage, the bullish alternate below would be invalidated.
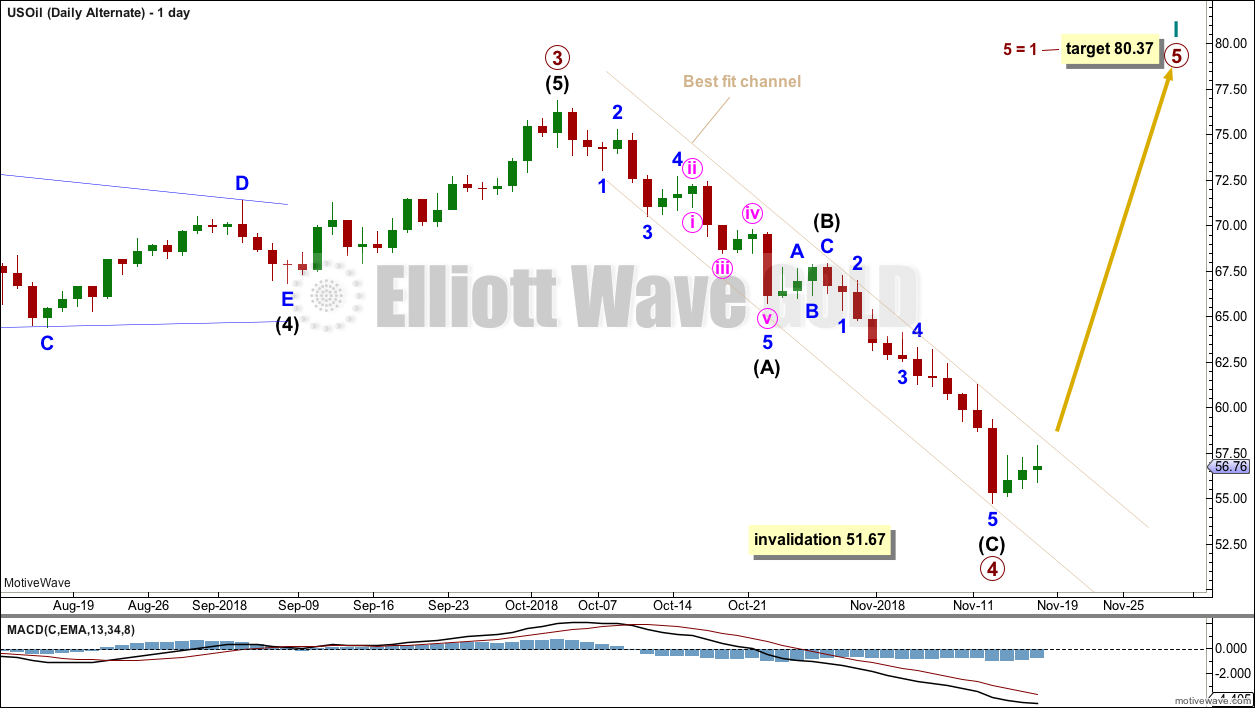
DAILY CHART
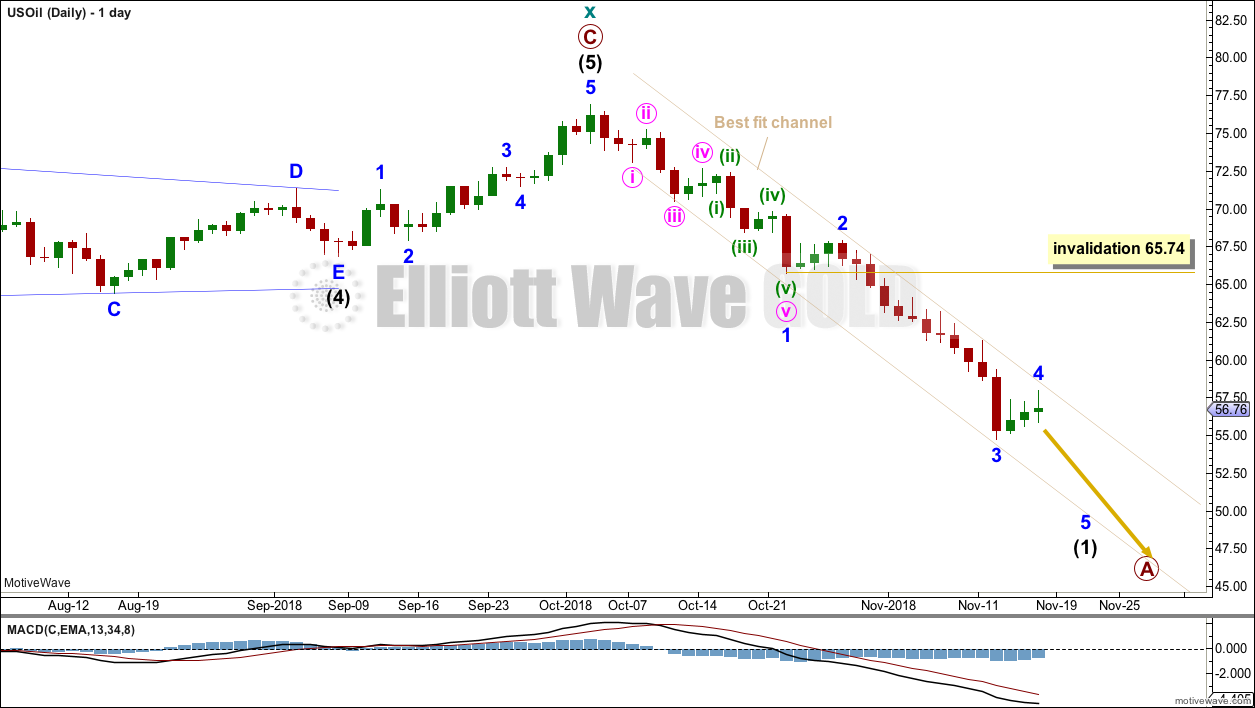
Click chart to enlarge.
Attention now turns to the structure of downwards movement. An impulse is unfolding lower.
Minor wave 3 is longer than minor wave 1 and does not exhibit a Fibonacci ratio to minor wave 1.
Minor wave 4 may remain contained within the best fit channel. Minor wave 4 may not move into minor wave 1 price territory above 65.74. If the upper edge of the channel provides resistance here, then minor wave 4 should be over on Friday and next week should begin with downwards movement.
If price moves above 65.74 prior to making new lows, then this wave count would be changed to see intermediate wave (1) complete. The invalidation point would then move up to 76.90. Intermediate wave (2) may not move beyond the start of intermediate wave (1).
ALTERNATE ELLIOTT WAVE COUNT
MONTHLY CHART
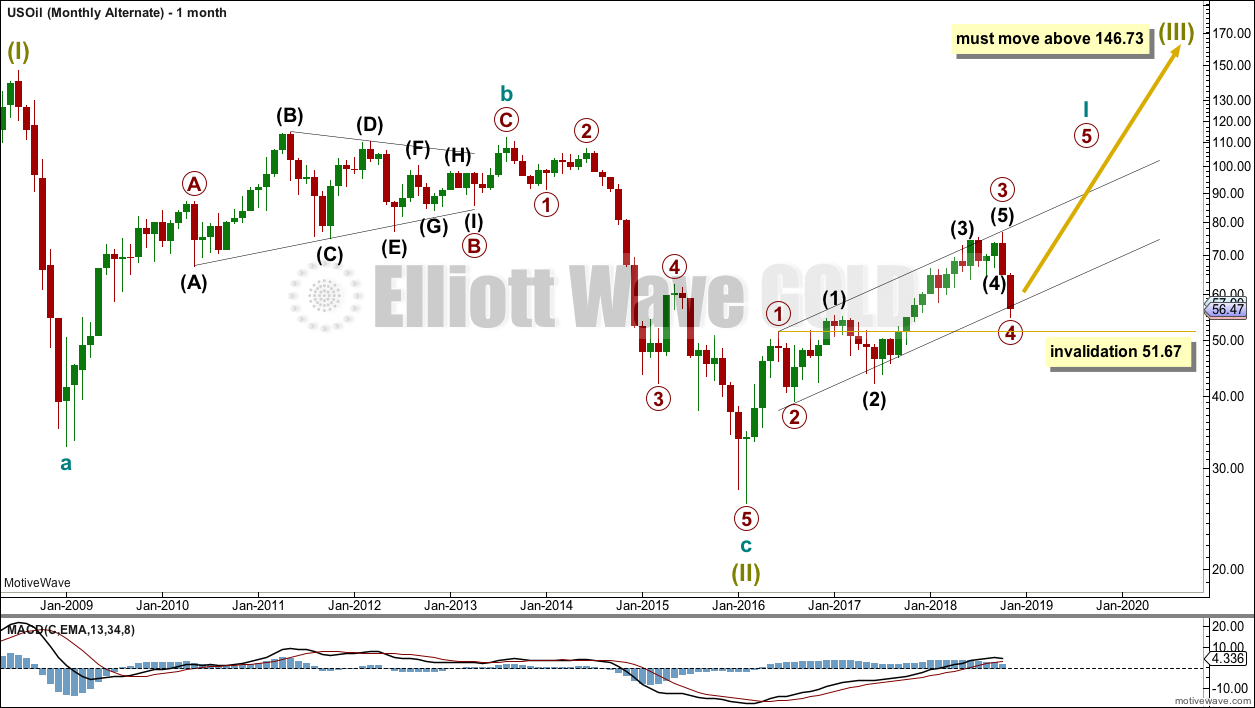
Click chart to enlarge.
All the subdivisions for both wave counts are the same, but by changing the degree of labelling a very different wave count is seen.
If the degree of labelling for the large zigzag down to the last low is moved up one degree, it may have been the end of a correction labelled Super Cycle wave (II). Super Cycle wave (III) may have begun.
Within Super Cycle wave (III), cycle wave I would be an incomplete impulse.
Within cycle wave I, primary waves 1 through to 3 may be complete. The current strong downwards movement may be primary wave 4. Primary wave 4 may not move into primary wave 1 price territory below 51.67.
WEEKLY CHART
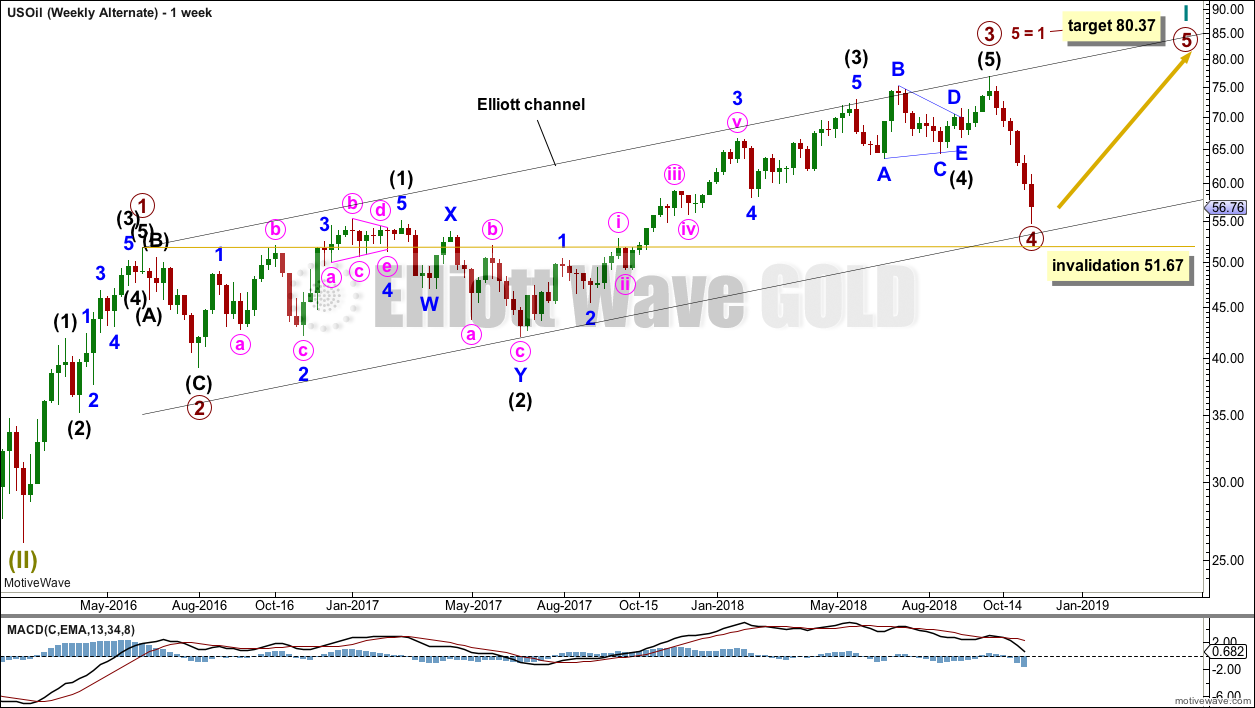
Click chart to enlarge.
This wave count sees the subdivisions of upwards movement from the low in February 2016 in the same way. A-B-C of a zigzag subdivides 5-3-5, exactly the same as 1-2-3 of an impulse.
Primary wave 3 may have been complete at the last high. Primary wave 4 may be unfolding as a zigzag. Zigzags can be relatively quick structures. This is possible.
However, primary wave 2 was a zigzag. There would be no alternation in structure between primary waves 2 and 4. This reduces the probability of this wave count.
DAILY CHART
Click chart to enlarge.
If this downwards movement in price is primary wave 4, then it should be over here or very soon. It is possible to see a zigzag complete at the last low.
However, there is no candlestick reversal pattern and the last three green daily candlesticks are all small range days. This upwards movement looks too weak to be considered the start of a new trend; it looks much more likely to be a small counter trend bounce. Classic technical analysis does not support this wave count.
TECHNICAL ANALYSIS
MONTHLY CHART
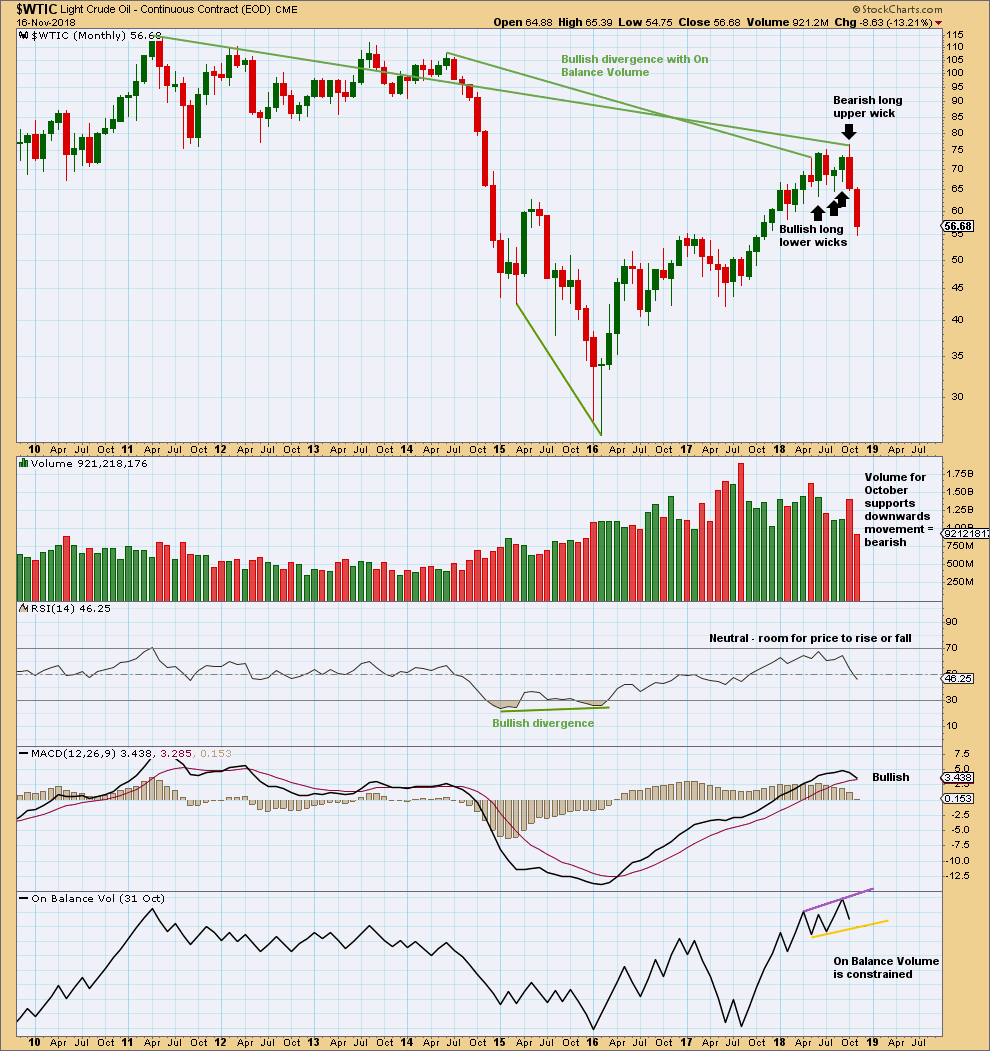
Click chart to enlarge. Chart courtesy of StockCharts.com.
The larger trend remains upwards.
With a long upper candlestick wick and support from volume, the last completed month of October is bearish. On its own, this is not an indication of the end of the upwards trend though; it is noted that August 2017 was similar yet price continued higher.
However, the month of October also completes a Bearish Engulfing candlestick pattern. This is a strong reversal pattern. This strong reversal pattern is now being followed by more downwards movement. Now it does look like there may have been a trend change.
Bullish divergence between price and On Balance Volume remains, and is still a strong technical indicator that price may continue upwards to make new highs.
WEEKLY CHART
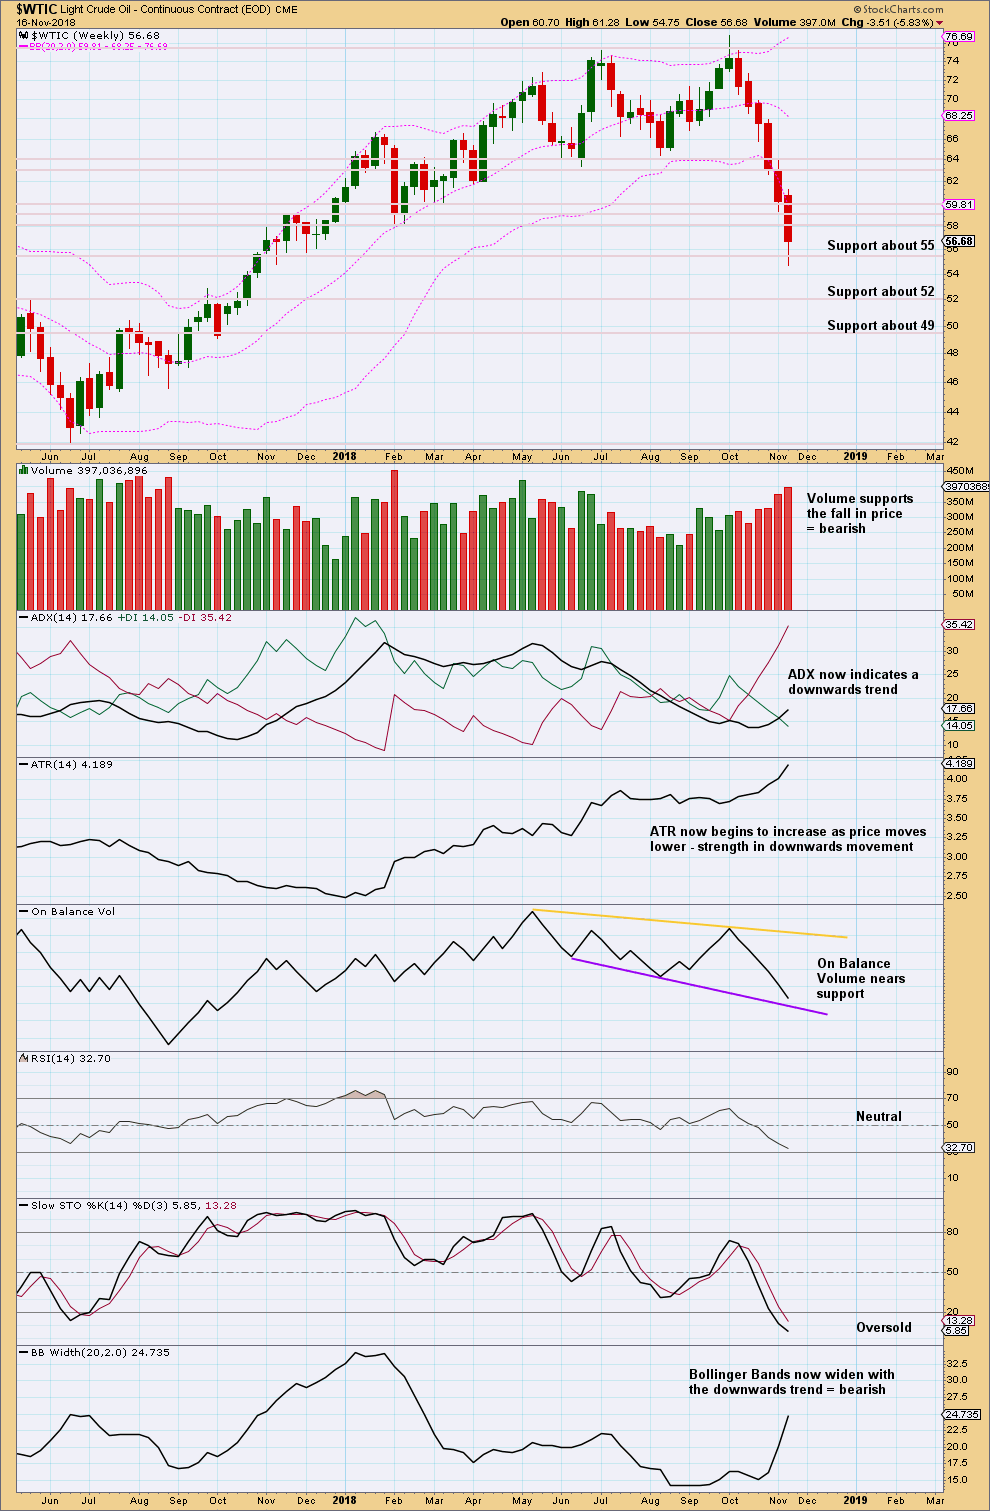
Click chart to enlarge. Chart courtesy of StockCharts.com.
There is still plenty of room for this downwards trend to continue.
At this stage, only Stochastics is now extreme and all other indicators are not yet oversold or extreme.
With volume continuing to support downwards movement, expect price to continue to fall. Only consider a low is in place if there is a bullish candlestick reversal pattern on the weekly or daily chart.
DAILY CHART
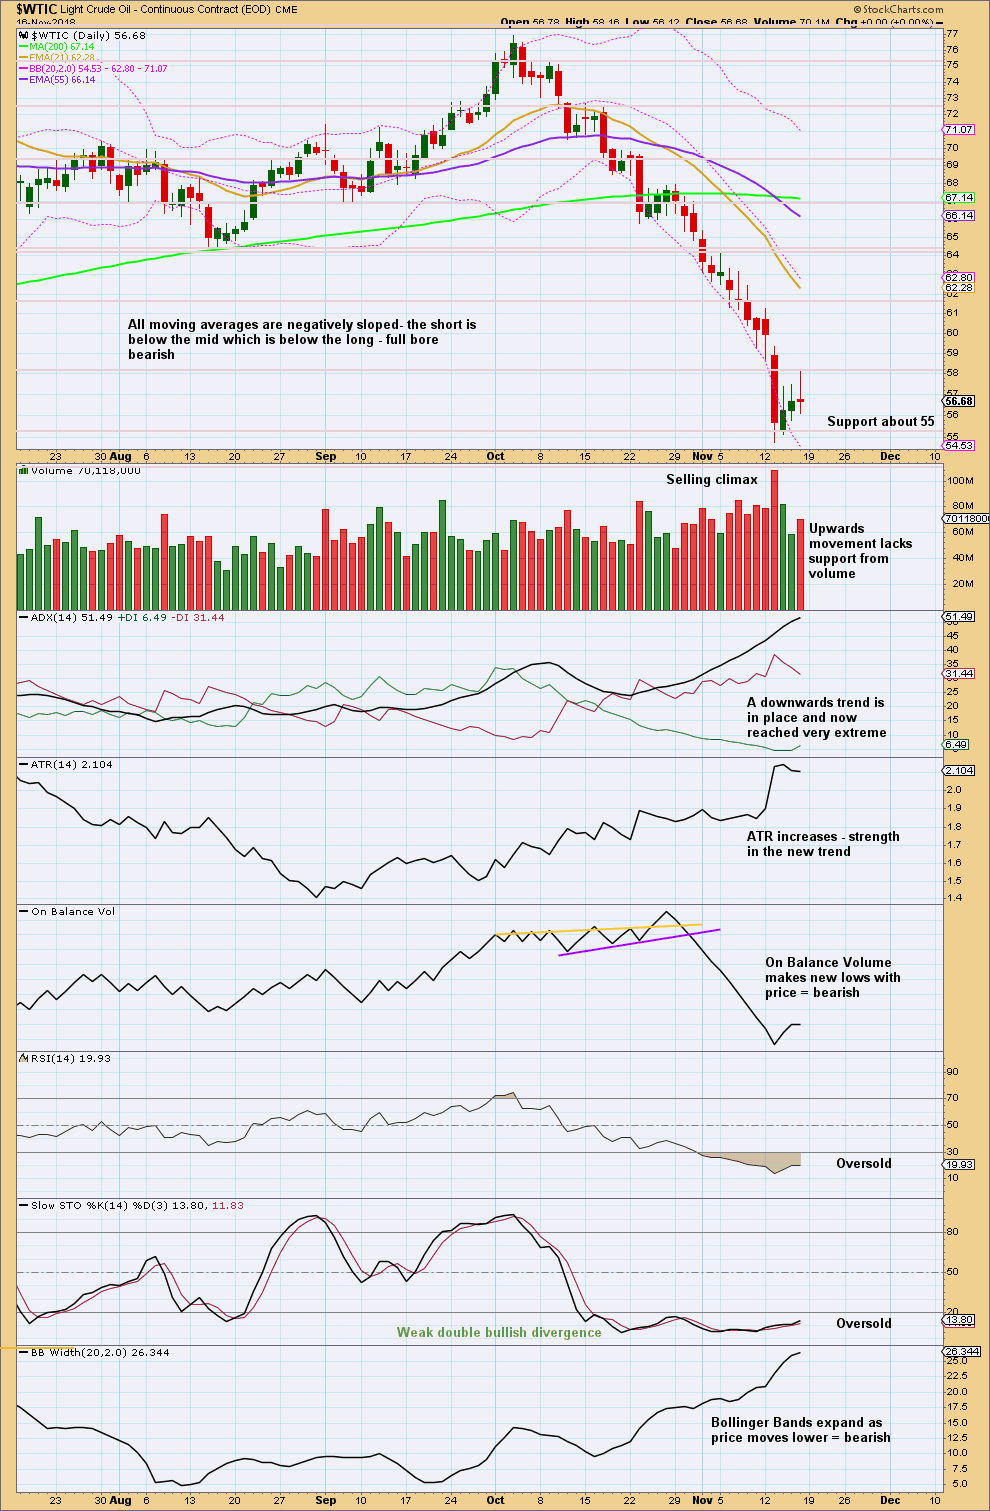
Click chart to enlarge. Chart courtesy of StockCharts.com.
I have taken some time to look back at the last strong bearish trend from Oil from about May 2014 to January 2016. I have noticed that downwards waves often end with support from volume, and sometimes do not even end with a long lower wick. Bullish reversal patterns are often but not always found at lows. RSI can reach very extreme and remain so for as long as three months when this market has a strong downwards trend. At lows Stochastics often will exhibit bullish divergence, but this can be rather weak. At lows RSI sometimes, not always, exhibits bullish divergence and can remain deeply oversold for long periods of time.
US Oil is a particularly difficult market to find lows in. It can trend strongly for very long periods of time with indicators remaining very extreme.
At this time, there is now clearly a downwards trend in place. This could continue for months yet. While price remains within the channel on the daily Elliott wave chart, expect it to continue to fall.
Expect that a low has been found only if a bullish candlestick reversal pattern appears, or the channel is clearly breached. But note that even if these occur, that any bounce may still be short lived.
The selling climax of the 13th of November does not mean that a low may be in place. This selling climax may now be relieved by three days of a shallow bounce.
—
Always practice good risk management as the most important aspect of trading. Always trade with stops and invest only 1-5% of equity on any one trade. Failure to manage risk is the most common mistake new traders make.
I am going to have to please ask members to note the market you are referring to when you make a comment or ask a question.
We have three markets in this analysis. I don’t want to be guessing or assuming your question / comment refers to a specific market.
Any further questions which are not clear will need to be made clear before I answer.
Hello Lara any thoughts on the $BPENER S&P Energy Bullish Percent Index do you use it as an indicator at all for oil?
No, I don’t use it. I have no thoughts on it.
I just checked to see if there was a correlation between $BPENER and either of S&P500 or $WTIC. There is no reliable correlation for either.
If there is no reliable correlation then the markets do not have a reliable relationship. Without a reliable relationship it’s pointless to assume one market should move in a particular direction based upon the other market.
Thank you for that Lara your input is much appreciated 🙂
Hi Lara
Would it be possible to get an interim update considering the significant movement in Oil we have seen today?
Sure.
Okay, this is how to use this wave count at this time:
At yesterday’s low it is possible that intermediate wave (1) could now be over.
Within the impulse, minor waves 2 and 4 look right. There’s nice proportion. Minor wave 3 is longer than minor wave 1 but there’s no Fibonacci ratio between them.
While minor wave 5 continues then within it no second wave correction may move beyond the start of its first wave above 57.96.
And so:
If price breaks out of the channel with upwards movement, and then if price makes a new high above 57.96, it can’t be just a second wave correction within minor 5, so minor 5 would have to be over.
If that happens then the probability that intermediate (1) is over would be very high.
If that happens then the invalidation point moves up to 76.90. Look then for a multi week bounce / consolidation for intermediate (2).
I hope this makes sense?
While price remains within the channel and below 57.96 this wave count remains valid, and we should expect more downwards movement.
Look out for another possible selling climax. Minor 5 could be typical of a fifth wave in commodities, it could exhibit strength.
Very clear, and I like your points on how to read the chart and manage trades
Lara,
Upside is going to need to prove itself before I commit. The monthly, weekly and daily EWO are moving lower. The 13 and 34 ema both weekly and daily are moving lower. I’m risking 3% once price reaches 13 34 ema daily averages. In other words I placed a short if Friday’s low is taken out lower.
As for oil I’m bearish but price is still to far away from 13 34 ema. I’d like to see 1 more push higher.
Hope I’m right follow the crowd.
Fair enough. And I assume you’re speaking of Gold in the first part of your comment?
It is a weak trend, if it is a new trend.
I guess I left that out. S&P sorry. Today I’m short S&P due to falling 13 and 34 ema.
Hi Lara,
Currently , it looks like the Wave 5 is truncated since the high was on September 21st….
is this right or it is a labeling mistake?
Thanks
Mathieu
I am so sorry, that is my mistake. I left the label as Motive Wave put it, and didn’t check it was right.
It’s wrong. I’m moving primary 3 over to the swing high prior, the all time high.
That makes intermediate (A) a good looking five.
no problem… that’s what I thought 🙂 … Thanks for everything.
Hi Lara,
Thanks for the alternate weekly Elliott Wave count on the S&P 500… I have a question… The S&P 500 hit an all time high on September 21st… The 4 month minimum would put it on January 21st…. For Larry’s analysis on the AD line, is it a requirement that it has to be a 4 month minimum OR it is just because the history showed that the smallest period of divergence was 4 months before a bear market starts?
Thanks again for the excellent analysis,
Mathieu
I just took a look at the AD Line…. That one hit a high on August 29th… Is the 4 month minimum from the top of the AD line or the top in price?
Thanks
Mathieu
I believe it is from the top of the AD Line.
Thanks Rodney…. This means minimum of end of December like Lara said…
Thanks guys, my question answered.
Yes, it’s a minimum of 4 months divergence between price and the AD line. So it starts to count from the last all time high of the AD line.
This is only because Lowry’s nearly 100 years of analysis of market breadth has found that every single bear market in that time has been preceded by a minimum 4 months divergence between price and the AD line.
I’m going to assume the pattern of the last nearly 100 years remains in place, and not assume a new once in 100 years event here.
Lara hi,
Previously on gold, you wrote that if it goes below 1201 the triangle becomes invalidated ….it went below 1200… why do you still offer triangle and moreover as main wave count????
Invalidated at the daily chart level, not the weekly.
That means the way I had the start of primary wave E was invalidated. Not the entire triangle.
I have it still as the main preferred wave count because what looked like a downwards breakout has proven to be false, and price is still in a weak upwards trend since the 16th of August: a series of higher highs and higher lows remains in place.