

S&P 500
A quiet end to a short-trading week makes little difference to all five Elliott wave counts.
Classic technical analysis mostly favours the first presented Elliott wave count.
Summary: For the short term, a low may be in place if the teal trend line offers support. A target for the next wave up is either 2,843 or 2,975. Have some confidence in this view if price makes a new high above 2,685.75.
The zigzag wave count is given a closer look today. It is possible that price may move lower to overshoot the teal channel. The target for a low is about 2,591.
Five daily charts today look at five different structures for primary wave 4, in order of probability (roughly): zigzag, triangle, combination, flat and double zigzag.
Primary wave 4 could be over. The alternate wave count outlines this possibility.
The biggest picture, Grand Super Cycle analysis, is here.
Last published monthly chart is here, video is here.
ELLIOTT WAVE COUNT
WEEKLY CHART
Click chart to enlarge.
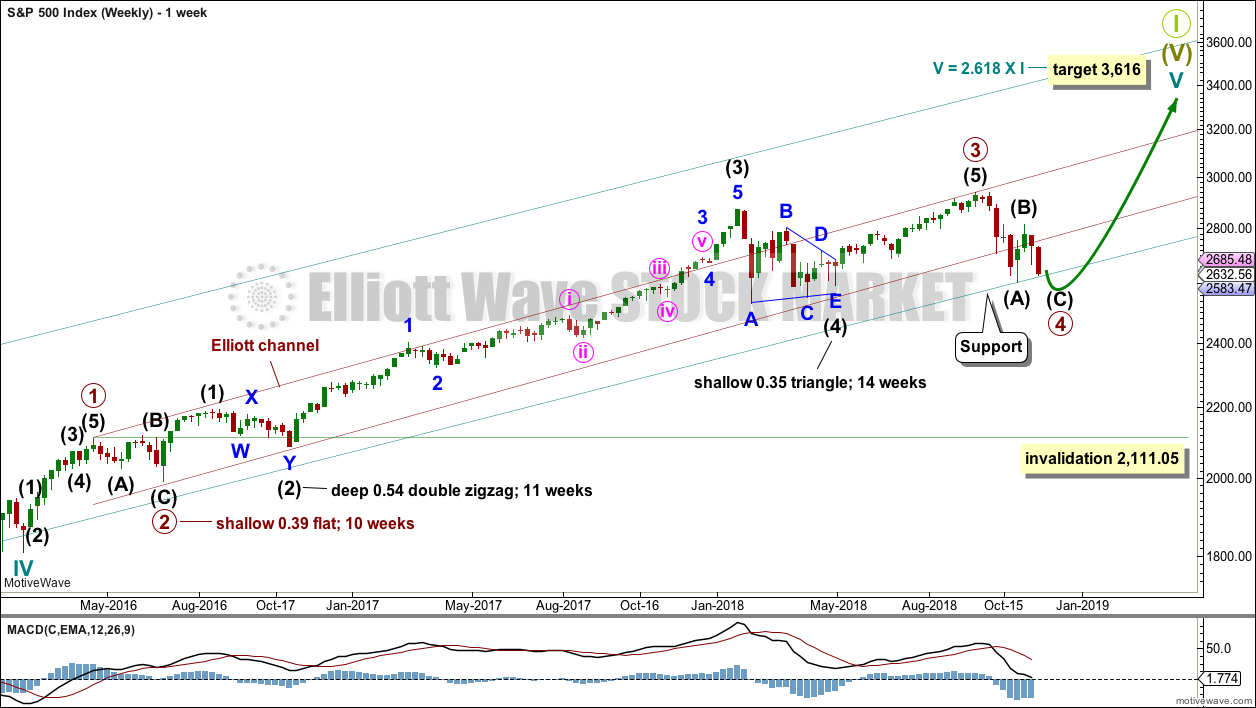
Cycle wave V must complete as a five structure, which should look clear at the weekly chart level and also now at the monthly chart level. It may only be an impulse or ending diagonal. It is clear it is an impulse.
Cycle wave V has passed equality in length with cycle wave I, and 1.618 the length of cycle wave I. The next Fibonacci ratio is used to calculate a target. When primary wave 4 is complete and the starting point for primary wave 5 is known, then the final target may also be calculated at primary degree. At that stage, there may be two targets, or the final target may widen to a small zone.
Within cycle wave V, the third waves at all degrees may only subdivide as impulses.
Within primary wave 3, there is perfect alternation and excellent proportion between intermediate waves (2) and (4).
The maroon channel is drawn about primary degree waves. The first trend line is drawn from the ends of primary waves 1 to 3, then a parallel copy is placed upon the low of primary wave 2. The overshoot of the upper edge of this channel by the end of intermediate wave (3) looks typical. For the S&P, its third waves are usually the strongest portion of an impulse; they often exhibit enough strength to overshoot channels.
Primary wave 4 may find very strong support about the lower edge of the teal channel, and it looks like this is from where price bounced on the 29th of October. This channel is copied over from the monthly chart and contains the entire bull market since its beginning in March 2009. While Super Cycle wave (V) is incomplete, this channel should not be breached at the weekly chart level.
Draw the teal channel from the high of cycle wave I at 1,343.80 on the week beginning 3rd July 2011, to the high of cycle wave III at 2,079.46 on the week beginning 30th November 2014, and place a parallel copy on the low of cycle wave II at 1,074.77 on the week beginning 2nd October 2011. Draw this chart on a semi-log scale. Price is right at the lower edge of this channel. This may provide support. A small overshoot, like that seen at the end of cycle wave IV, would be entirely acceptable. If price does move below the channel, then it should reverse reasonably quickly.
Primary wave 4 may not move into primary wave 1 price territory below 2,111.05.
At this stage, the expectation is for the final target to be met in October 2019. If price gets up to this target and either the structure is incomplete or price keeps rising through it, then a new higher target would be calculated.
At this stage, the various possible structures for primary wave 4 will be published as five separate daily charts, presented in order of probability (roughly).
DAILY CHART – ZIGZAG

Click chart to enlarge.
Primary wave 4 may be unfolding as a single zigzag, which is the most common type of corrective structure. This would provide perfect alternation with the flat correction of primary wave 2.
Within the zigzag, intermediate wave (B) may be a complete structure, ending close to the 0.618 Fibonacci ratio of intermediate wave (A).
Intermediate wave (C) may now unfold lower as a five wave structure. Intermediate wave (C) would be very likely to end at least slightly below the end of intermediate wave (A) at 2,603.54 to avoid a truncation. It may end about support at 2,600.
Within intermediate wave (C), minor waves 1 through to 4 may be complete. If this labelling is correct, then minor wave 4 may not move into minor wave 1 price territory above 2,685.75. Minor wave 5 may be relatively short and brief; this structure could be complete as quickly as just one more session.
This wave count could expect a reasonably small overshoot of the teal trend channel if the labelling within intermediate wave (C) is correct.
If the lower edge of the teal channel is overshot, then it would most likely be followed by a fairly quick reversal, possibly even intraday. If the bull market remains intact, then it would be most likely that there would not be a full daily candlestick below the trend channel, and very unlikely for a full weekly candlestick to print below the channel.
DAILY CHART – TRIANGLE
Click chart to enlarge.
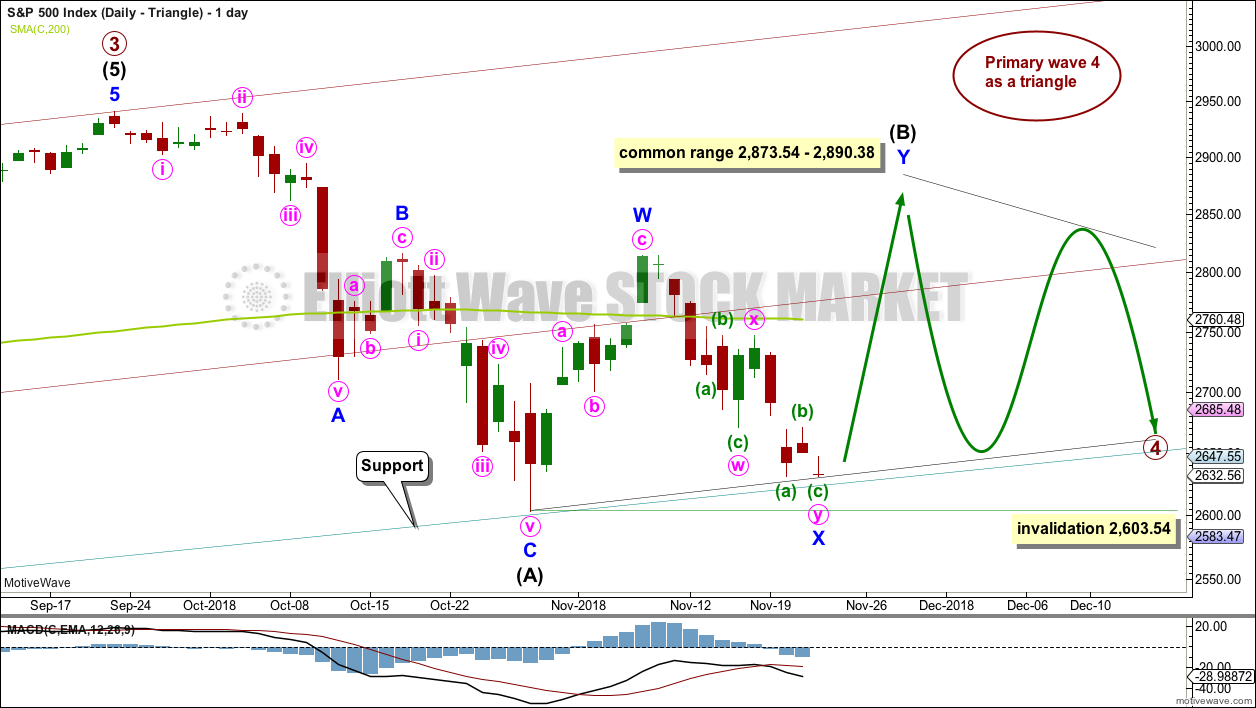
If primary wave 4 unfolds as a triangle, it would have perfect alternation with the regular flat correction of primary wave 2. It would also continue to find support about the lower edge of the teal trend channel. Triangles are fairly common structures for fourth waves. However, at this time, the triangle would have lasted nine weeks and would be less than half way complete. This wave count is looking less likely; if primary wave 4 continues to complete a triangle, then it would be much longer in duration than the 10 weeks of primary wave 2.
Price is almost right at the lower edge of the teal trend channel. This may provide enough support to halt the fall in price here.
If primary wave 4 is unfolding as a triangle, then within it intermediate wave (B) would most likely be incomplete. To label intermediate wave (B) over at the last swing high is possible, but it would look too shallow for a normal looking Elliott wave triangle.
Triangle sub-waves are often about 0.8 to 0.85 the length of the prior wave. This gives a target range for intermediate wave (B).
One triangle sub-wave may subdivide as a multiple; this is most often wave C, but it may also be wave B. Intermediate wave (B) may be unfolding higher as a double zigzag.
There is no upper invalidation point for this wave count. Intermediate wave (B) may make a new high above the start of intermediate wave (A) as in a running triangle. Intermediate wave (B) should exhibit clear weakness. If price does make a new high, then for this wave count it should come with weak volume and bearish divergence between price and one or both of RSI or Stochastics.
Within the triangle, intermediate wave (C) may not move beyond the end of intermediate wave (A) below 2,603.54.
DAILY CHART – COMBINATION
Click chart to enlarge.
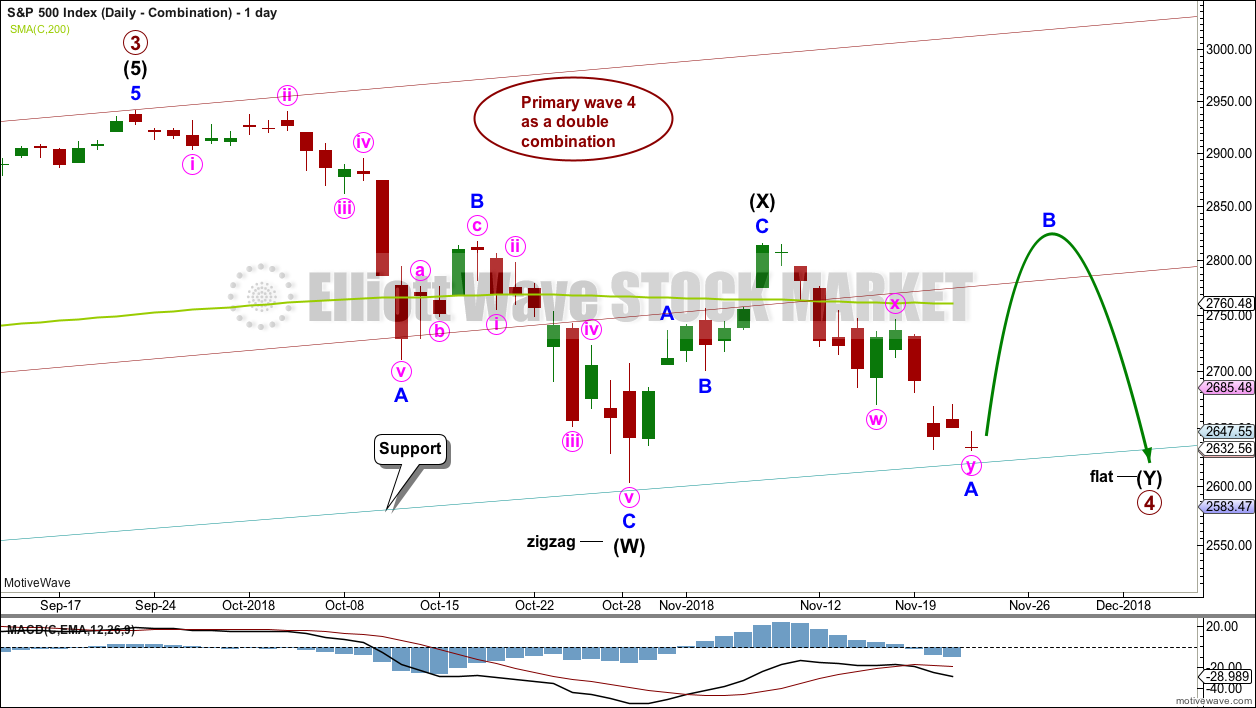
This wave count is judged to have only a very slightly lower probability than the triangle.
Primary wave 4 may be unfolding as a double combination. The first structure in the double may be a complete zigzag labelled intermediate wave (W). The double may be joined by a three in the opposite direction labelled intermediate wave (X). Intermediate wave (X) may be complete as a single zigzag; it is deep at 0.63 the length of intermediate wave (W), which looks reasonable.
Intermediate wave (Y) would most likely be a flat correction, which should subdivide 3-3-5. At its end, it may still find strong support about the lower edge of the teal trend channel.
Within the flat correction of intermediate wave (Y), minor wave B must retrace a minimum 0.9 length of minor wave A at 2,796.74. The common range for minor wave B is from 1 to 1.38 times the length of minor wave A giving a range from 2,815.15 to 2,885.09. Minor wave B may make a new high above the start of minor wave A at 2,815.15 as in an expanded flat.
DAILY CHART – FLAT
Click chart to enlarge.
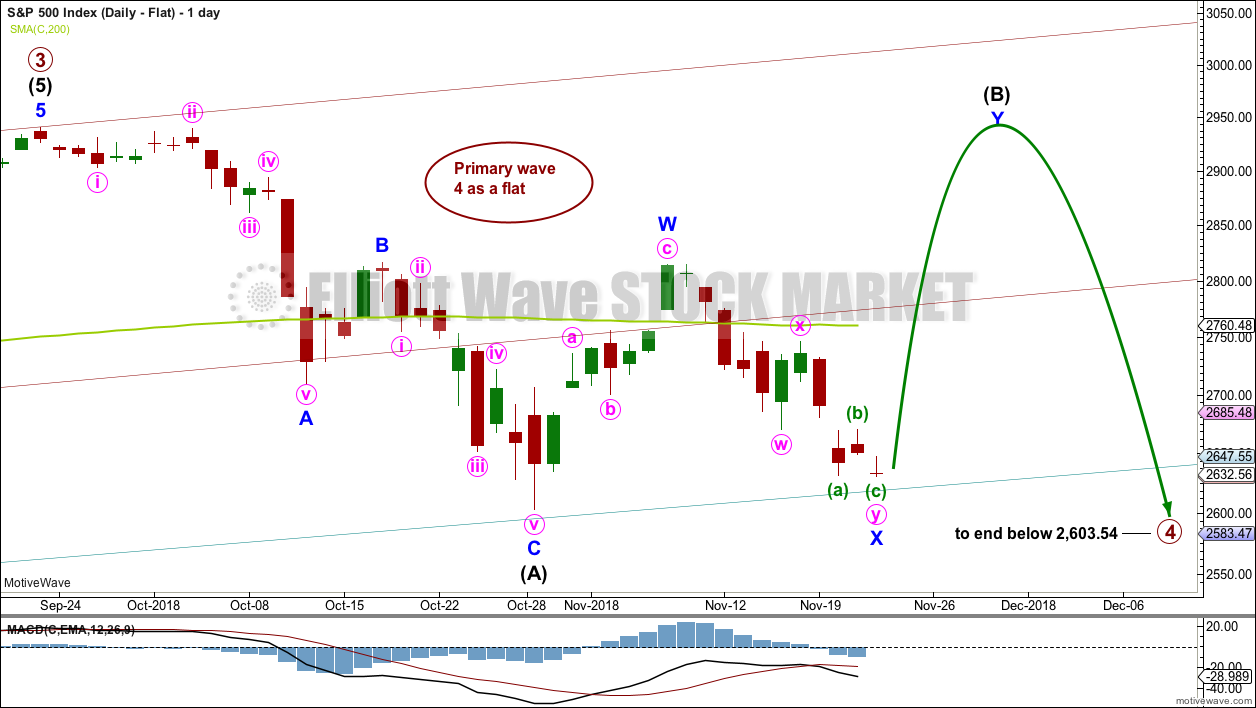
Primary wave 2 was a regular flat correction. If primary wave 4 unfolds as a flat correction, then there would be no alternation in structure between the two corrections; for this reason, this wave count is judged to have a low probability.
However, alternation is a guideline, not a rule, and it is not always seen. This wave count is possible.
If primary wave 4 is a flat correction, then within it intermediate wave (B) must move higher to retrace a minimum 0.9 length of intermediate wave (A).
When intermediate wave (B) is complete, then intermediate wave (C) should move below the end of intermediate wave (A) at 2,603.54 to avoid a truncation. This would expect a large overshoot of the teal trend line, which further reduces the probability of this wave count.
DAILY CHART – DOUBLE ZIGZAG
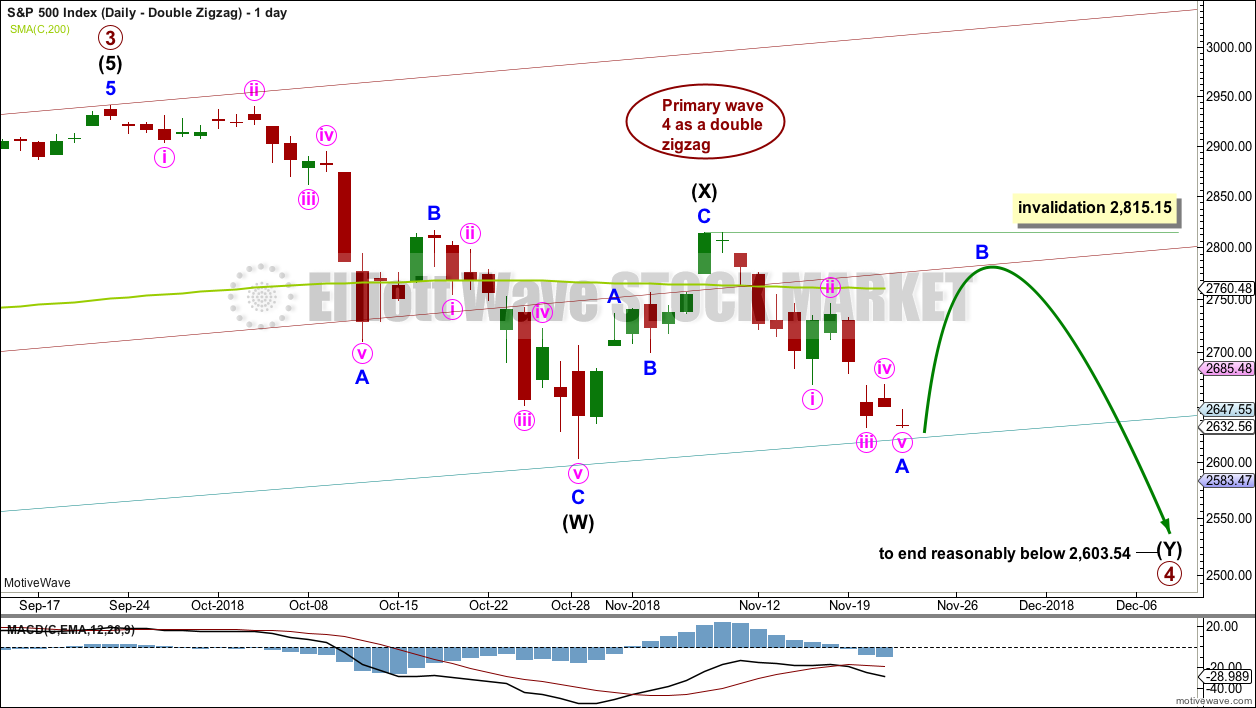
Click chart to enlarge.
Primary wave 4 may also be unfolding as a double zigzag.
The first zigzag in the double may be complete, labelled intermediate wave (W). The double may joined by a complete three in the opposite direction, a zigzag labelled intermediate wave (X).
The second zigzag in the double may have begun. It is labelled intermediate wave (Y). Within intermediate wave (Y), minor wave B may not move beyond the start of minor wave A above 2,815.15.
The purpose of a second zigzag in a double is to deepen the correction when the first zigzag does not move price deep enough. To achieve this purpose intermediate wave (Y) should be expected to end reasonably below the end of intermediate wave (W) at 2,603.54. This would expect a very large overshoot of the teal trend channel; for this reason, this wave count is judged to have the lowest probability.
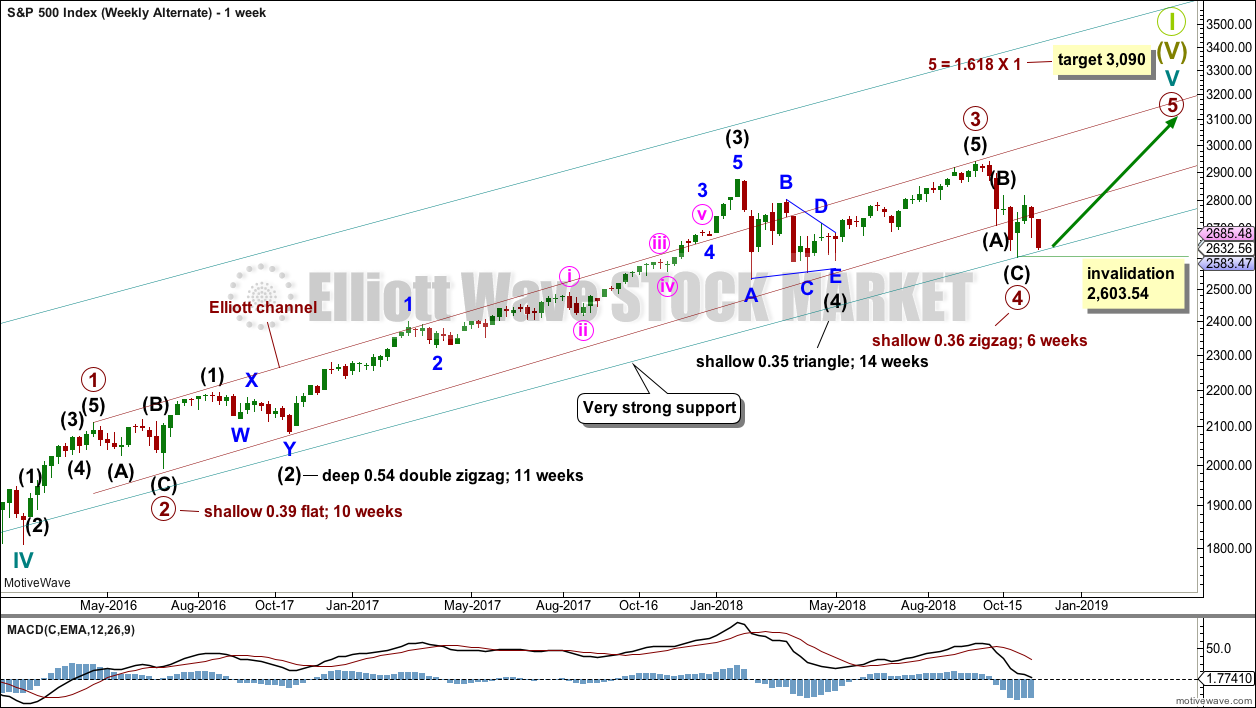
BULLISH ALTERNATE ELLIOTT WAVE COUNT
WEEKLY CHART
Click chart to enlarge.
It is possible that primary wave 4 could be over as a relatively quick zigzag, ending about support at the lower edge of the teal channel.
The proportion between primary waves 2 and 4 is reasonable. Flat corrections tend to be longer lasting structures than zigzags. There would be perfect alternation in structure and inadequate alternation in depth. This is acceptable.
This wave count has the right look at the monthly chart level.
If primary wave 5 ends at or after the end of December 2018 and the AD line fails to make new all time highs, there would then be the minimum required four months of bearish divergence between price and the AD line. If this happens, then the conditions for the end of this bull market would be in place.
A new target is calculated for primary wave 5 to end. If primary wave 5 were to be only equal in length with primary wave 1, then it would be truncated. A truncated primary wave 5 would be unlikely as then there could be no bearish divergence with the AD line. The next Fibonacci ratio in the sequence is used to calculate a target for primary wave 5.
Within primary wave 5, no second wave correction may move beyond the start of its first wave below 2,603.54.
DAILY CHART

Click chart to enlarge.
The subdivisions of primary wave 4 are seen in exactly the same way as most of the charts above except the degree of labelling is just moved up one degree.
Within primary wave 5, intermediate wave (1) may be over. Intermediate wave (2) may not move beyond the start of intermediate wave (1) below 2,603.54. Intermediate wave (2) may have ended at support at the lower edge of the teal trend channel.
Primary wave 5 may subdivide either as an impulse (more likely) or an ending diagonal (less likely). Intermediate wave (1) may be seen as either a five wave impulse or a three wave zigzag at lower time frames, and so at this stage primary wave 5 could be either an impulse or a diagonal.
Primary wave 5 at its end may be expected to exhibit reasonable weakness. At its end, it should exhibit a minimum of 4 months bearish divergence with the AD line, it may exhibit bearish divergence between price and RSI and Stochastics, and it may lack support from volume; it may not be possible to distinguish a weak fifth wave from a B wave.
TECHNICAL ANALYSIS
WEEKLY CHART
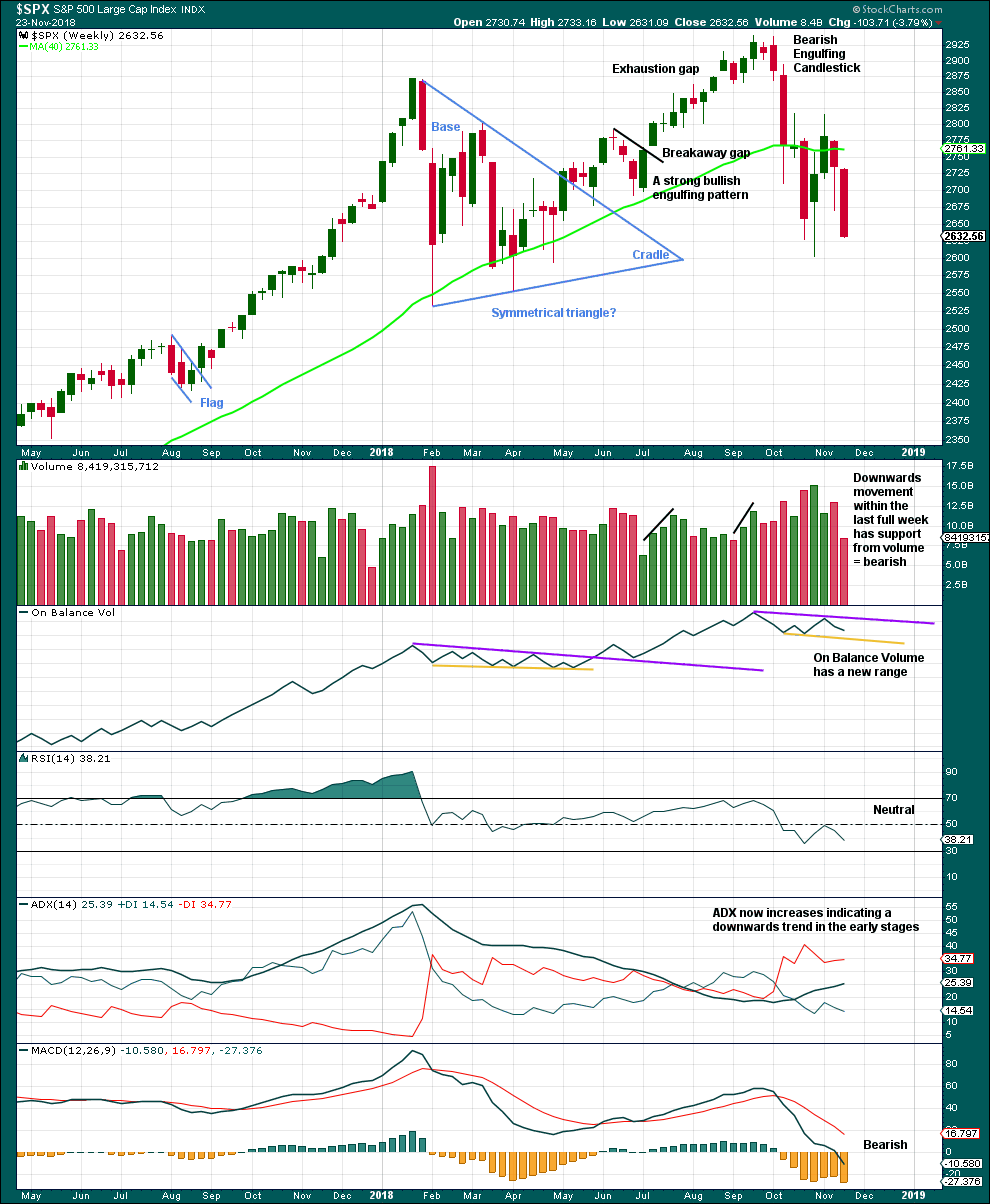
Click chart to enlarge. Chart courtesy of StockCharts.com.
With price closing almost at the low for the week, it looks like next week may move price lower.
Although volume is lighter this week, it was not a full trading week. No conclusion here about this week’s volume shall be drawn.
DAILY CHART
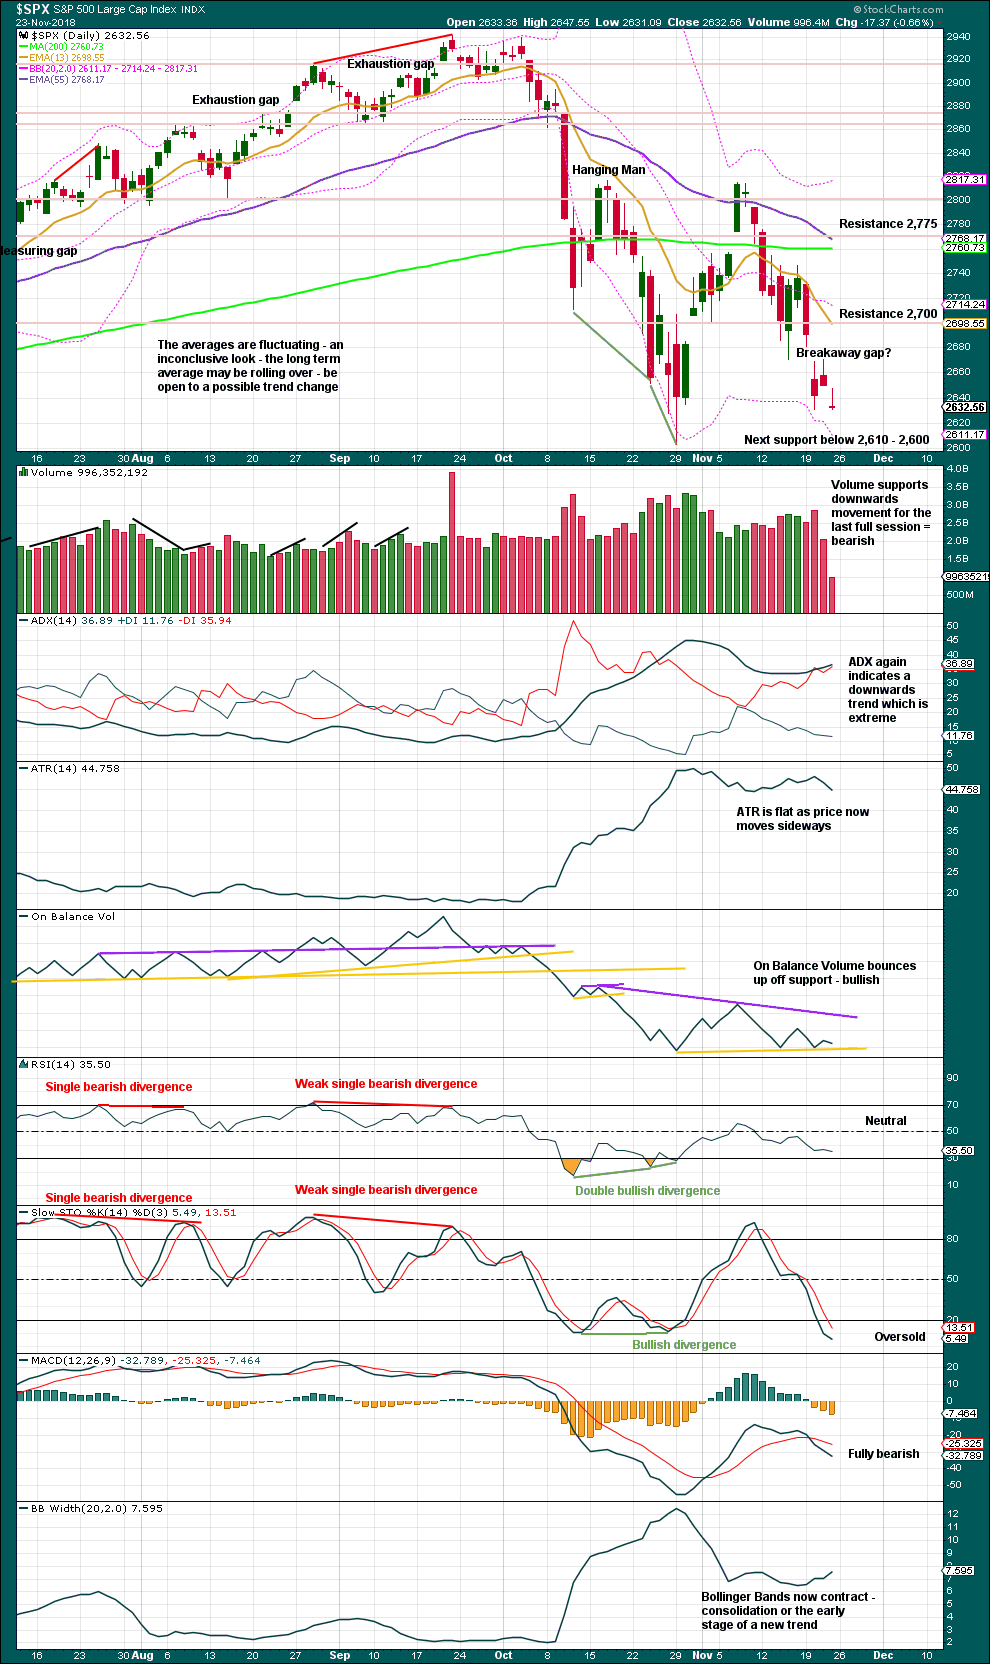
Click chart to enlarge. Chart courtesy of StockCharts.com.
The lower edge of the teal trend channel is not shown on this chart, but it should be considered as part of this technical analysis. Expect that trend line to continue to provide support, until it does not.
The last gap may be either a pattern or breakaway gap. It remains open, which is bearish, but price remains range bound. If price does move lower, then look for strong support about 2,610 – 2,600.
For the short term, Friday’s candlestick is a Gravestone doji; but it does not come at the end of an upwards movement, so it is not a bearish reversal signal.
If price does make a new low below the prior swing low of the 29th of October, then close attention should be paid to RSI. If it makes a corresponding new low, that would be bearish. But if RSI does not make a corresponding new low, then there would be further bullish divergence.
BREADTH – AD LINE
WEEKLY CHART

Click chart to enlarge. Chart courtesy of StockCharts.com. So that colour blind members are included, bearish signals
will be noted with blue and bullish signals with yellow.
This week both price and the AD line have moved lower. There is no short-term divergence at this time frame.
DAILY CHART
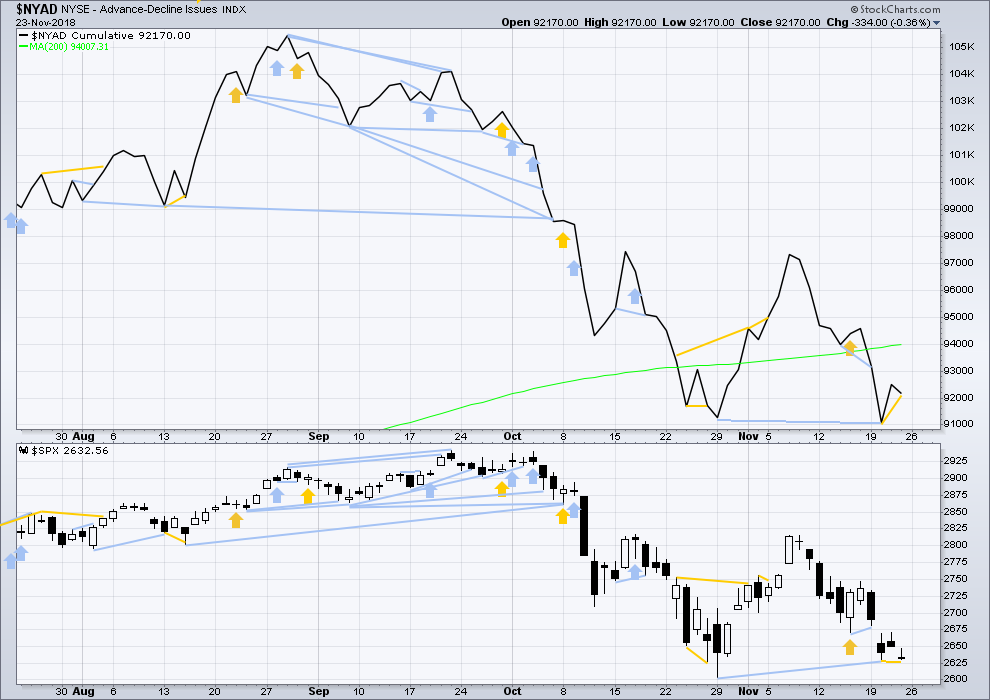
Click chart to enlarge. Chart courtesy of StockCharts.com. So that colour blind members are included, bearish signals
will be noted with blue and bullish signals with yellow.
There is normally 4-6 months divergence between price and market breadth prior to a full fledged bear market. This has been so for all major bear markets within the last 90 odd years. With no longer-term divergence yet at this point, any decline in price should be expected to be a pullback within an ongoing bull market and not necessarily the start of a bear market. New all time highs from the AD line on the 29th of August means that the beginning of any bear market may be at the end of December 2018, but it may of course be a lot longer than that. My next expectation for the end of this bull market may now be October 2019.
Breadth should be read as a leading indicator.
Price has made a slight new low below the low two sessions prior, but the AD line has not. Downwards movement lacks support from falling market breadth. This divergence is bullish.
VOLATILITY – INVERTED VIX CHART
WEEKLY CHART
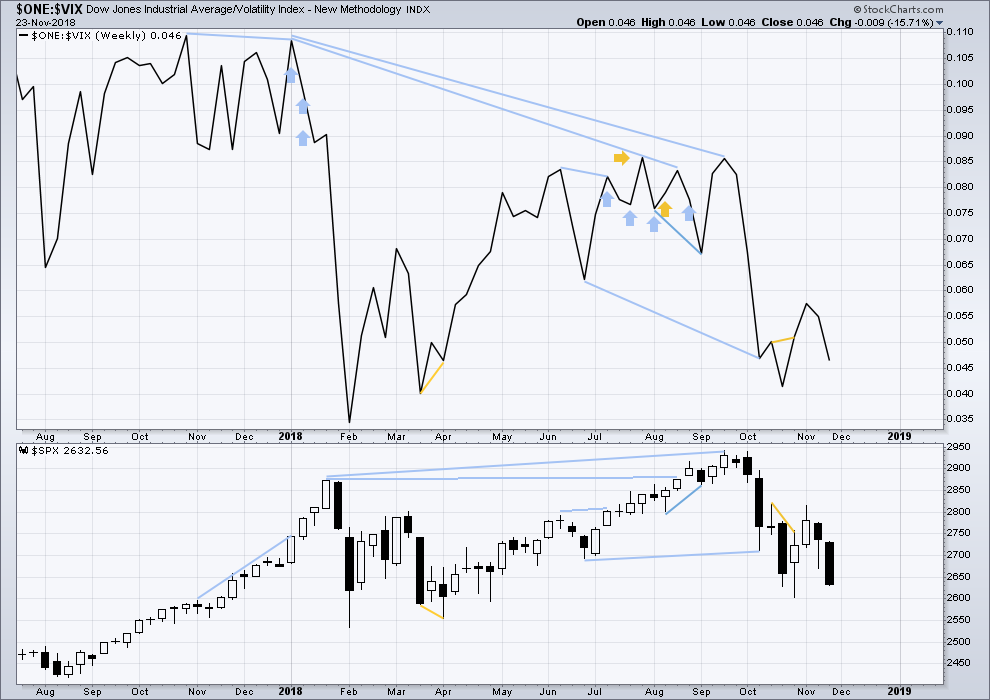
Click chart to enlarge. Chart courtesy of StockCharts.com. So that colour blind members are included, bearish signals
will be noted with blue and bullish signals with yellow.
This week both price and inverted VIX have moved lower. There is no new short-term divergence at this time frame.
DAILY CHART
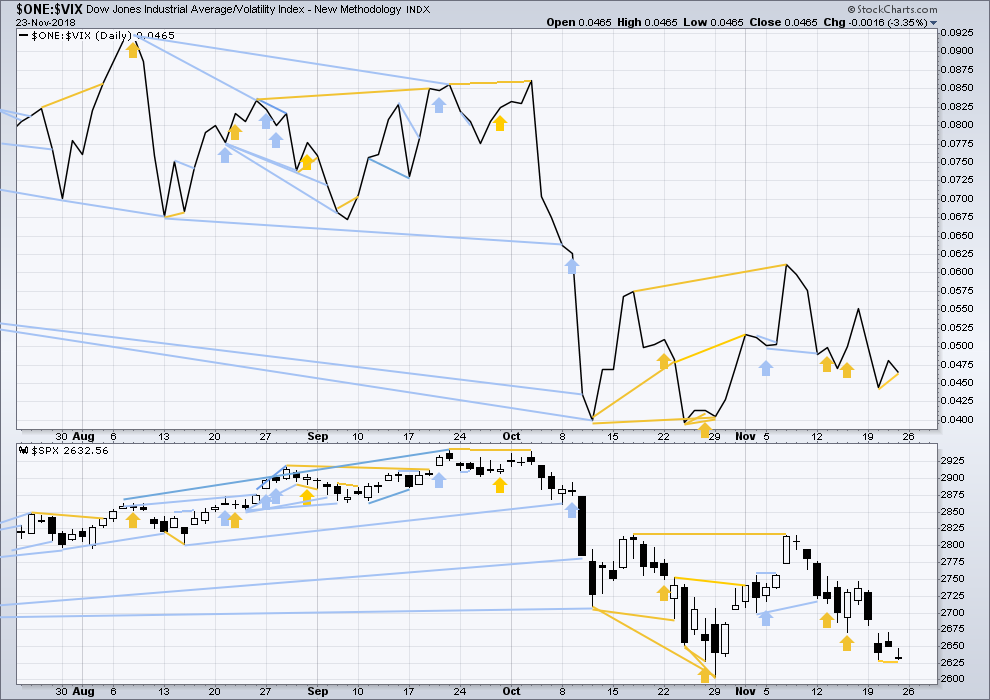
Click chart to enlarge. Chart courtesy of StockCharts.com. So that colour blind members are included, bearish signals
will be noted with blue and bullish signals with yellow.
Normally, volatility should decline as price moves higher and increase as price moves lower. This means that normally inverted VIX should move in the same direction as price.
Price on Friday has made a slight new low below the low two sessions prior, but inverted VIX has not. This short-term divergence is bullish.
DOW THEORY
The following lows need to be exceeded for Dow Theory to confirm the end of the bull market and a change to a bear market:
DJIA: 23,344.52.
DJT: 9,806.79.
S&P500: 2,532.69.
Nasdaq: 6,630.67.
GOLD
For the very short term, some downwards movement was expected, which is what has happened at the end of the week.
Summary: For the very short term, another pullback to about 1,209 may unfold before upwards movement resumes.
The target for the short term is 1,295.
The final target for this bounce to end is about 1,305 – 1,310.
Grand SuperCycle analysis is here.
Last historic analysis with monthly charts is here.
There are four remaining weekly wave counts at this time for cycle wave b: a triangle, a flat, a combination, and a double zigzag.
At this time, the Triangle wave count may again be slightly more likely.
MAIN ELLIOTT WAVE COUNT
WEEKLY CHART – TRIANGLE
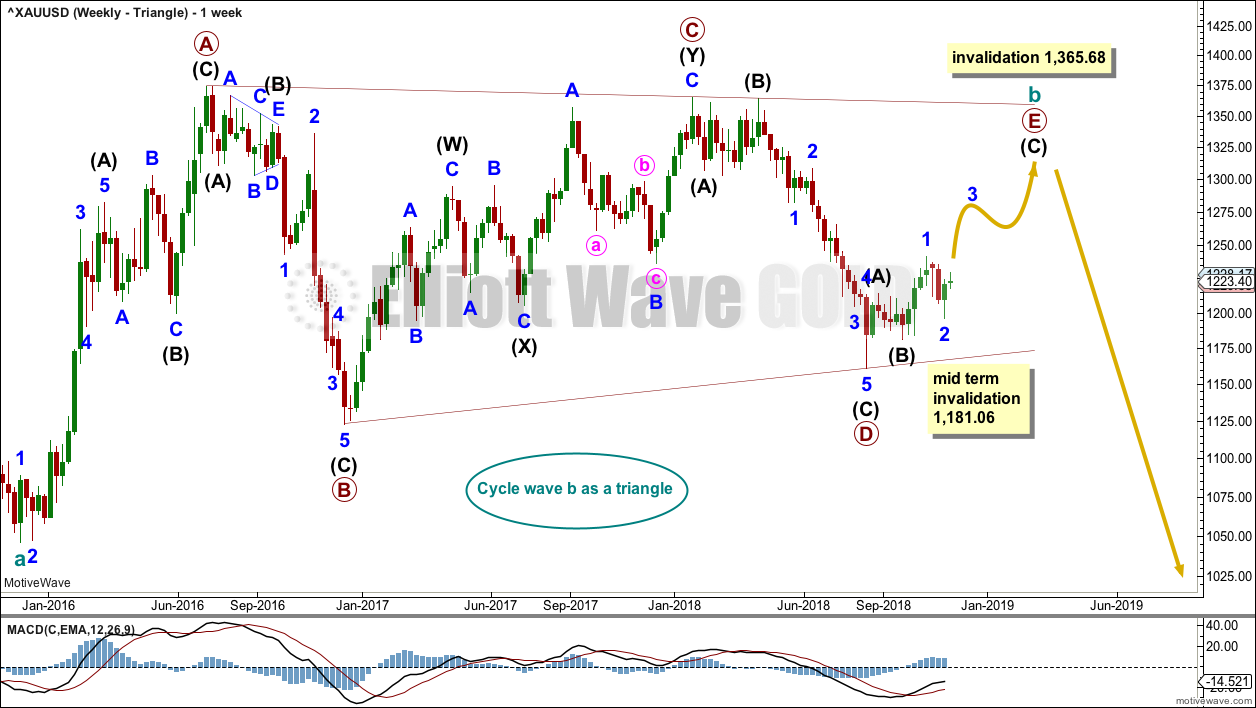
Click chart to enlarge.
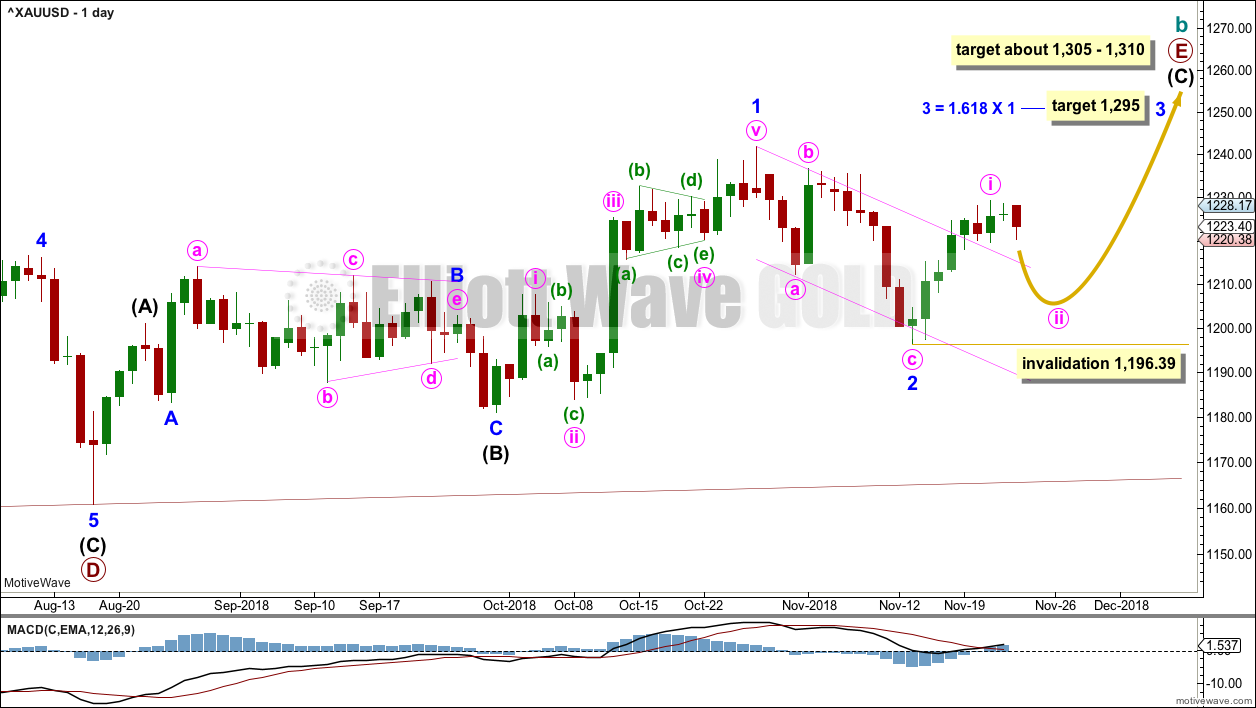
Cycle wave b may be an incomplete regular contracting triangle. Primary wave E may not move beyond the end of primary wave C above 1,365.68.
Within primary wave E, intermediate waves (A) and (B) may be complete. Intermediate wave (C) must subdivide as a five wave structure. Within intermediate wave (C), minor wave 2 may not move beyond the start of minor wave 1 below 1,181.06.
Four of the five sub-waves of a triangle must be zigzags, with only one sub-wave allowed to be a multiple zigzag. Wave C is the most common sub-wave to subdivide as a multiple, and this is how primary wave C for this example fits best. Primary wave E would most likely be a single zigzag. It is also possible that it may subdivide as a triangle to create a rare nine wave triangle.
There are no problems in terms of subdivisions or rare structures for this wave count. It has an excellent fit and so far a typical look.
When primary wave E is a complete three wave structure, then this wave count would expect a cycle degree trend change. Cycle wave c would most likely make new lows below the end of cycle wave a at 1,046.27 to avoid a truncation.
DAILY CHART – TRIANGLE
Click chart to enlarge.
Primary wave E should now be underway for this wave count.
Primary wave E should subdivide as a zigzag. Intermediate waves (A) and (B) may now be complete. Intermediate wave (C) may have begun.
Minor wave 1 fits perfectly as a five wave impulse. Minor wave 2 may now be complete as a deep zigzag. Minor wave 3 may now exhibit an increase in upwards momentum, and it should have support from volume. The target for minor wave 3 expects it to exhibit a common Fibonacci ratio to minor wave 1.
Minor wave 3 may only subdivide as an impulse. Within minor wave 3, minute wave ii may not move beyond the start of minute wave i below 1,196.39.
A target for primary wave E is the strong zone of resistance about 1,305 to 1,310. Primary wave E is most likely to subdivide as a zigzag (although it may also subdivide as a triangle to create a rare nine wave triangle). It may last a total Fibonacci 21 or 34 weeks. So far it has lasted 13 weeks. Primary wave E may not move beyond the end of primary wave C above 1,365.68.
WEEKLY CHART – DOUBLE ZIGZAG
Click chart to enlarge.
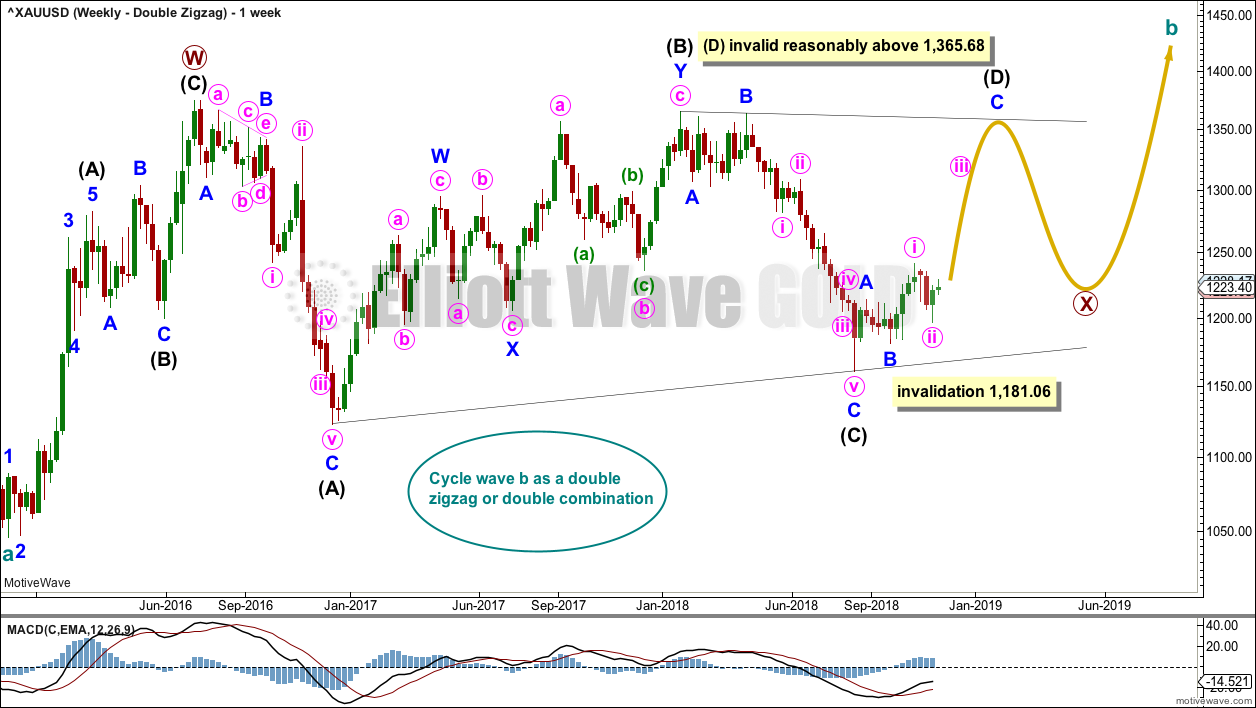
It is possible that cycle wave b may be a double zigzag or a double combination.
The first zigzag in the double is labelled primary wave W. This has a good fit.
The double may be joined by a corrective structure in the opposite direction, a triangle labelled primary wave X. The triangle would be about three quarters complete.
Within the triangle of primary wave X, intermediate wave (C) should be complete. Within intermediate wave (D), minor waves A and B may be complete. Minor wave C must subdivide as a five wave structure. Within minor wave C, minute wave ii may not move beyond the start of minute wave i below 1,181.06.
Intermediate wave (D) would most likely subdivide as a single zigzag.
This wave count may now expect choppy overlapping movement in an ever decreasing range for several more months.
Primary wave Y would most likely be a zigzag because primary wave X would be shallow; double zigzags normally have relatively shallow X waves.
Primary wave Y may also be a flat correction if cycle wave b is a double combination, but combinations normally have deep X waves. This would be less likely.
This wave count has good proportions and no problems in terms of subdivisions.
WEEKLY CHART – COMBINATION
Click chart to enlarge.
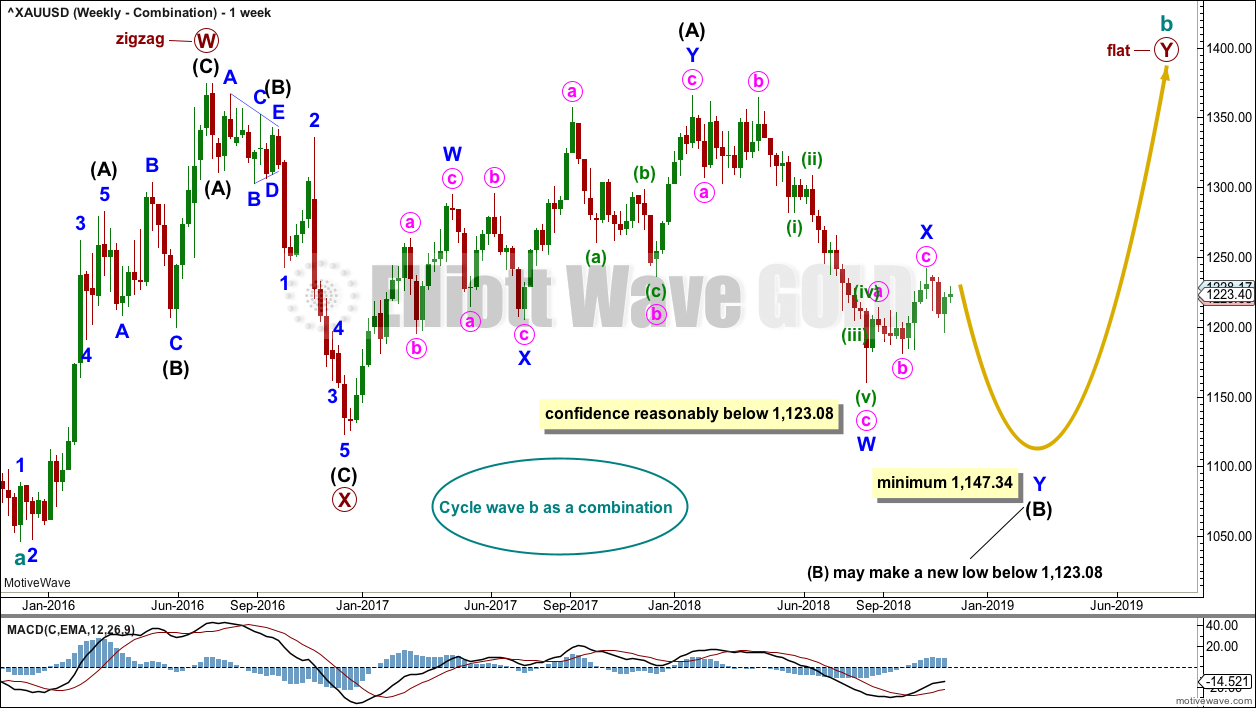
If cycle wave b is a combination, then the first structure in a double may be a complete zigzag labelled primary wave W.
The double may be joined by a three in the opposite direction, a zigzag labelled primary wave X.
The second structure in the double may be a flat correction labelled primary wave Y. My research on Gold so far has found that the most common two structures in a double combination are one zigzag and one flat correction. I have found only one instance where a triangle unfolded for wave Y. The most likely structure for wave Y would be a flat correction by a very wide margin, so that is what this wave count shall expect.
Within a flat correction for primary wave Y, the current downwards wave of intermediate wave (B) may be a double zigzag. Intermediate wave (B) must retrace a minimum 0.9 length of intermediate wave (A) at 1,147.34. Intermediate wave (B) may move beyond the start of intermediate wave (A) as in an expanded flat.
Because the minimum requirement for intermediate wave (B) is not yet met, this wave count requires that intermediate wave (B) continues lower. This is the most immediately bearish of all four weekly wave counts.
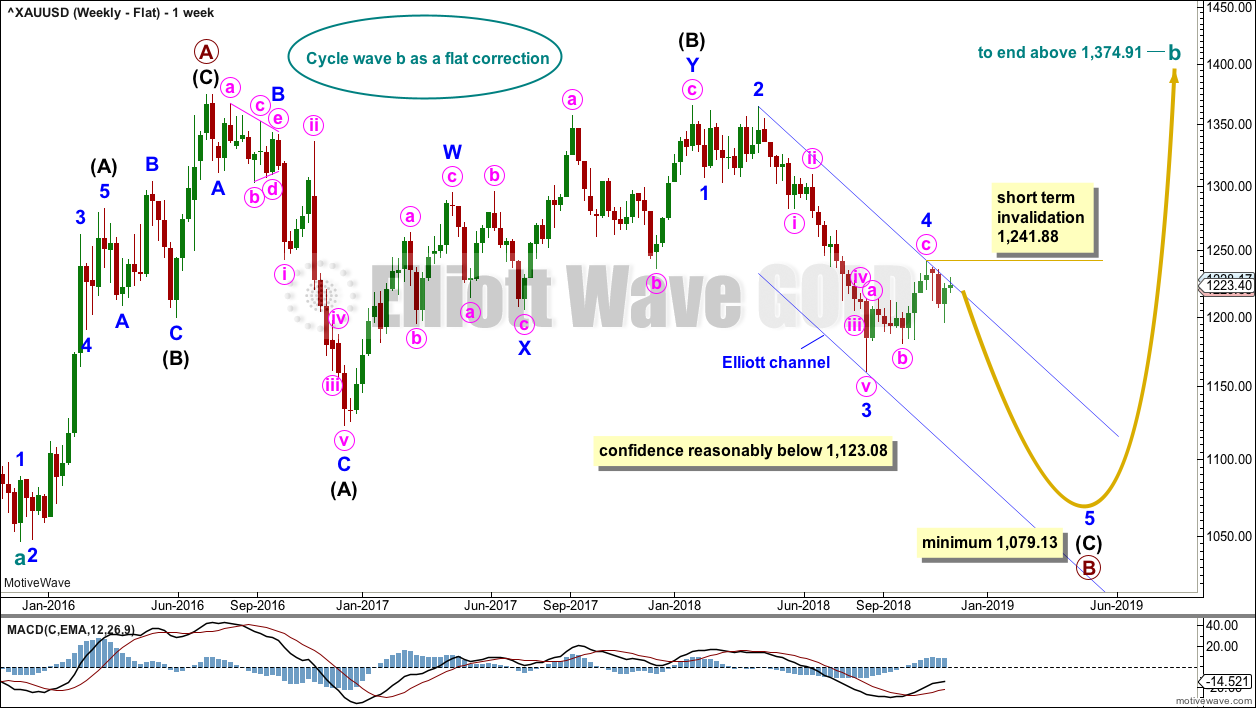
When intermediate wave (B) is complete, then intermediate wave (C) would be expected to make at least a slight new high above the end of intermediate wave (A) at 1,365.68 to avoid a truncation. Primary wave Y would be most likely to end about the same level as primary wave W at 1,374.91, so that the whole structure takes up time and moves price sideways, as that is the purpose of double combinations.
While double combinations are very common, triples are extremely rare. I have found no examples of triple combinations for Gold at daily chart time frames or higher back to 1976. When the second structure in a double is complete, then it is extremely likely (almost certain) that the whole correction is over.
DAILY CHART – COMBINATION
Click chart to enlarge.
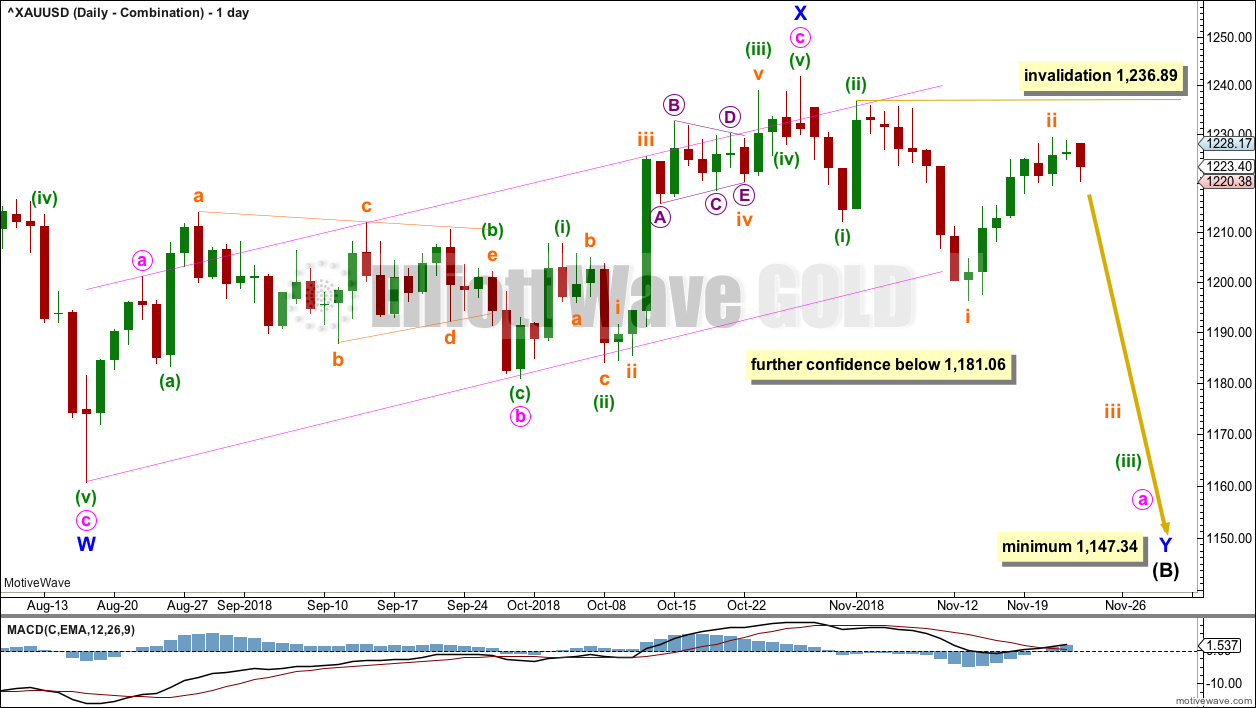
Minor wave X may be complete.
Minor wave Y may be underway for this wave count to continue lower to a minimum at 1,147.34. Minor wave Y may last a few weeks.
A new low below 1,181.06 would provide confidence in this wave count.
Within minor wave Y, minute wave a would be an incomplete five wave impulse. Within minute wave a, minuette waves (i) and (ii) may be complete. Minuette wave (iii) may only subdivide as an impulse.
Within minuette wave (iii), subminuette wave i may be complete. Subminuette wave ii may not move beyond the start of subminuette wave i above 1,236.89.
WEEKLY CHART – FLAT
Click chart to enlarge.
It is possible that cycle wave b may be a flat correction. Within a flat correction, primary wave B must retrace a minimum 0.9 length of primary wave A at 1,079.13 or below. Primary wave B may make a new low below the start of primary wave A at 1,046.27 as in an expanded flat correction.
Only a new low reasonably below 1,123.08 would provide reasonable confidence in this wave count.
Intermediate wave (C) must subdivide as a five wave structure; it may be unfolding as an impulse. Within intermediate wave (C), minor waves 1 through to 4 may be complete. Within minor wave 5, no second wave correction may move beyond its start above 1,241.88.
The blue channel is drawn using Elliott’s second technique. Minor wave 5 may end at support about the lower edge of this channel.
Minor wave 2 was a double zigzag lasting nine weeks. Minor wave 4 exhibits little alternation as a single zigzag and reasonable proportion lasting ten weeks.
TECHNICAL ANALYSIS
WEEKLY CHART
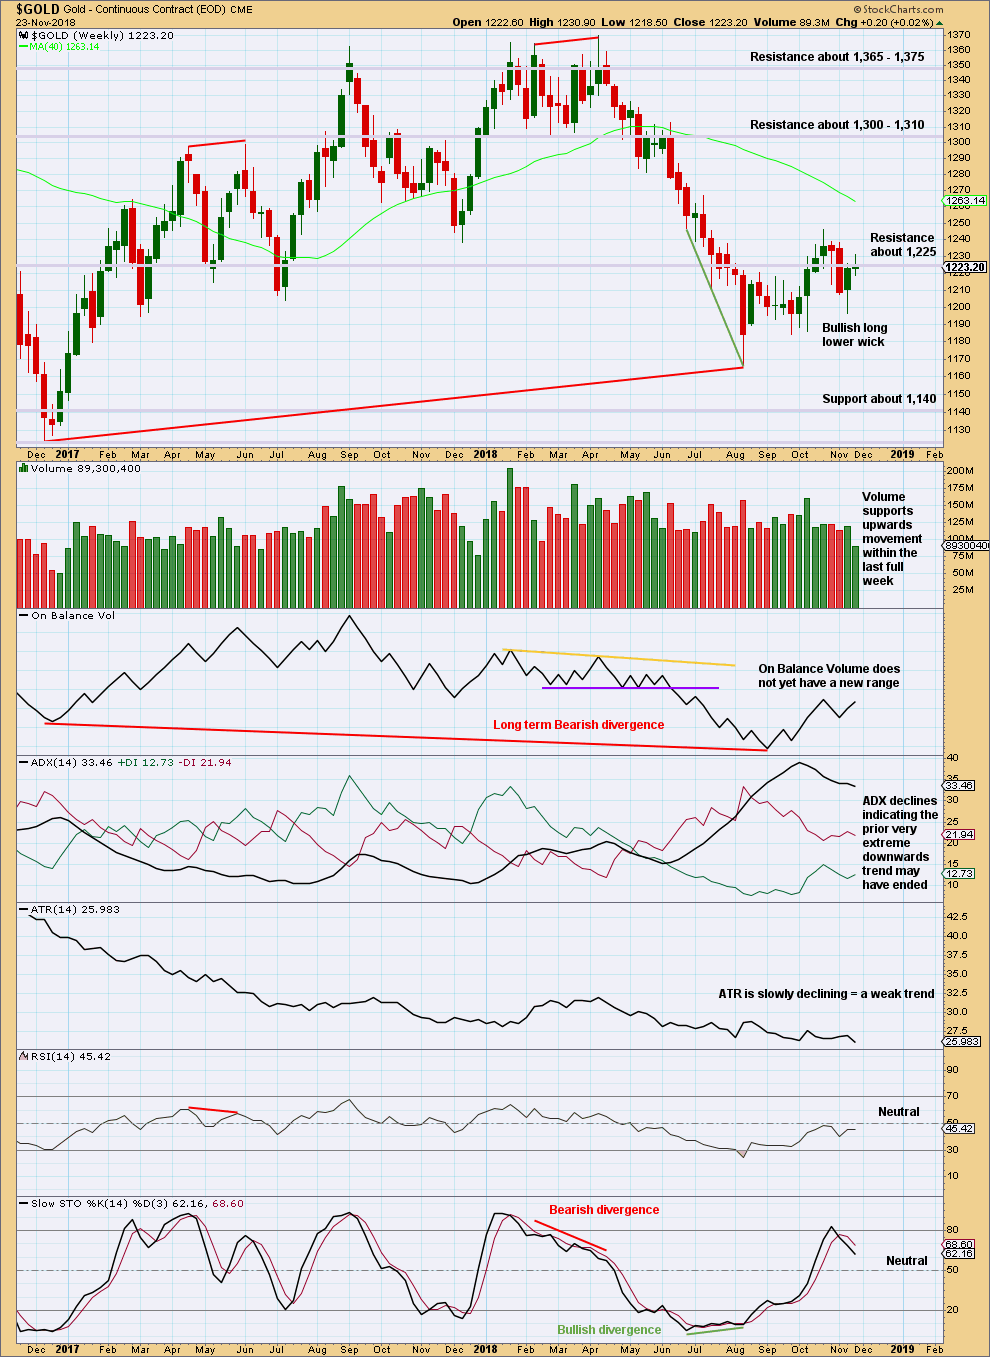
Click chart to enlarge. Chart courtesy of StockCharts.com.
On Balance Volume has made a lower low than its prior low at the end of November 2015. This divergence is extremely bearish but does not rule out a consolidation unfolding here; the divergence does strongly support the Triangle wave count, which expects a consolidation or bounce up to test resistance now and then a continuation of a major bear market. It could also support the flat wave count that allows for a new low below 1,046.27 in coming months.
This week a small green doji does not change this analysis, and is to be expected for a short and quiet trading week in which the US had a day and a half of holiday.
DAILY CHART
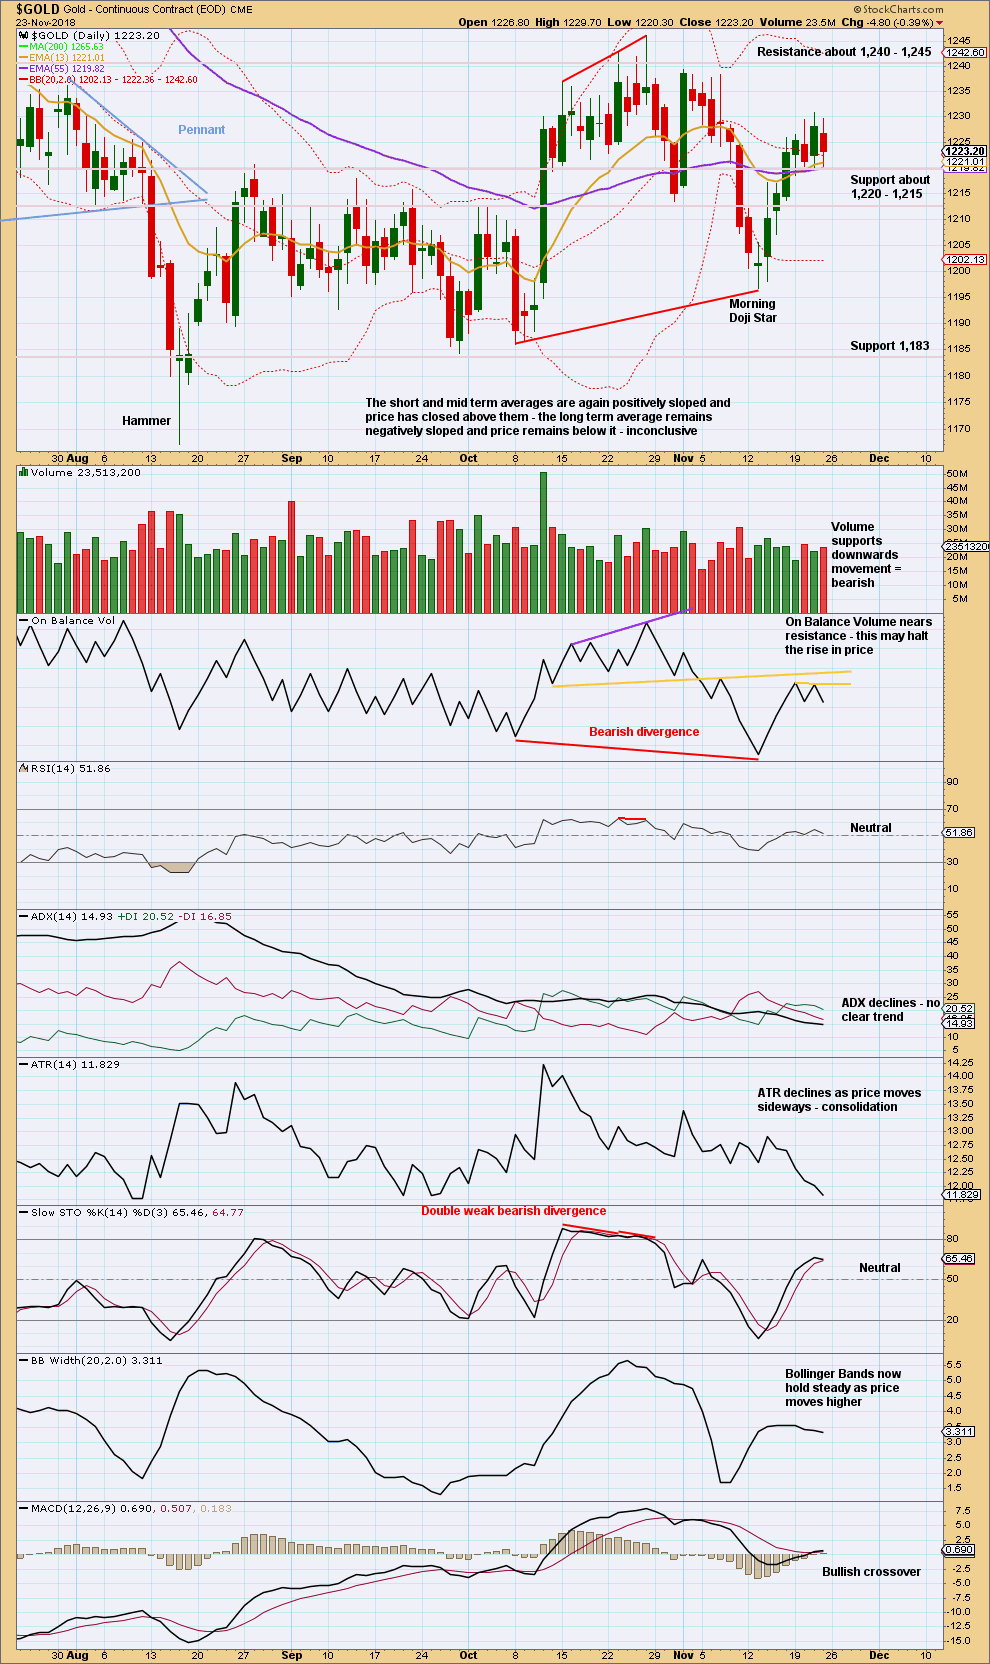
Click chart to enlarge. Chart courtesy of StockCharts.com.
Gold may be within a larger consolidation with resistance about 1,240 – 1,245 and support about 1,195 – 1,183. Price is swinging from resistance to support and back again, with Stochastics reaching overbought when price reached resistance and oversold when price reached support.
Currently, price is bouncing up off support which was found about 1,195. Look for overall upwards movement to continue towards 1,240 – 1,245 and only stop when Stochastics reaches overbought. Do not expect price to move in a straight line.
For the short term, there is interim support here about 1,220 which is holding, but a slightly bearish short-term volume profile suggests it may be broken.
A close above resistance at 1,245 would be an upwards breakout. For confidence it would require support from volume.
GDX WEEKLY CHART
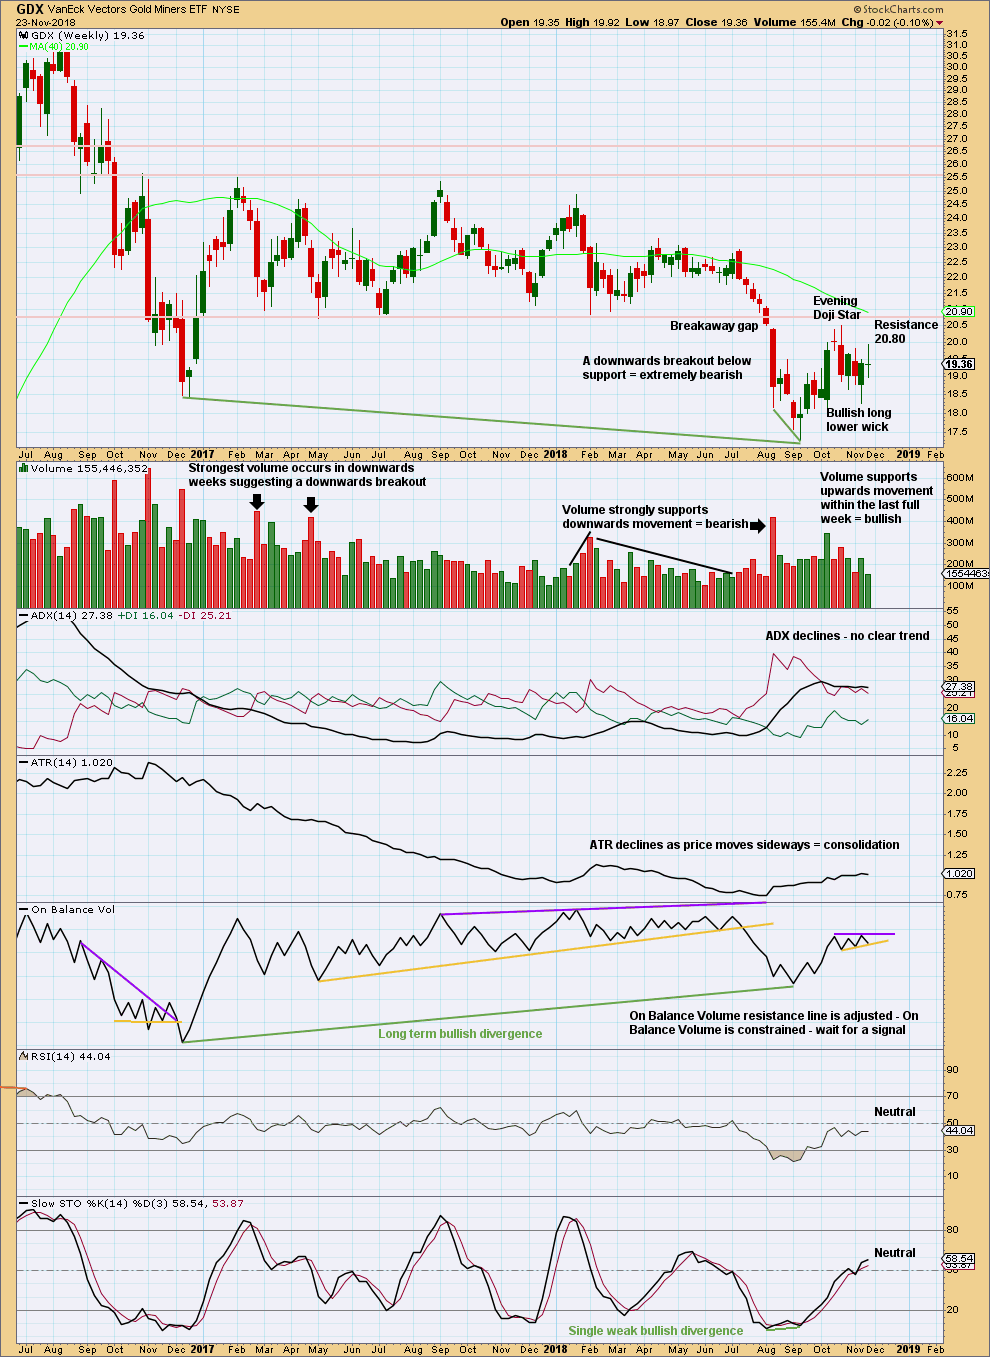
Click chart to enlarge. Chart courtesy of StockCharts.com.
GDX had a large consolidation that lasted from January 2017 to August 2018. A downwards breakout below support at 20.80 in early August 2018 is highly significant. The breakout had support from volume, which adds confidence.
The target is at 16.02.
GDX DAILY CHART
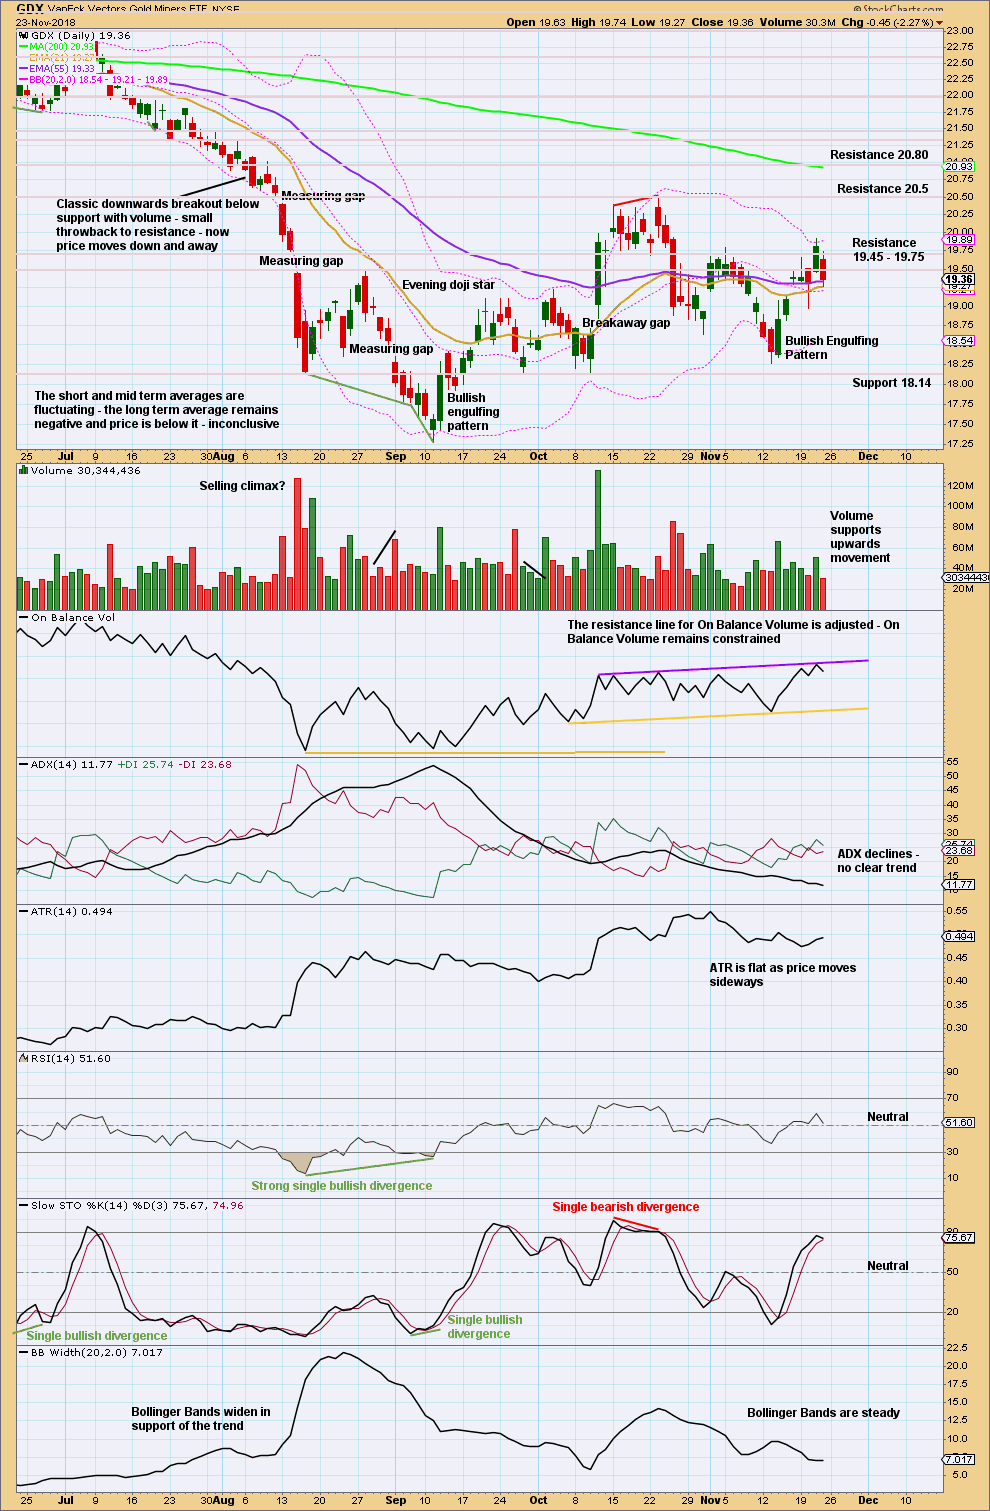
Click chart to enlarge. Chart courtesy of StockCharts.com.
At the daily chart level, price is now within a consolidation that is bound by resistance above at 20.50 and support below at 18.14. It is the upwards day of the 11th of October that has strongest volume during this consolidation, suggesting an upwards breakout may be more likely than downwards. This technique does not always work, but it does work more often than it fails.
However, if price does break above 20.50, then it would be extremely likely to find very strong resistance just above at 20.80 and halt there. At a higher time frame that would look like a classic back test of resistance at prior support, identified on the weekly chart. If price does behave like that, it would offer a high probability low risk set up for a short position on GDX that may be held for the long term.
US OIL
A new low below 51.67 has invalidated the alternate bullish Elliott wave count, adding confidence to the main bearish Elliott wave count. The short-term target remains the same.
Summary: Oil is in a downwards trend. The probability that Oil may continue to move reasonably below 26.06 has increased.
Trends do not move in straight lines. There will be bounces and consolidations along the way. Look for a candlestick reversal pattern on the daily chart to signal the first multi week bounce or consolidation for a second wave. The target for this to begin is at 46.80.
MAIN ELLIOTT WAVE COUNT
MONTHLY CHART
Click chart to enlarge.
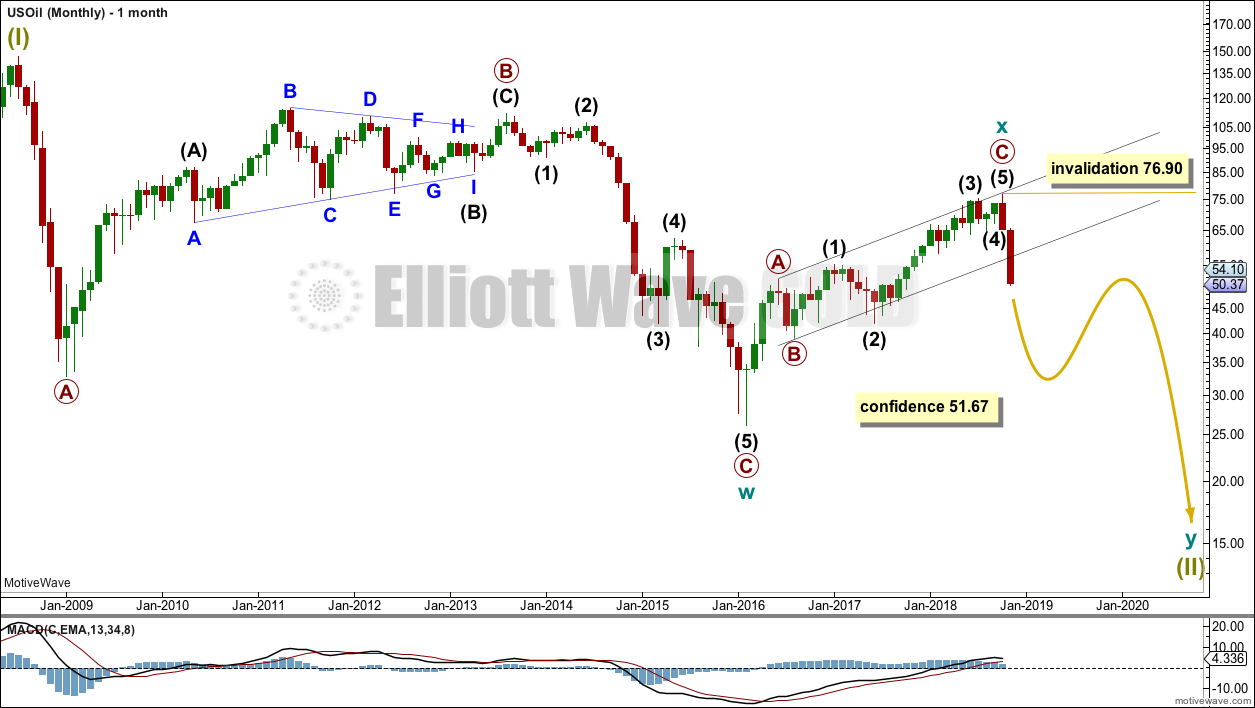
Classic technical analysis favours a bearish wave count for Oil at this time.
The large fall in price from the high in June 2008 to February 2016 is seen as a complete three wave structure. This large zigzag may have been only the first zigzag in a deeper double zigzag.
The first zigzag down is labelled cycle wave w. The double is joined by a now complete three in the opposite direction, a zigzag labelled cycle wave x.
The purpose of a second zigzag in a double is to deepen the correction when the first zigzag does not move price deep enough. Cycle wave y would be expected to move reasonably below the end of cycle wave w to deepen the correction. Were cycle wave y to reach equality with cycle wave w that takes Oil into negative price territory, which is not possible. Cycle wave y would reach 0.618 the length of cycle wave w at $2.33.
A better target calculation would be using the Fibonacci ratios between primary waves A and C within cycle wave y. This cannot be done until both primary waves A and B are complete.
Within cycle wave y, no second wave correction nor B wave may move beyond its start above 76.90.
WEEKLY CHART
Click chart to enlarge.
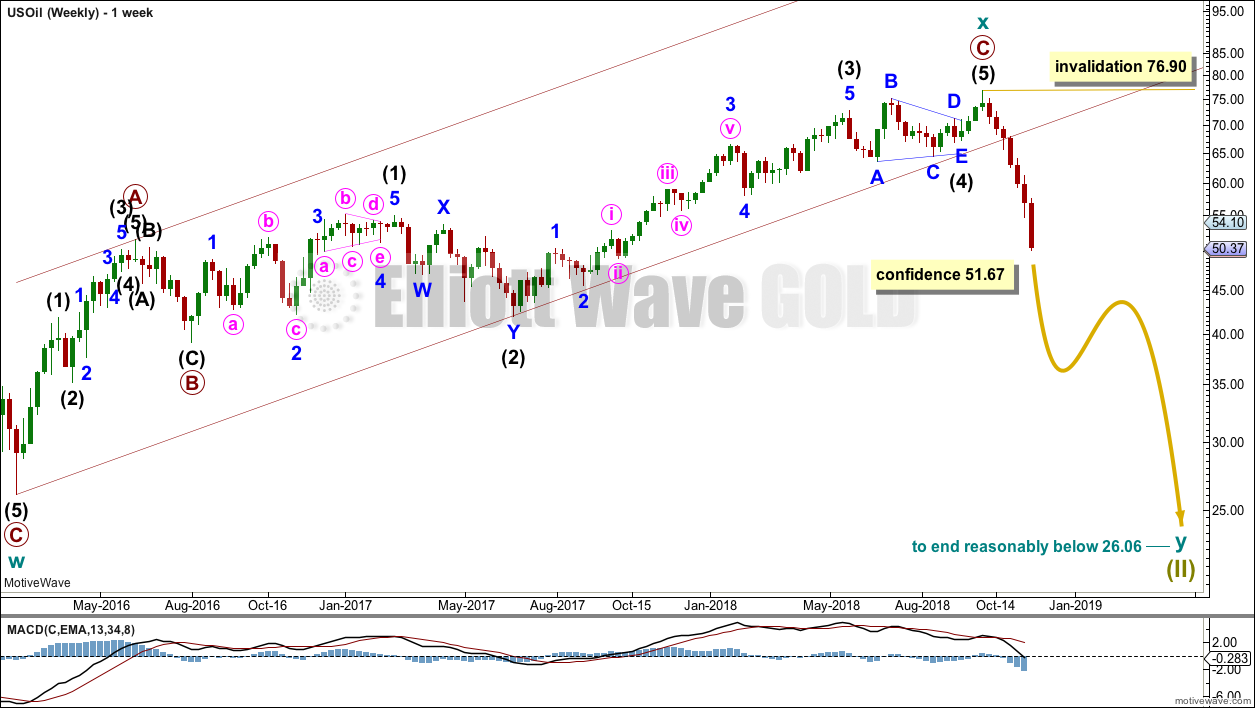
Cycle wave x is seen as a complete zigzag. Within the zigzag, primary wave C is a five wave impulse and within it intermediate wave 4 is a triangle.
A new low below 51.67 has added confidence in this bearish wave count. At that stage, the bullish alternate was invalidated.
DAILY CHART
Click chart to enlarge.
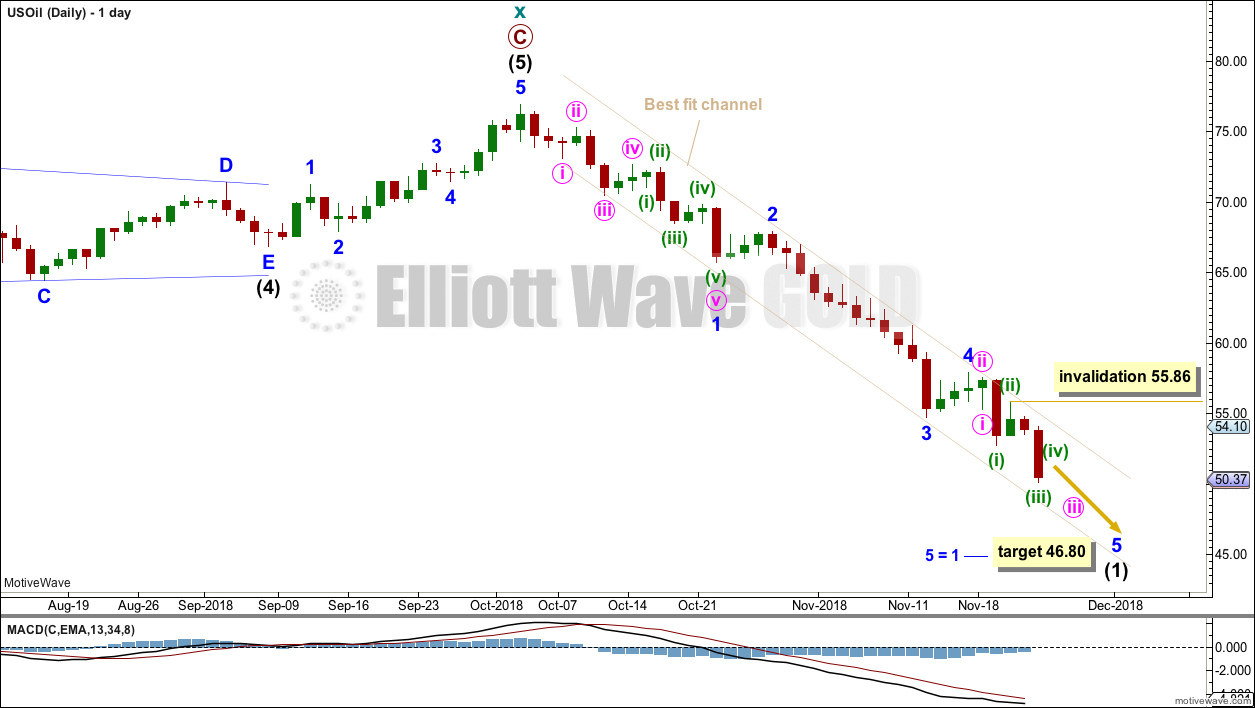
Attention now turns to the structure of downwards movement. An impulse is unfolding lower.
Minor wave 3 is longer than minor wave 1 and does not exhibit a Fibonacci ratio to minor wave 1.
Minor wave 4 has remained contained within the best fit channel.
The most common Fibonacci ratio for minor wave 5 is used to calculate a target for it to end. Minor wave 5 must subdivide as a five wave motive structure, either an impulse or an ending diagonal. So far it looks most likely to be unfolding as an impulse. Within the impulse, minute wave iii may be nearing an end.
Within minuette wave (iii), no second wave correction may move beyond its start above 55.86.
Keep using the best fit channel as the first guide for an upcoming trend change. If the channel is breached by clearly upwards movement (not sideways), that would be an early indication that intermediate wave (1) may be over and intermediate wave (2) may have begun.
TECHNICAL ANALYSIS
MONTHLY CHART
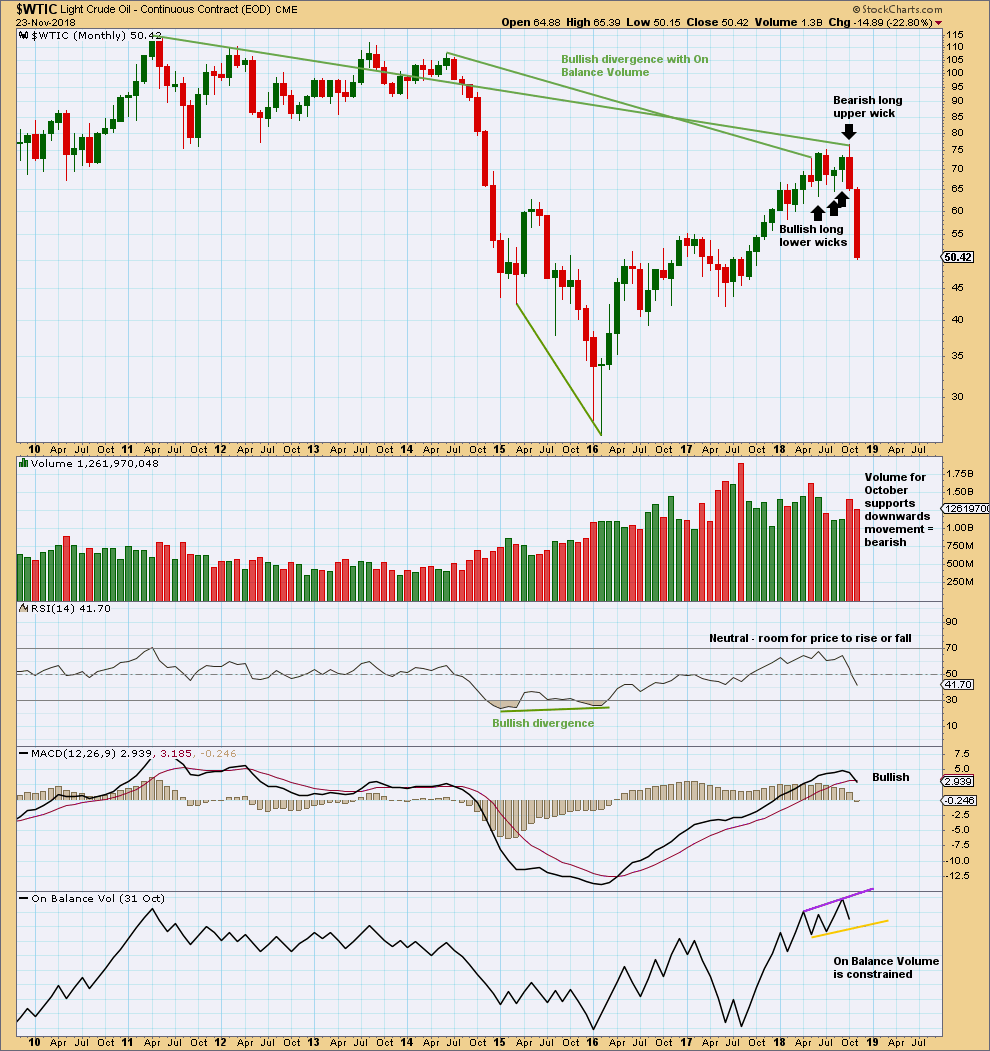
Click chart to enlarge. Chart courtesy of StockCharts.com.
With very strong downwards movement now moving to lower lows, it now looks clear that there has been a trend change at the monthly chart level.
With a long upper candlestick wick and support from volume, the last completed month of October is bearish. On its own, this is not an indication of the end of the upwards trend though; it is noted that August 2017 was similar yet price continued higher.
However, the month of October also completes a Bearish Engulfing candlestick pattern. This is a strong reversal pattern. This strong reversal pattern is now being followed by more downwards movement. Now it does look like there may have been a trend change.
Bullish divergence between price and On Balance Volume remains, and is still a strong technical indicator that price may continue upwards to make new highs. However, at this time, it looks like this may fail.
WEEKLY CHART
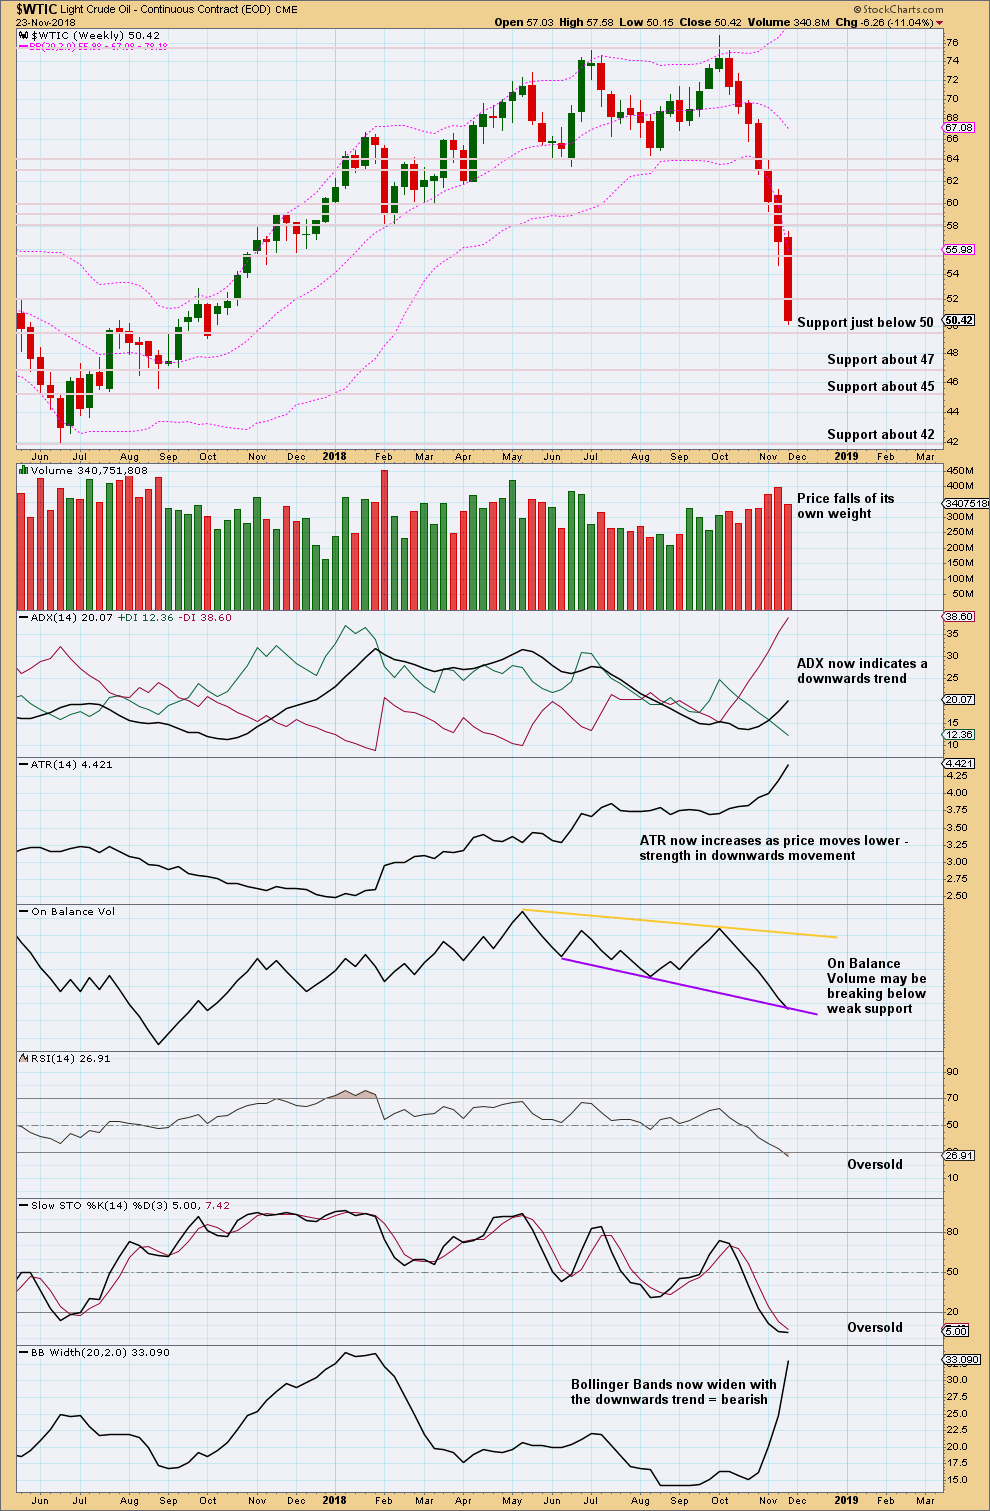
Click chart to enlarge. Chart courtesy of StockCharts.com.
There is still plenty of room for this downwards trend to continue.
RSI can reach deeply oversold and remain there for many weeks when Oil has a strong bearish trend. Also, Stochastics may remain oversold for many weeks, and ADX can reach very extreme and remain there for weeks.
At this time, Stochastics and RSI are just oversold, and ADX is not yet extreme.
With no candlestick reversal pattern and not even a long lower wick this week, it looks most likely that downwards movement will continue here.
DAILY CHART
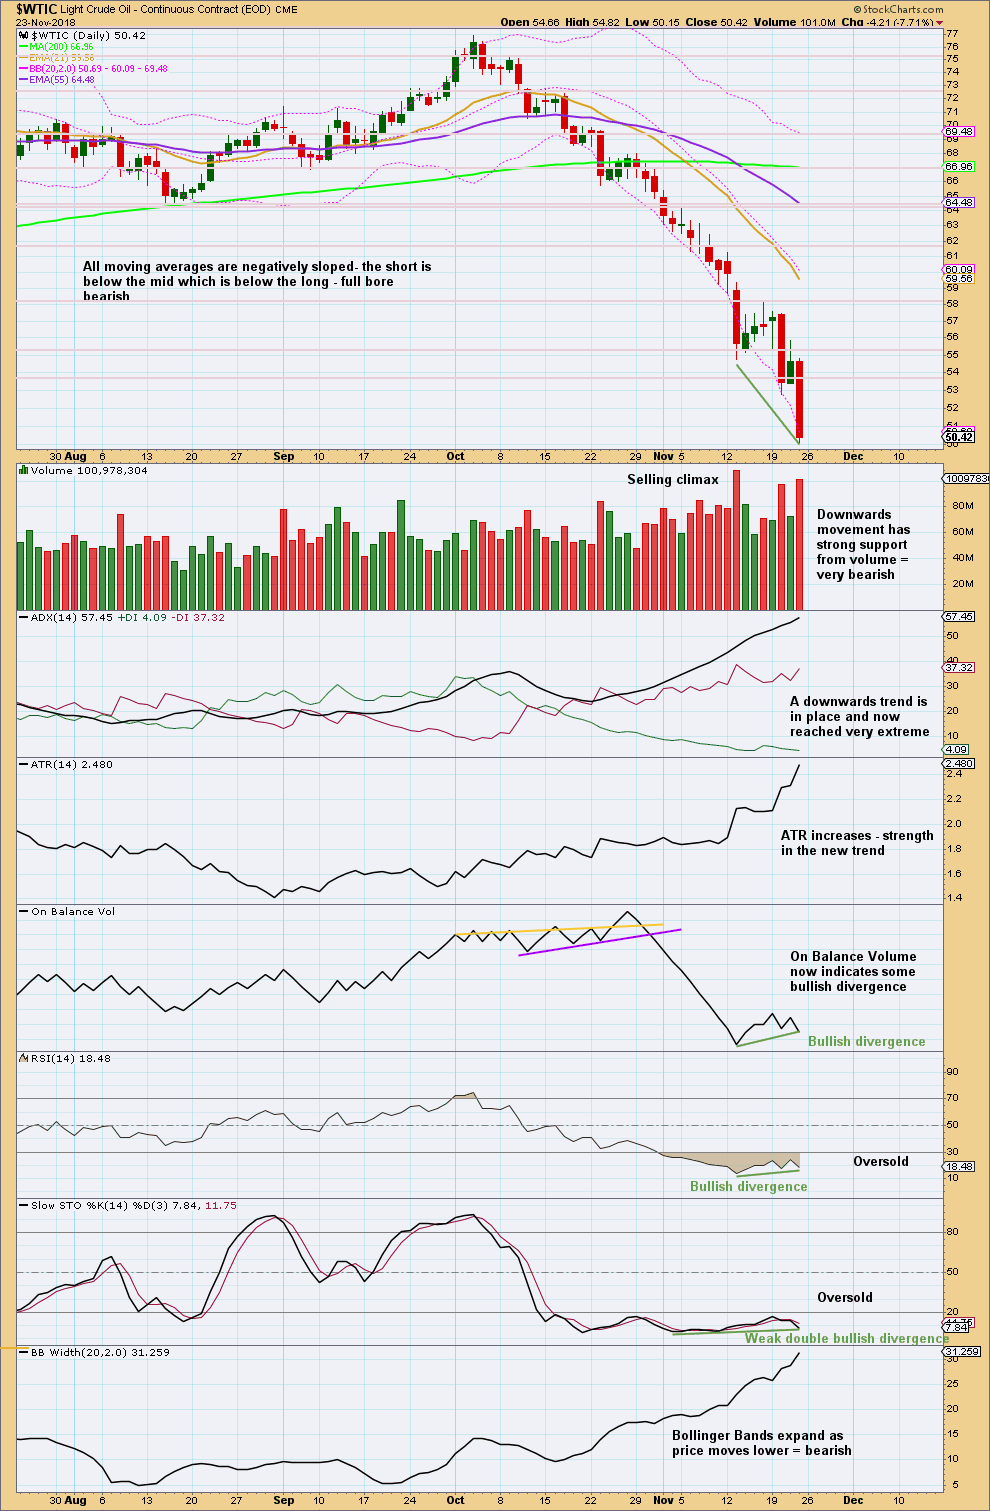
Click chart to enlarge. Chart courtesy of StockCharts.com.
I have taken some time to look back at the last strong bearish trend from Oil from about May 2014 to January 2016. I have noticed that downwards waves often end with support from volume, and sometimes do not even end with a long lower wick. Bullish reversal patterns are often but not always found at lows. RSI can reach very extreme and remain so for as long as three months when this market has a strong downwards trend. At lows Stochastics often will exhibit bullish divergence, but this can be rather weak. At lows RSI sometimes, not always, exhibits bullish divergence and can remain deeply oversold for long periods of time.
US Oil is a particularly difficult market to find lows in. It can trend strongly for very long periods of time with indicators remaining very extreme.
At this time, there is now clearly a downwards trend in place. This could continue for months yet. While price remains within the channel on the daily Elliott wave chart, expect it to continue to fall.
Expect that a low has been found only if a bullish candlestick reversal pattern appears, or the channel is clearly breached. But note that even if these occur, that any bounce may still be short lived.
—
Always practice good risk management as the most important aspect of trading. Always trade with stops and invest only 1-5% of equity on any one trade. Failure to manage risk is the most common mistake new traders make.
Hi Lara
How do you see WTI now given last 2 daily candles. Bearish engulfing candle (just) then followed by today’s which almost but not quite engulfed the other way and has a bullish tail. Can you maybe give some wave count insight at lower time frames for how WTI will reach what looks like a sensible $46.80 target. The action up still seems choppy to me but not too sure using wave counts at lower time frames to explain it. Thanks in advance
I purposefully do not give hourly charts for Lara’s Weekly analysis because I am wanting members to focus on the bigger picture and avoid the noise of lower time frames.
I do check that subdivisions fit on lower time frames when it isn’t clear.
And I also don’t want to be giving daily updates for Lara’s Weekly (I know that’s not what you’re asking for here) again because I want Lara’s Weekly members to be focussed on the bigger picture and ignore noise. And because it’s a weekly analysis service.
Price remains within the channel, the upper edge continues to provide resistance today. The last two sessions look like small range days with mostly sideways movement, it looks like another small consolidation within the downwards trend (until proven otherwise).
I don’t see the two things that I am waiting to see before calling a low in place:
1. No channel breach
2. No bullish candlestick reversal pattern
And so it would be still safest to assume the trend remains down.
Thanks Lara
Appreciate the feedback and point of view.
Awesome. Cheers Nick for your understanding.
I developed Lara’s Weekly after years of watching my members focus on really small time frames, and some get bogged down in the noise. In doing so I think some members were missing out on capturing the real gains to be made in strong trends. Too much in and out, and not enough buy and hold (or sell and hold).
I realised that my daily analysis was really only suited best to day traders.
And so Lara’s Weekly is designed specifically for traders who like to hold positions for longer. I’m aiming it for a different audience.
Like it says on the box 🙂
Hi Lara,
Looks like gold made a premature bounce around 1211. Would you be confident in a continued upward movement to 1295 at this point?
Jiten
The triangle wave count is still the preferred wave count.
I’ll only have reasonable confidence in this upwards trend if price breaks above resistance to make a new high above 1,245.
But, from the low on the 16th of August there has been a series of higher highs and higher lows on the daily chart. This is the basic definition of an upwards trend. And so it would be logical to assume the trend remains, while the last swing low on the 13th of November remains intact.
Update on the S&P500:
There’s a rare candlestick pattern at the last low. It’s a Morning Doji Star which is bullish, but because there’s a gap between the doji and the other two candlesticks, it’s also an Abandoned Baby Bottom. That’s bullish, and very rare.
The gap may provide support at 2,647.55.
Yesterday was a good upwards day with good support from volume. This is the last piece of information that has prompted me to switch my alternate wave count to now be a main wave count. I expect now that primary 4 was over on the 29th of October and price now may be in the very early stage of intermediate (3) within primary 5.
Lara, Must that gap remain left open?
It doesn’t have to remain open. But if it were to be closed that would be bearish and then the reversal pattern may be ignored.
Today it remains open. It looks like that will continue while the bull market remains intact.
Hi Lara,
Thanks for your analysis again! I was just wondering about the triangle alternative of the S&P, why you wouldn’t consider labeling the current waves as ABC (instead of Awx) which would put us relatively close to the completion of the triangle with only shorter D and E left to go?
Thanks in advance for your reply.
It’s entirely possible. It just does not have the right look, in my experience.
The sub-wave of intermediate (B) would be much shorter than triangle sub-waves, particularly wave B, usually are. When I chart it like that, it just looks very strange.
I’m considering that the alternate wave count for the S&P may actually now be the correct count. The probability today is increasing, this session looks like it will close green and complete a very nice Morning Doji Star bullish reversal pattern.
Thanks Lara! It looks like we have a bullish divergence on RSI also, should be climbing…
I’m going to now label the triangle as you suggest because it resolves some problems of proportion.
But I’m at the stage now where I may discard some wave counts that see P4 continuing.
Thanks a lot for letting us know Lara!