
Last weekly analysis of Silver expected more downwards movement. This is what has happened.
Summary: Silver has had a very long consolidation from about November 2016 to July 2017. A technical principle is the longer price consolidates, the stronger and longer lasting the next trend may be.
The breakout was down. The long-term target for the current downwards trend remains at 12.08.
The larger trend remains down until proven otherwise.
Monthly charts were reviewed here.
New updates to this analysis are in bold.
ELLIOTT WAVE COUNTS
MAIN WAVE COUNT
WEEKLY CHART – TRIANGLE
Click chart to enlarge.
This first wave count has good support from classic technical analysis, so it will be favoured. This wave count looks likely.
The first wave count expects that the bear market, which began from the April 2011 high, is incomplete.
Cycle wave a is seen as a five wave impulse for this main wave count.
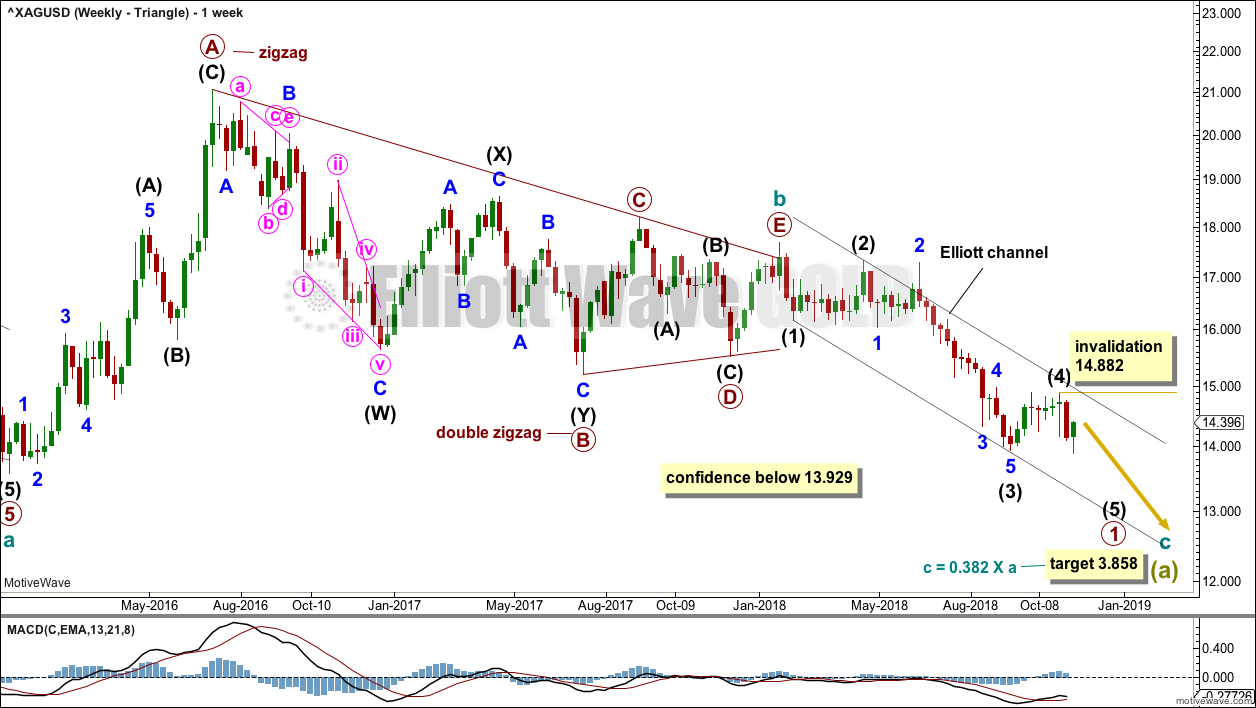
This first weekly chart sees cycle wave b as a now possibly complete regular contracting triangle.
Primary wave E of the triangle may have ended with an overshoot of the A-C trend line.
Within cycle wave c, primary wave 1 may be an incomplete impulse. Within primary wave 1, intermediate waves (1), (2), (3), and now (4) may be complete.
Within intermediate wave (5), no second wave correction may move beyond its start above 14.882.
Intermediate wave (2) was a deep 0.77 flat correction lasting ten weeks. Intermediate wave (4) may now be a complete shallow 0.28 double combination lasting seven weeks. There is perfect alternation and very good proportion. This part of the wave count now has the right look.
The Elliott channel is drawn from the ends of intermediate degree waves. Intermediate wave (4) remains contained within this channel.
A new low below 13.929 this week has added some further confidence to this wave count. The combination wave count for cycle wave b is now invalidated, so it is discarded.
DAILY CHART – TRIANGLE
Click chart to enlarge.
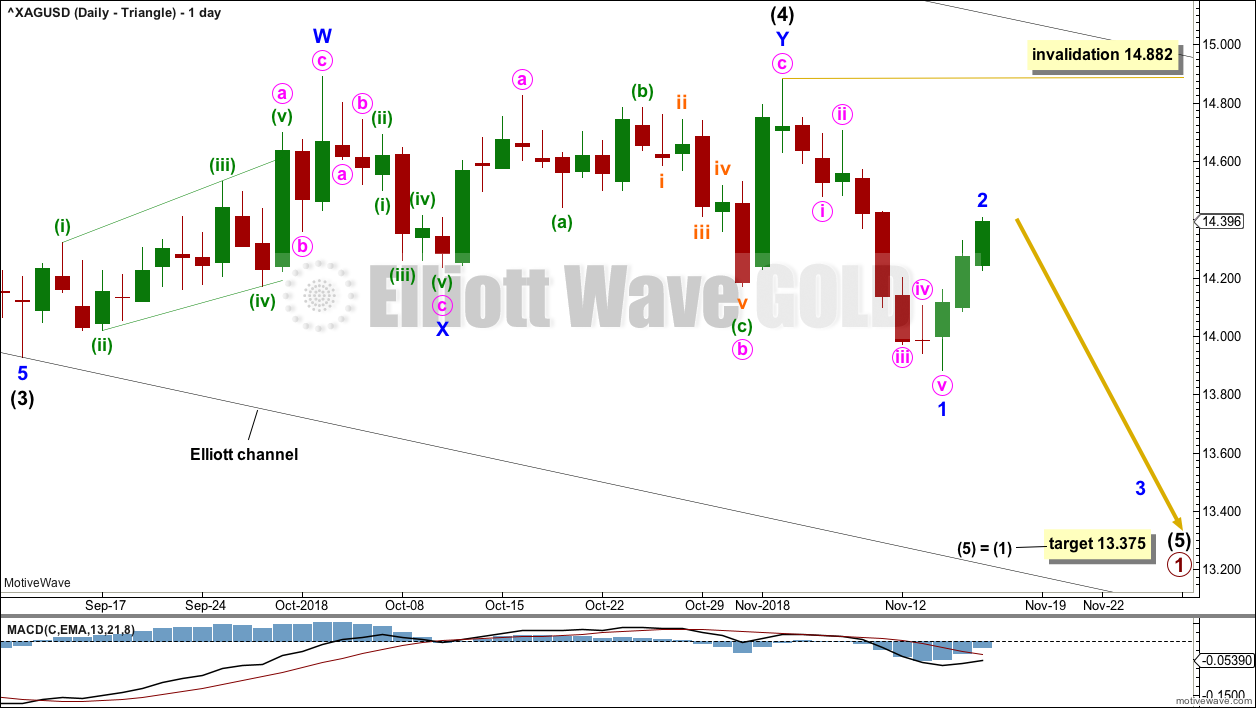
Intermediate wave (4) may be a complete double combination. The first structure in a double may be a complete zigzag labelled minor wave W. The double may be joined by a three in the opposite direction, a zigzag labelled minor wave X. The second structure in the double subdivides as a regular flat correction labelled minor wave Y.
Within intermediate wave (5), no second wave correction may move beyond the start of its first wave above 14.882.
Silver behaves like a typical commodity. It often exhibits swift strong fifth waves. While this tendency is especially prevalent for its fifth waves to end third wave impulses one degree higher, it can also show up for fifth waves to end first wave impulses. Look out for the possibility that intermediate wave (5) may be very swift and strong, ending with a selling climax. This is not a certainty, but the possibility exists and so we should be aware of it.
There is no adequate Fibonacci ratio between intermediate waves (3) and (1). This makes it more likely that intermediate wave (5) may exhibit a Fibonacci ratio to either of intermediate waves (3) or (1); the most common Fibonacci ratio for a fifth wave is equality in length with the first wave.
ALTERNATE WAVE COUNT
WEEKLY CHART – BULL WAVE COUNT
Click chart to enlarge.
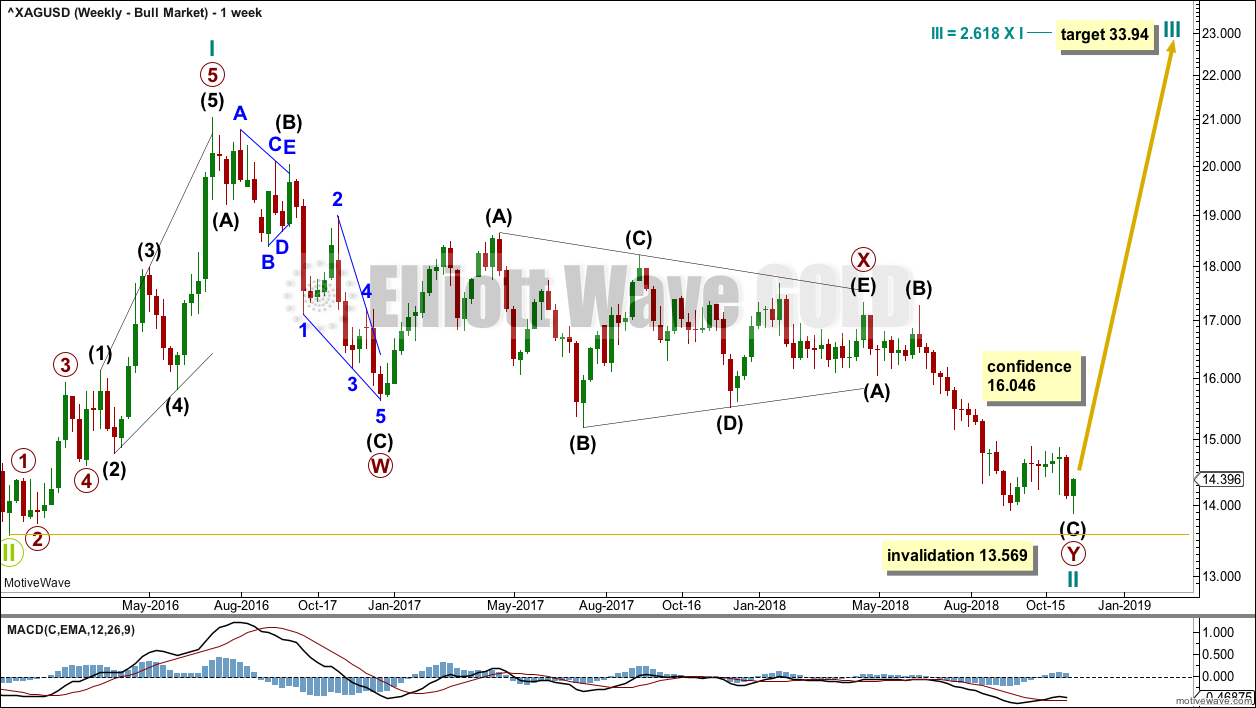
Cycle wave II may be a complete double zigzag. Cycle wave II would be very deep at 0.96 of cycle wave I. This is typical behaviour for the first second wave correction within a new trend for commodities.
If it continues any further, then cycle wave II may not move beyond the start of cycle wave I below 13.569.
DAILY CHART – BULL WAVE COUNT
Click chart to enlarge.
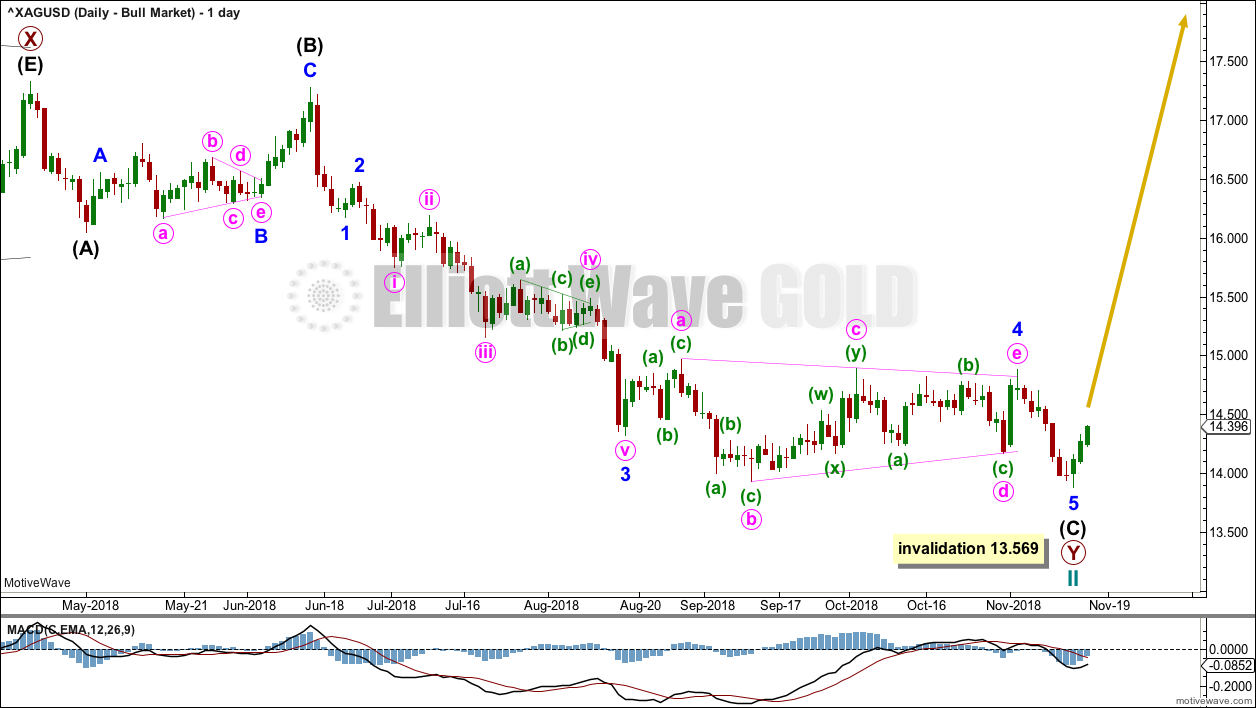
A five wave impulse (down) for intermediate wave (C) may have moved a little lower this week. However, the disproportion between minor waves 2 and 4 gives this wave count the wrong look.
If cycle wave II is over, then the new trend up for cycle wave III should begin with a five wave structure.
TECHNICAL ANALYSIS
WEEKLY CHART
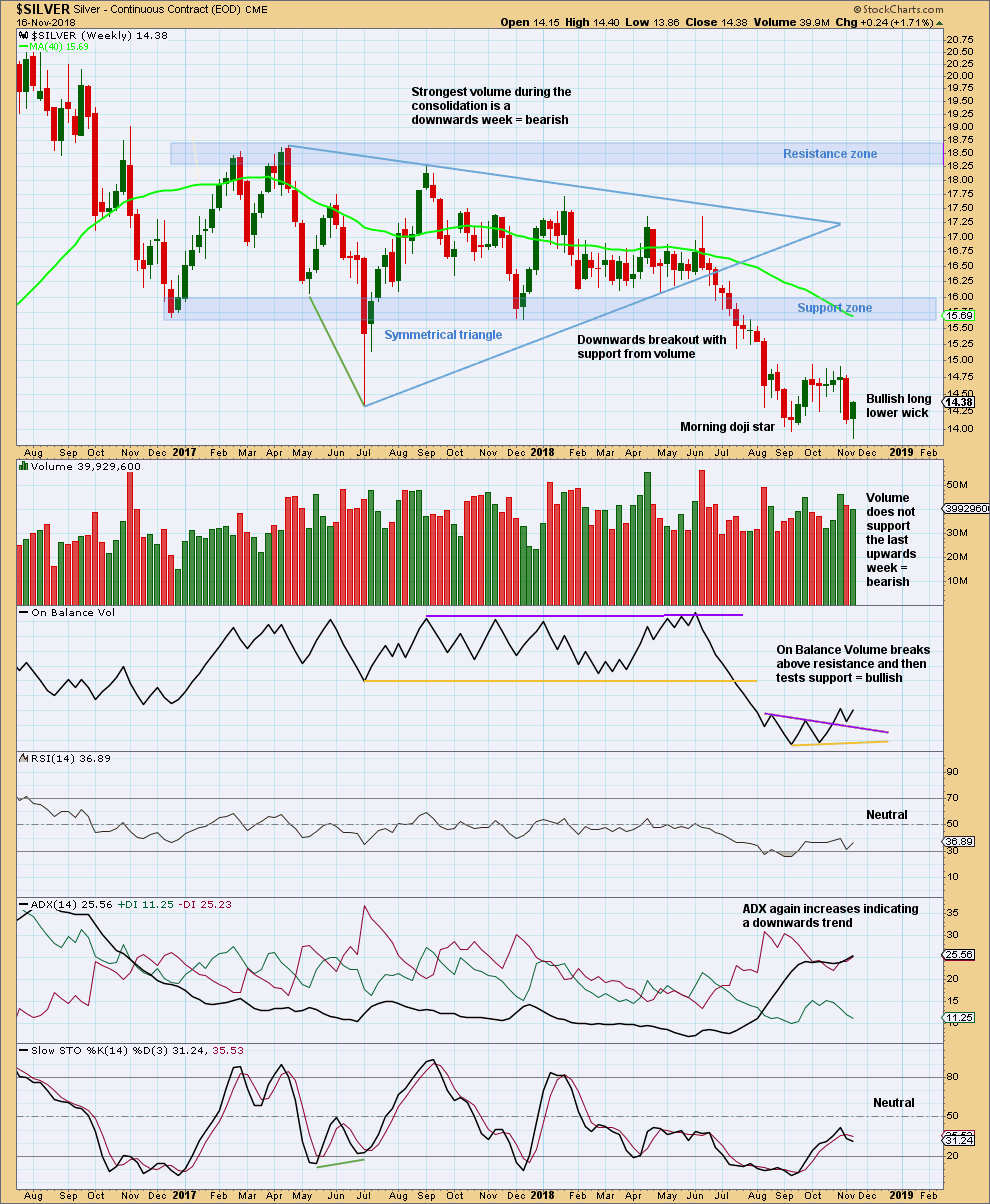
Click chart to enlarge. Chart courtesy of StockCharts.com.
Silver has seen a classic downwards breakout from the shaded support zone, which then provided resistance for a small back test.
A target from the breakout of the symmetrical triangle is about 12.08.
The week has closed strongly this week, despite a new low. This last weekly candlestick is bullish.
DAILY CHART
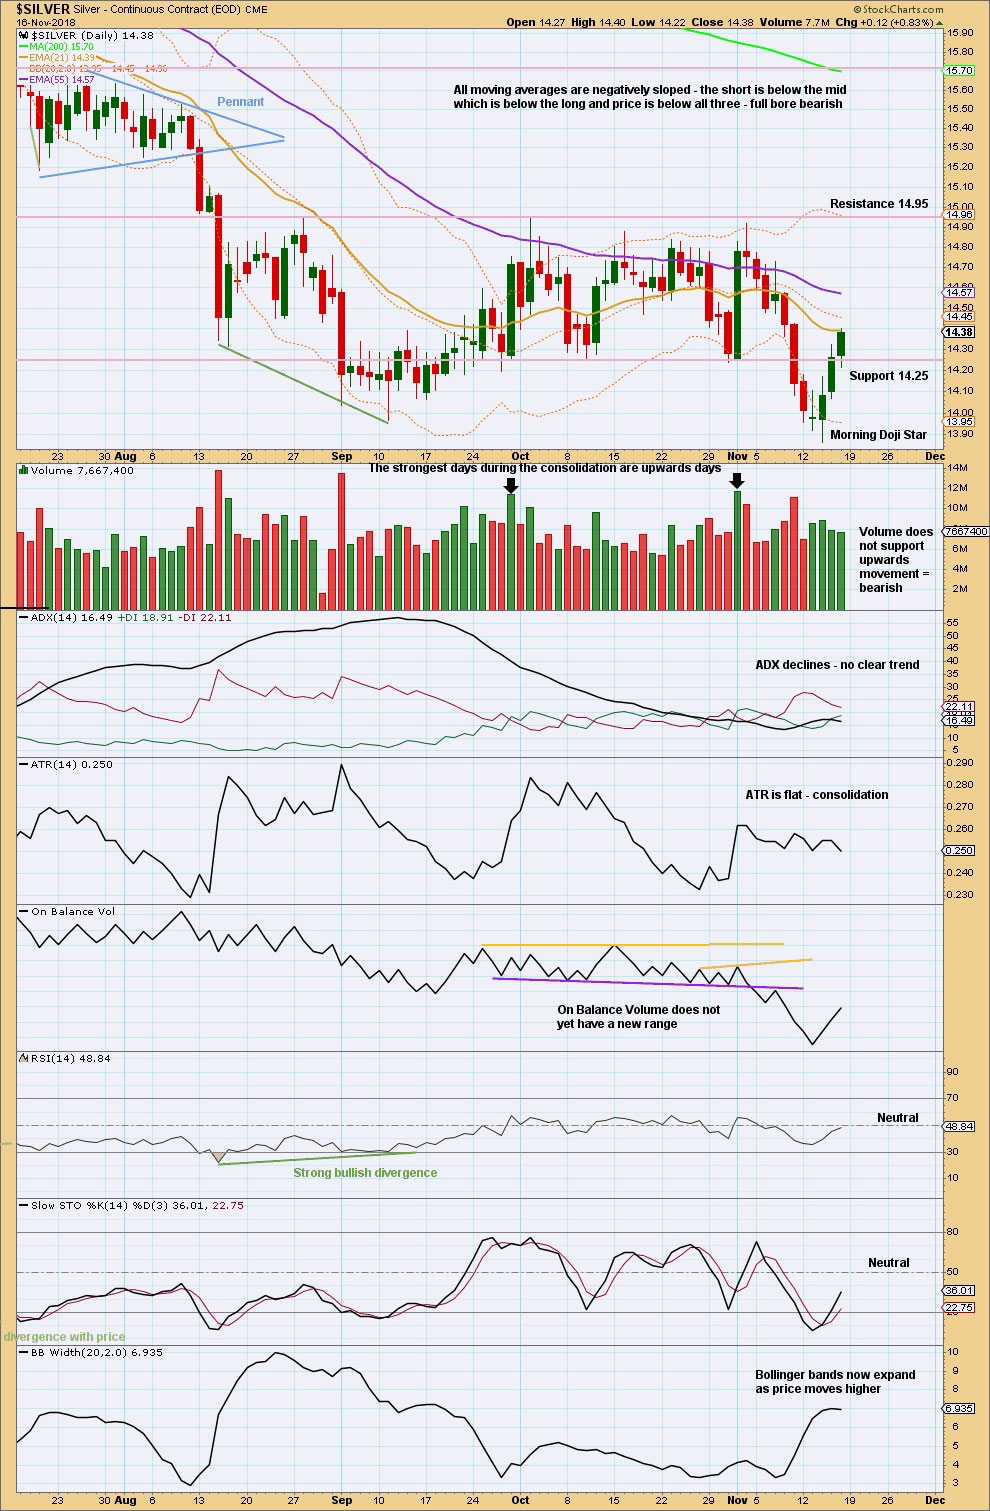
Click chart to enlarge. Chart courtesy of StockCharts.com.
The short-term volume profile supports the main Elliott wave count.
The Morning Doji Star indicates a reversal, but it makes no comment on how far or for how long the next trend may be.
Published @ 04:08 a.m. EST on November 18, 2018.
—
Careful risk management protects your trading account(s).
Follow my two Golden Rules:
1. Always trade with stops.
2. Risk only 1-5% of equity on any one trade.
Silver to gold ratio last week had reversal bullish candle pattern in weekly chart. It came with bullish divergence on RSI. plus OBV reversed. SGR is indicator for trend reversal. Similar pattern was observed in Feb 2016 when bottom was formed.
Yes price needs to move higher than two shaded areas for confirmation.
Thanks Lara.
Thanks for sharing it. That is an interesting perspective!