
Friday saw price break out from an identified consolidation zone. This favours the first Elliott wave count.
Summary: The consolidation for a fourth wave looks likely to be over. Friday saw a downwards breakout with support from volume. The next short-term target is about 13.375.
Silver has had a very long consolidation from about November 2016 to July 2017. A technical principle is the longer price consolidates, the stronger and longer lasting the next trend may be.
The breakout was down. The long-term target for the current downwards trend remains at 12.08. This week looks like a small consolidation within this downwards trend may have ended. The downwards trend may now resume with force.
The larger trend remains down until proven otherwise.
Monthly charts were reviewed here.
New updates to this analysis are in bold.
ELLIOTT WAVE COUNTS
MAIN WAVE COUNT
WEEKLY CHART – TRIANGLE
Click chart to enlarge.
This first wave count has good support from classic technical analysis, so it will be favoured. This wave count looks likely.
The first wave count expects that the bear market, which began from the April 2011 high, is incomplete.
Cycle wave a is seen as a five wave impulse for this main wave count. There are multiple corrective structures possible still for cycle wave b.
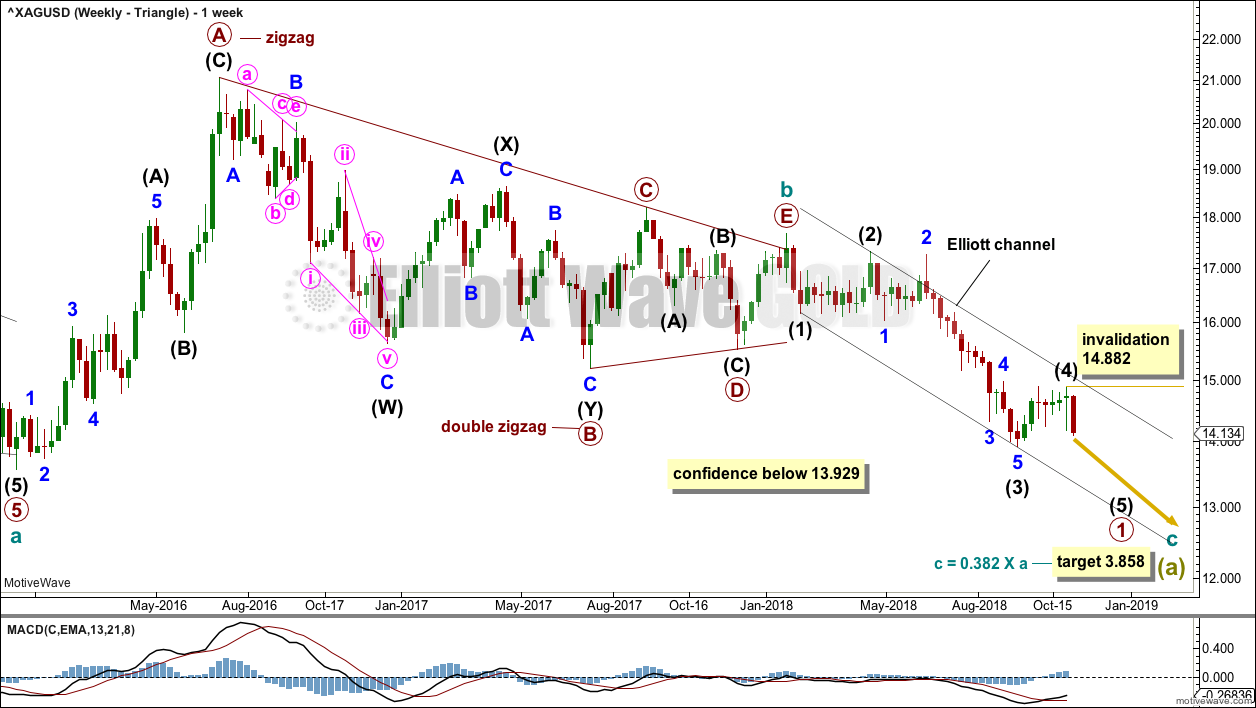
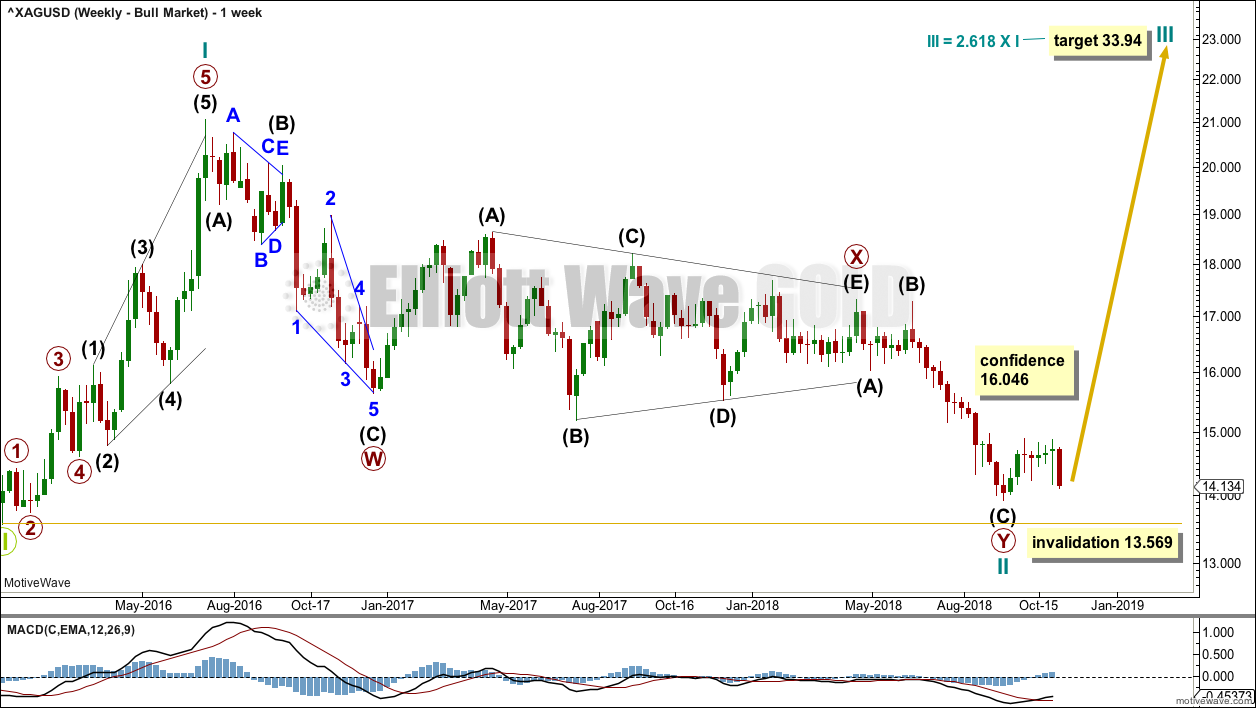
This first weekly chart sees cycle wave b as a now possibly complete regular contracting triangle.
Primary wave E of the triangle may have ended with an overshoot of the A-C trend line.
Within cycle wave c, primary wave 1 may be an incomplete impulse. Within primary wave 1, intermediate waves (1), (2), (3), and now (4) may be complete.
Within intermediate wave (5), no second wave correction may move beyond its start above 14.882.
Intermediate wave (2) was a deep 0.77 flat correction lasting ten weeks. Intermediate wave (4) may now be a complete shallow 0.28 double combination lasting seven weeks. There is perfect alternation and very good proportion. This part of the wave count now has the right look.
The Elliott channel is drawn from the ends of intermediate degree waves. Intermediate wave (4) remains contained within this channel.
At this stage, a new low below 13.929 would add further confidence to this wave count.
DAILY CHART – TRIANGLE
Click chart to enlarge.
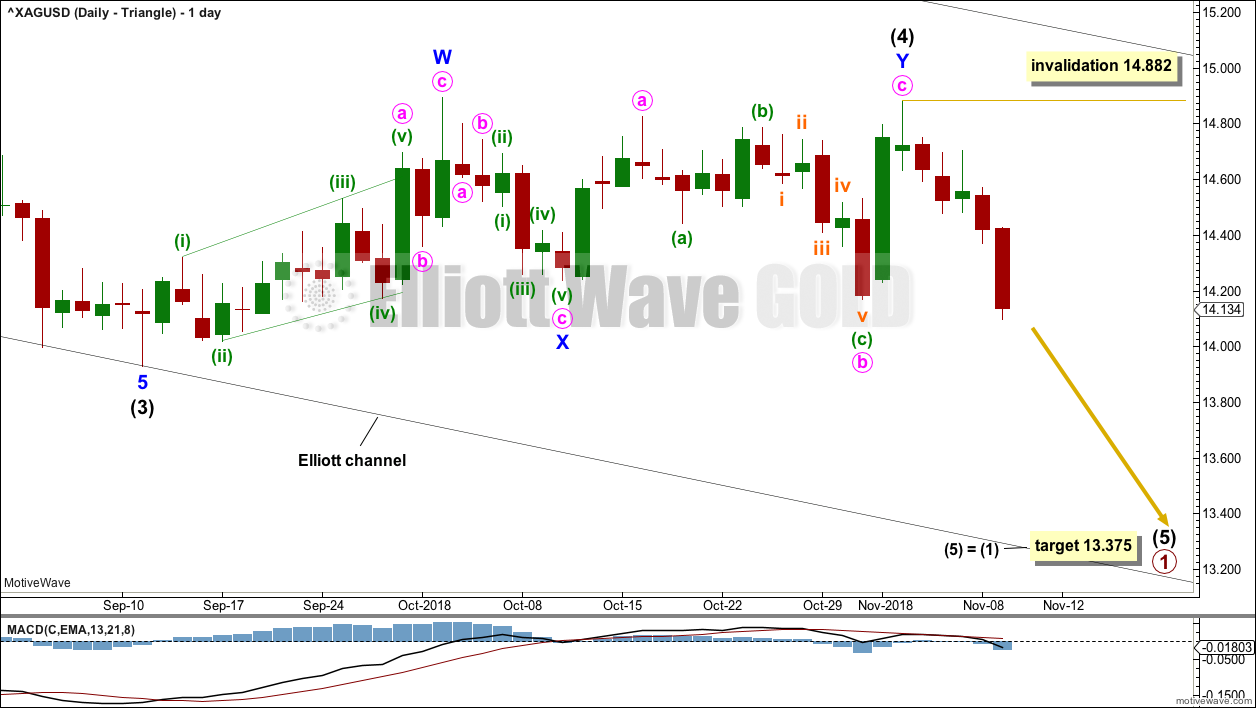
Intermediate wave (4) may be a complete double combination. The first structure in a double may be a complete zigzag labelled minor wave W. The double may be joined by a three in the opposite direction, a zigzag labelled minor wave X. The second structure in the double subdivides as a regular flat correction labelled minor wave Y.
Within intermediate wave (5), no second wave correction may move beyond the start of its first wave above 14.882.
Silver behaves like a typical commodity. It often exhibits swift strong fifth waves. While this tendency is especially prevalent for its fifth waves to end third wave impulses one degree higher, it can also show up for fifth waves to end first wave impulses. Look out for the possibility that intermediate wave (5) may be very swift and strong, ending with a selling climax. This is not a certainty, but the possibility exists and so we should be aware of it.
There is no adequate Fibonacci ratio between intermediate waves (3) and (1). This makes it more likely that intermediate wave (5) may exhibit a Fibonacci ratio to either of intermediate waves (3) or (1); the most common Fibonacci ratio for a fifth wave is equality in length with the first wave.
WEEKLY CHART – COMBINATION
Click chart to enlarge.
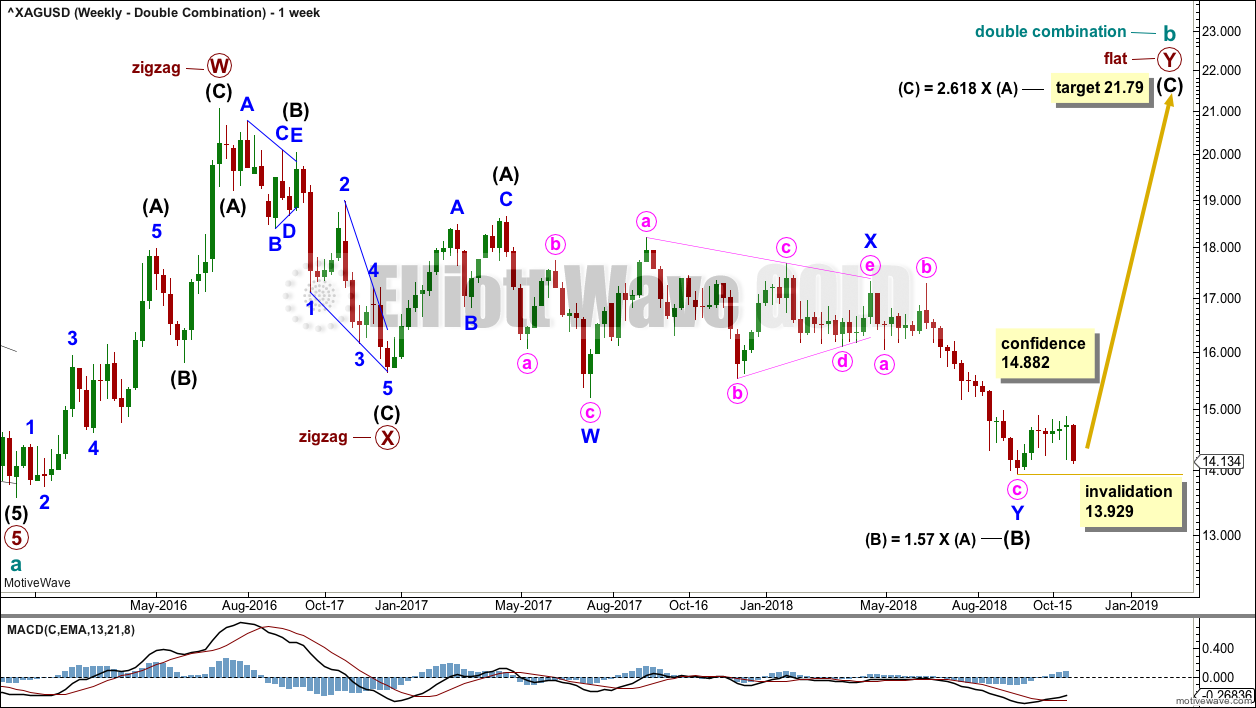
Cycle wave b may still be completing as a double combination: zigzag – X – flat. The second structure, a flat correction for primary wave Y, may be underway.
Within a flat correction, intermediate wave (B) has now met and passed the minimum 0.9 length of intermediate wave (A) at 15.938.
The purpose of combinations is to take up time and move price sideways. To achieve this purpose the second structure in the double normally ends about the same level as the first.
Intermediate wave (B) should be over for this wave count. Intermediate wave (C) may now continue as a large five wave motive structure higher. A target is calculated for intermediate wave (C) that expects it to end reasonably close to the 21.062, so that primary wave Y ends about the same level as primary wave W.
Within intermediate wave (C), no second wave correction may move beyond its start below 13.929.
DAILY CHART – COMBINATION
Click chart to enlarge.
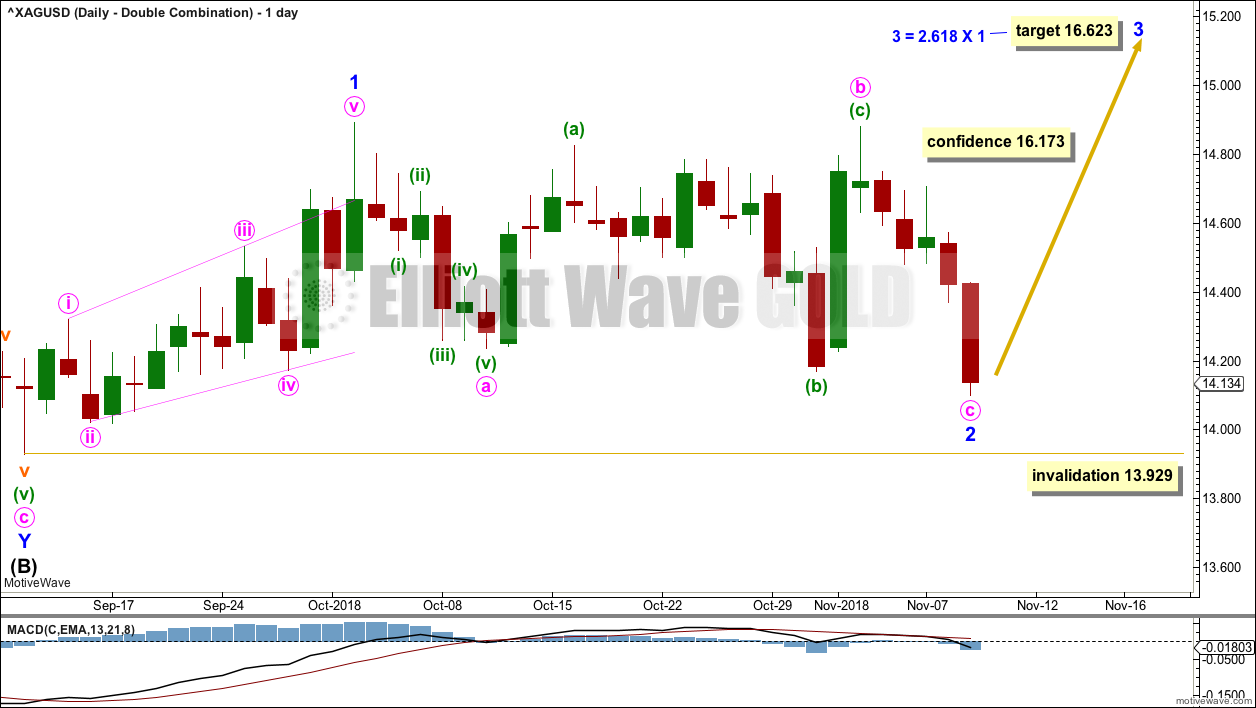
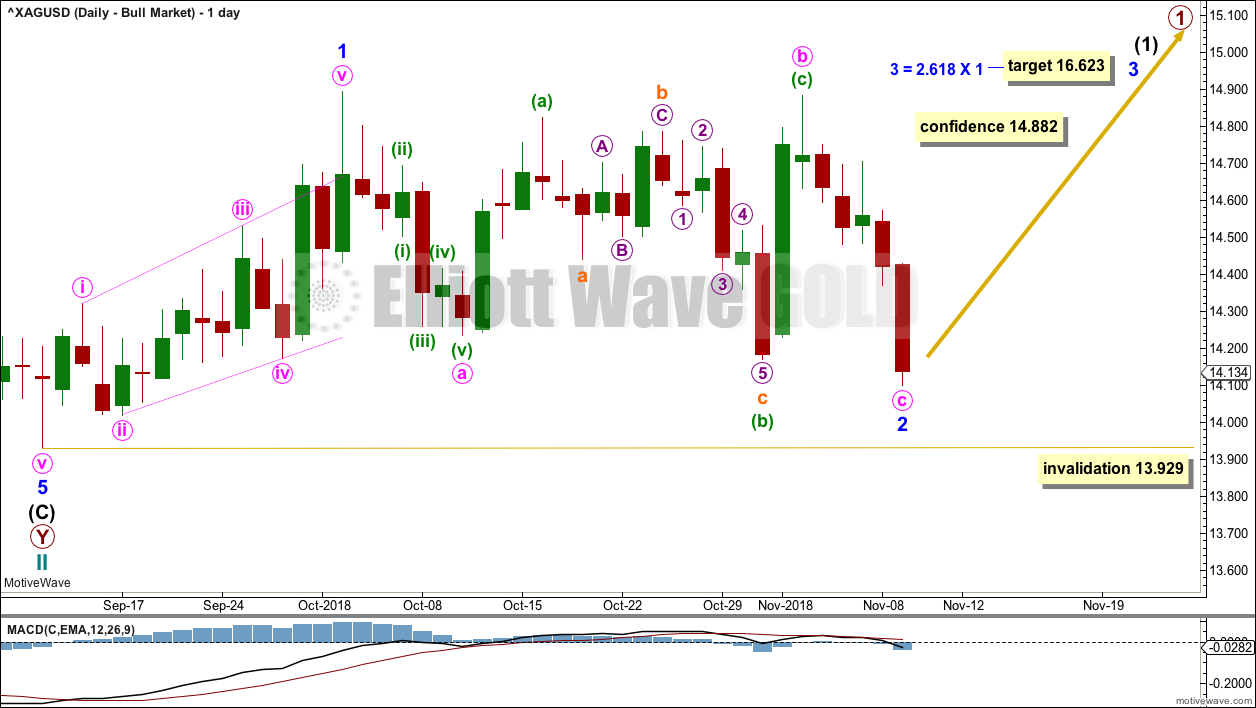
Minor wave 2 may now be a complete deep 0.82 zigzag. For Silver, the first second wave correction within a new trend is often very deep and so this follows a common pattern.
For the short term, a new high now above 14.882 next week would add a little confidence to this wave count.
Because minor wave 2 is very deep, the 2.618 Fibonacci ratio is used to calculate a target for minor wave 3 to end.
Minor wave 2 may not move beyond the start of minor wave 1 below 13.929.
ALTERNATE WAVE COUNT
WEEKLY CHART – BULL WAVE COUNT
Click chart to enlarge.
Cycle wave II may be a complete double zigzag. Cycle wave II would be very deep at 0.95 of cycle wave I. This is typical behaviour for the first second wave correction within a new trend for commodities.
If it continues any further, then cycle wave II may not move beyond the start of cycle wave I below 13.569.
DAILY CHART – BULL WAVE COUNT
Click chart to enlarge.
A five wave impulse (down) for intermediate wave (C) may be complete for this wave count.
If cycle wave II is over, then the new trend up for cycle wave III should begin with a five wave structure. That may now be a complete leading expanding diagonal, which is labelled minor wave 1. Minor wave 2 may have completed as a zigzag this week.
A target is calculated for minor wave 3. If minor wave 2 continues any lower, it may not move beyond the start of minor wave 1 below 13.929.
TECHNICAL ANALYSIS
WEEKLY CHART
Click chart to enlarge. Chart courtesy of StockCharts.com.
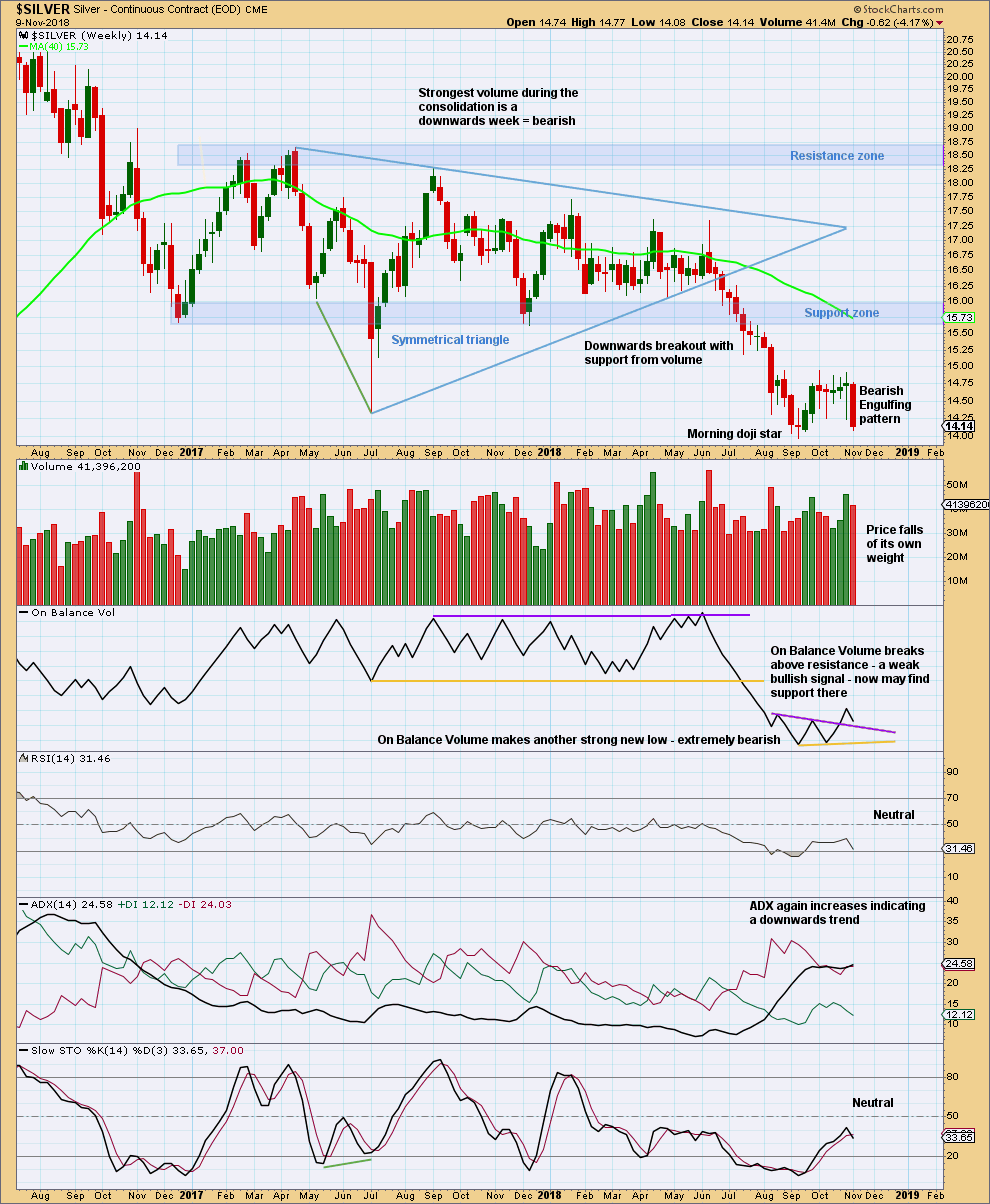
Silver has seen a classic downwards breakout from the shaded support zone, which then provided resistance for a small back test.
A target from the breakout of the symmetrical triangle is about 12.08.
This weekly candlestick completes a strong Bearish Engulfing pattern. It looks like a small consolidation lasting seven weeks may have ended this week. If price can break below the last swing low at 13.96, that would add confidence to the view that the downwards trend is resuming.
DAILY CHART
Click chart to enlarge. Chart courtesy of StockCharts.com.
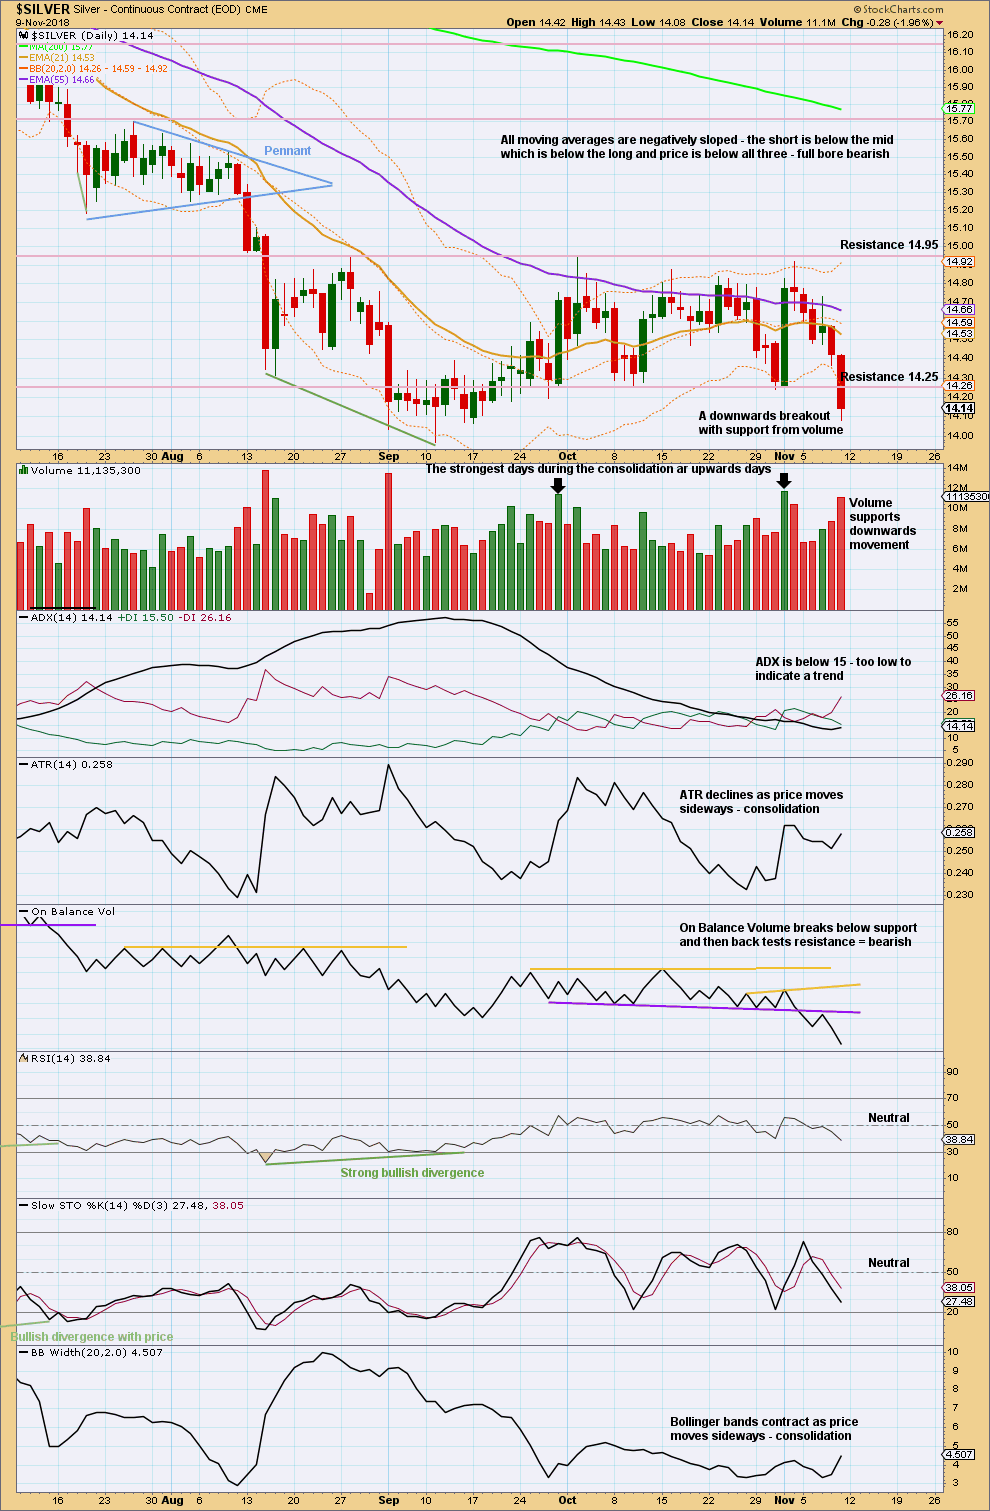
Friday may have seen a downwards breakout from a consolidation if support (which may now be resistance) was correctly identified as at 14.25. For stronger confidence in a downwards breakout price needs to close below 13.96 to make a new swing low.
On Balance Volume is very bearish. Volume supports downwards movement. It looks most likely to continue next week.
Published @ 10:28 p.m. EST on November 11, 2018.
—
Careful risk management protects your trading account(s).
Follow my two Golden Rules:
1. Always trade with stops.
2. Risk only 1-5% of equity on any one trade.
Thx for the analysis. I think it’d be ew technicians silver would believe silver drops below $4. In reality, most of silver mining companies would shut down the entire operations if silver drops below $10. Why work for losses?
Not saying it’s going to happen, but I wouldn’t rule out a trip back down to the $4. range. Look at all the touches to that price over a 20 year period. Yea, some miners will go out of business, but others will come to life when price eventually rises.
Chart by Fullgoldcrown
That means gas would be less than $1 a gallon if silver drops to $4. 🙂
Don’t know about that, but the Correlation tool on Stockcharts shows that there is no consistent correlation between Silver and Unleaded Gas… The correlation swings wildly from a positive to a negative correlation
Good to know, we’ll see. The <$4 silver target price would scare most of the silver investors jump the boat or short the silver futures (which is the worst thing to do).