
A pullback or a time consuming consolidation was expected after last analysis on the 26th of August. Price continued lower until the 20th of September and from there has bounced up strongly.
This analysis will attempt to determine if the bounce is just an upwards swing within an ongoing consolidation or the start of a new upwards trend.
Summary: Price is within a small consolidation. It looks like an upwards breakout may be more likely than downwards. A close above resistance about 96.80 on an upwards day with support from volume would be an upwards breakout. If that happens, then look for the upwards move to end about 97.19 to 97.87.
New updates to this analysis are in bold.
BEARISH ELLIOTT WAVE ANALYSIS
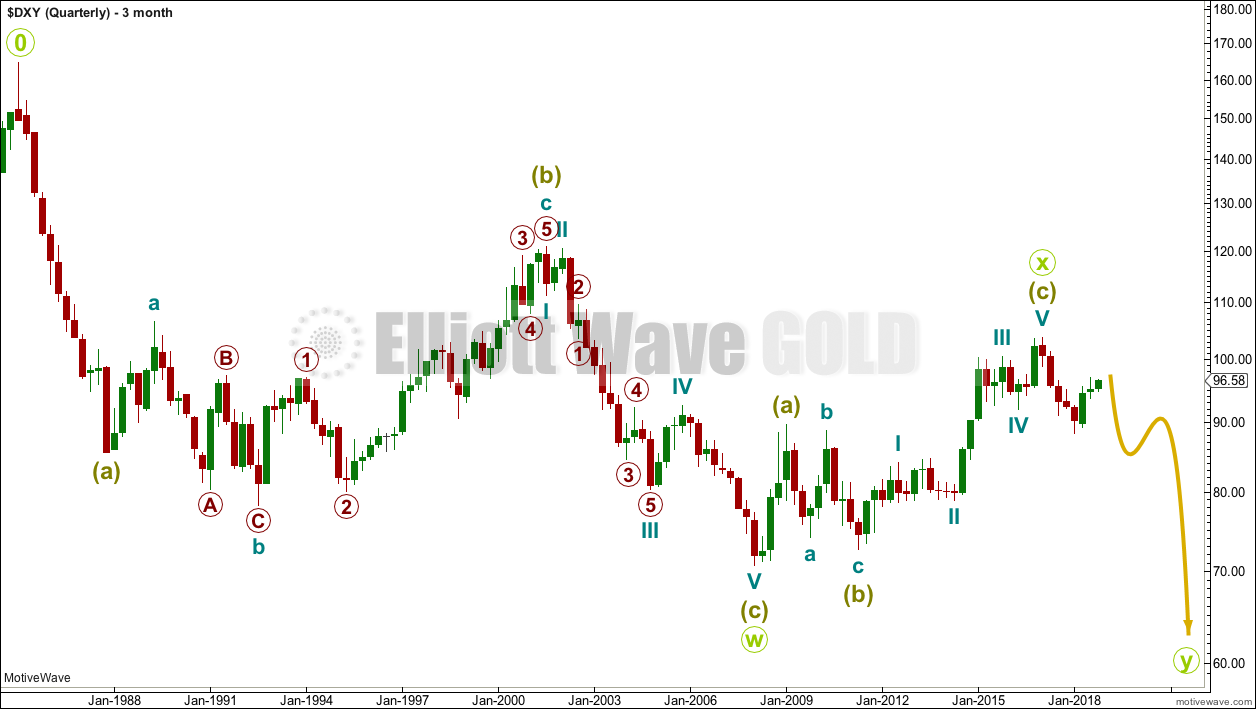
QUARTERLY CHART
Click chart to enlarge.
The wave count begins at 0.
A huge double zigzag may be continuing lower.
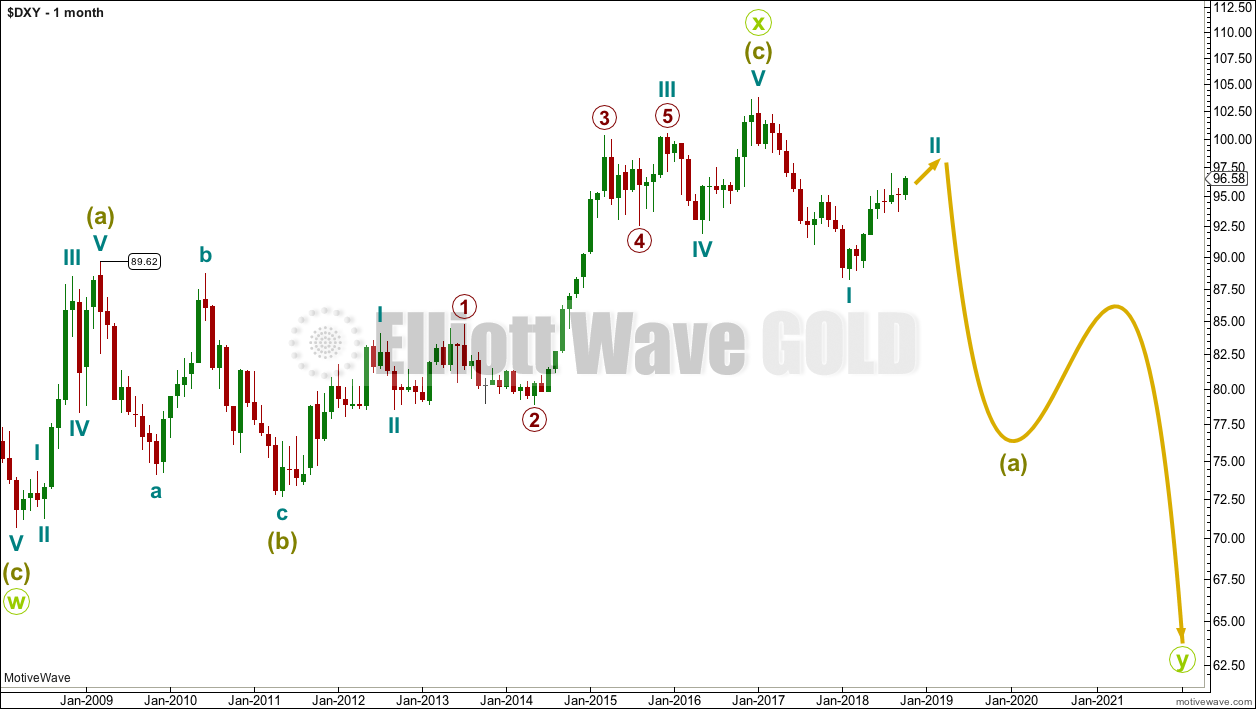
MONTHLY CHART
Click chart to enlarge.
Downwards movement from the high in January 2017 cannot be a fourth wave correction within an ongoing impulse higher because a new low below 89.62 would be back in first wave price territory.
That indicates the last big wave up may be a completed three, and for that reason this is my main wave count.
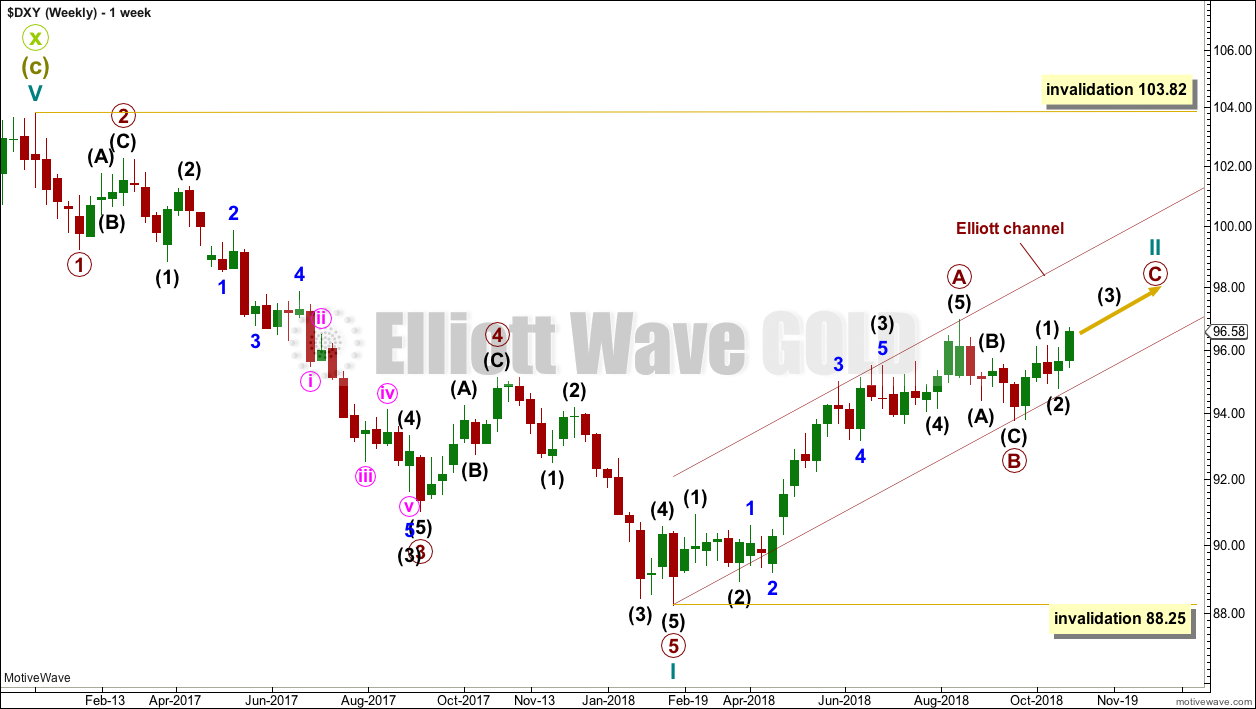
WEEKLY CHART
Click chart to enlarge.
Cycle wave I downwards fits very well as a five wave impulse. This may be reasonably expected to be followed by a three wave structure upwards.
For the USD Index, historically the first second wave correction within a new trend is usually extremely deep, about 0.80 to 0.90 of the first wave it corrects. It would be typical here to see Cycle wave II reach to 0.80 or deeper of cycle wave I. If my target on the daily chart below is wrong, it may not be high enough.
Cycle wave II may be unfolding as a zigzag, which is the most common type of corrective structure.
Primary wave A may now be a completed five wave impulse.
Primary wave B may be complete as labelled on this weekly chart. However, it may also be labelled as incomplete as per the labelling for this movement on the alternate weekly chart below.
If primary wave B continues, then it may be as a flat, combination, double zigzag or triangle. Primary wave B may not move beyond the start of primary wave A below 88.25.
Cycle wave II may not move beyond the start of cycle wave I above 103.82.
Draw a channel about cycle wave II as shown. This is Elliott’s technique for a correction. Primary wave C may end either mid way within the channel or about the upper edge.
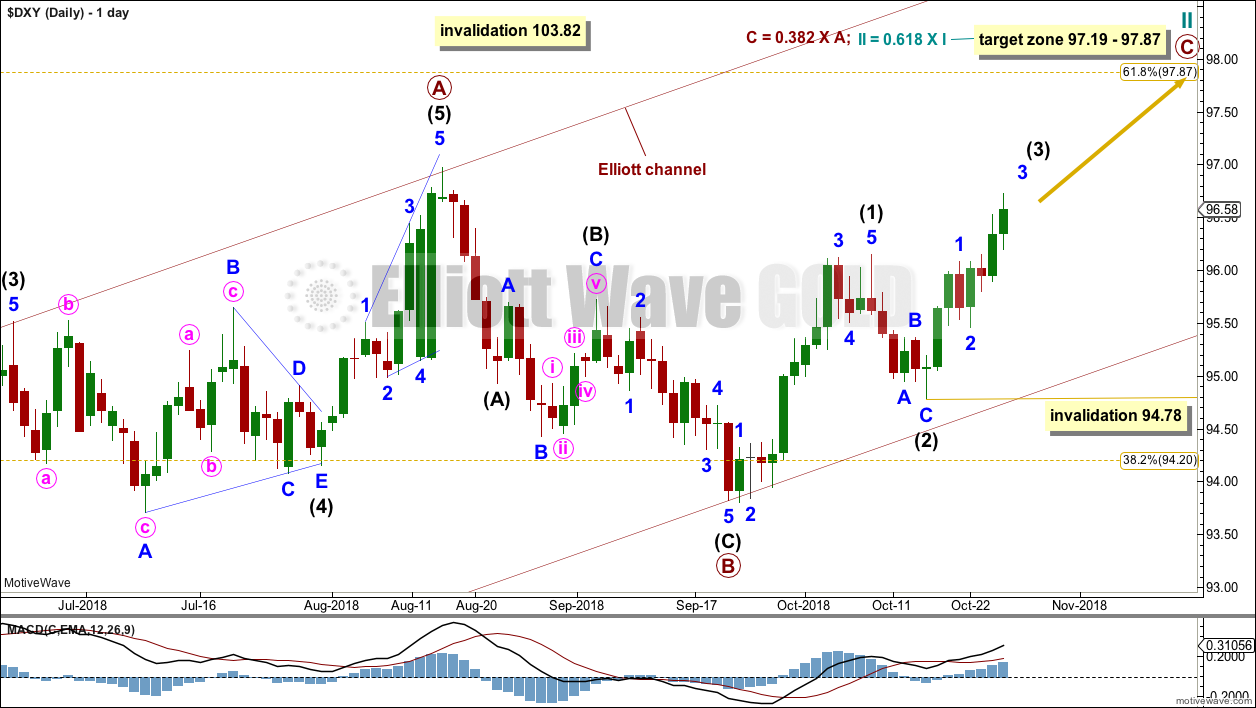
DAILY CHART
Click chart to enlarge.
If primary wave B is complete, then primary wave C should have begun. Primary wave B will fit as a brief and shallow zigzag. This is entirely possible; B waves exhibit the greatest variety in Elliott wave structure and price behaviour.
Within primary wave C, intermediate waves (1) and (2) may now be complete. Intermediate wave (3) may have begun.
Within intermediate wave (3), no second wave correction may move beyond the start of its first wave below 94.78.
Intermediate wave (3) may now be ready to exhibit an increase in upwards momentum, as the middle strongest portion of it passes. This may have the strength to effect an upwards breakout from the current consolidation. If price closes above resistance about 97 on an upwards day with support from volume, then have confidence that a third wave up at two degrees is underway.
It is also possible to move the degree of labelling within primary wave B all down one degree and see it as an incomplete flat, combination or triangle.
BULLISH ELLIOTT WAVE ANALYSIS
QUARTERLY CHART
Click chart to enlarge.
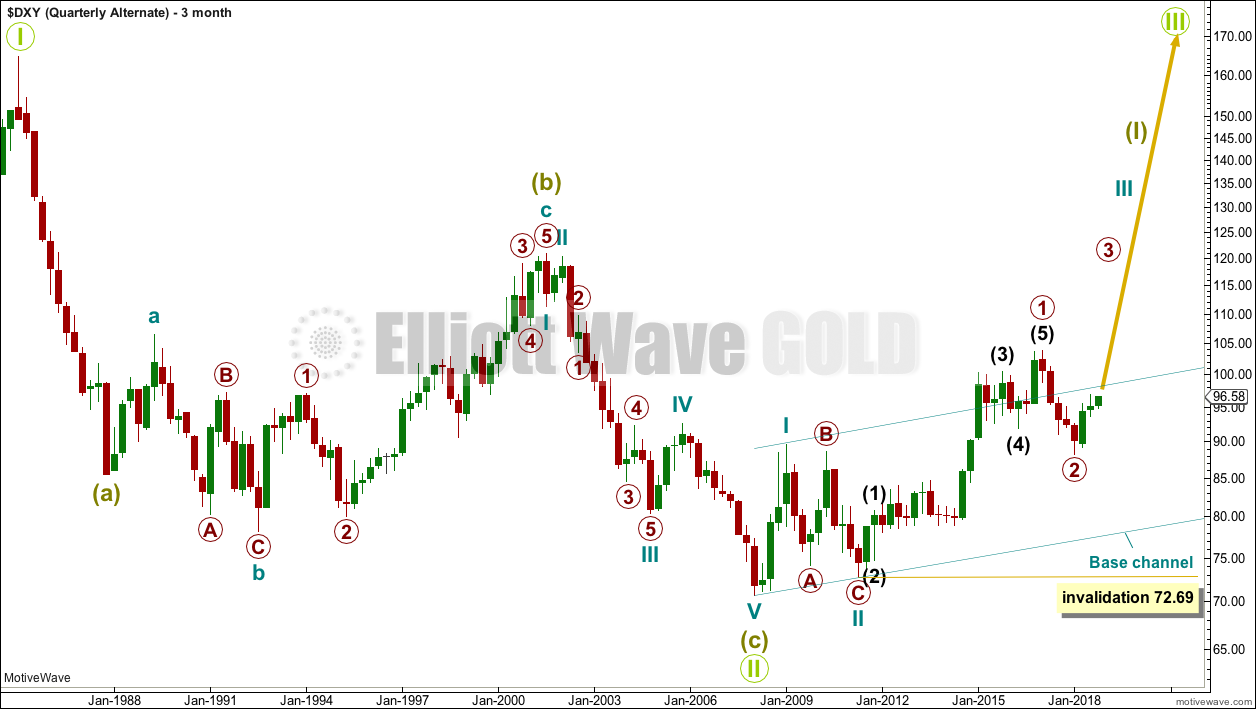
A single zigzag down to the last major low may still be complete.
A new upwards trend may continue. So far there may be two overlapping first and second waves. Primary wave 2 may not move beyond the start of primary wave 1 below 72.69.
Primary wave 2 should find strong support at the lower edge of the teal base channel if it gets down that low.
MONTHLY CHART
Click chart to enlarge.
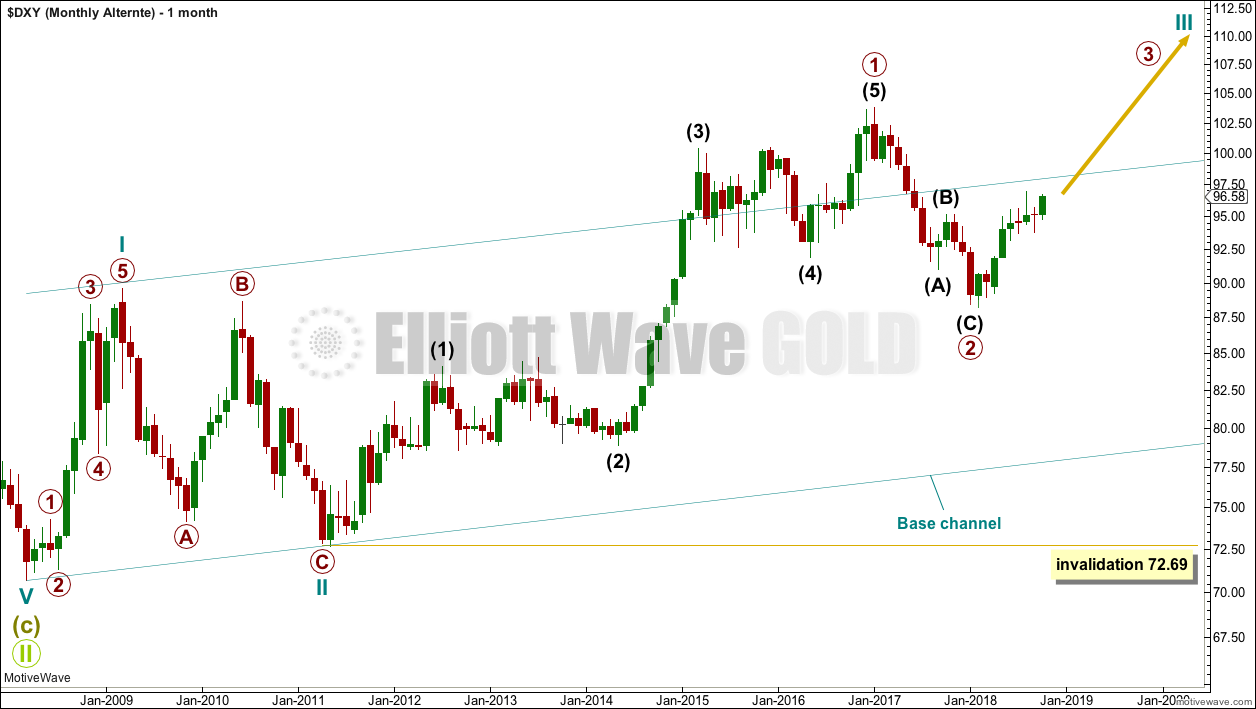
Primary wave 2 may be a complete zigzag. However, this wave down can also be seen as a five and primary wave 2 may yet continue lower.
WEEKLY CHART
Click chart to enlarge.
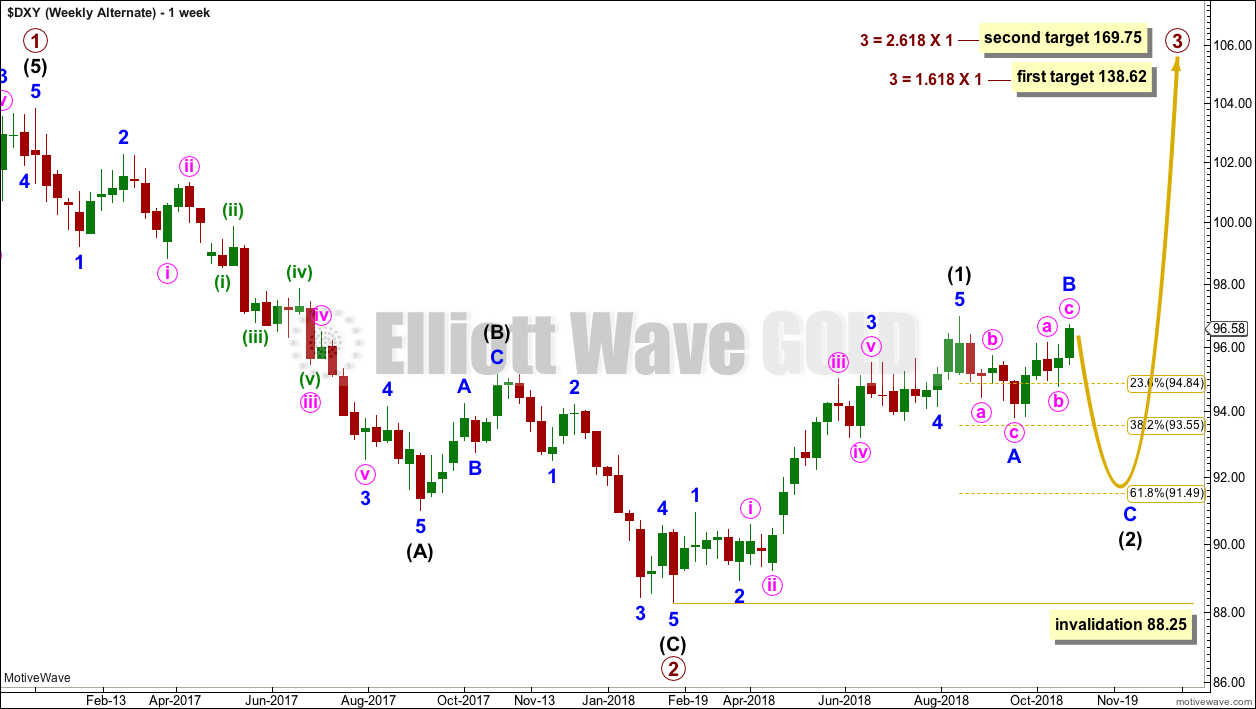
This bullish wave count sees the last wave down as a completed zigzag. If this is correct, then within primary wave 3 no second wave correction may move beyond its start below 88.25.
Intermediate wave (2) may be an incomplete flat, double zigzag or combination. The first wave down within it is labelled minor wave A; this is a complete zigzag. Minor wave B may now be complete or almost complete, but it may continue higher to make a new high above the start of minor wave A at 96.98 as in an expanded flat.
When minor wave B is complete, then minor wave C may move below the end of minor wave A at 93.81 to avoid a truncation.
TECHNICAL ANALYSIS
MONTHLY CHART
Click chart to enlarge. Chart courtesy of StockCharts.com.
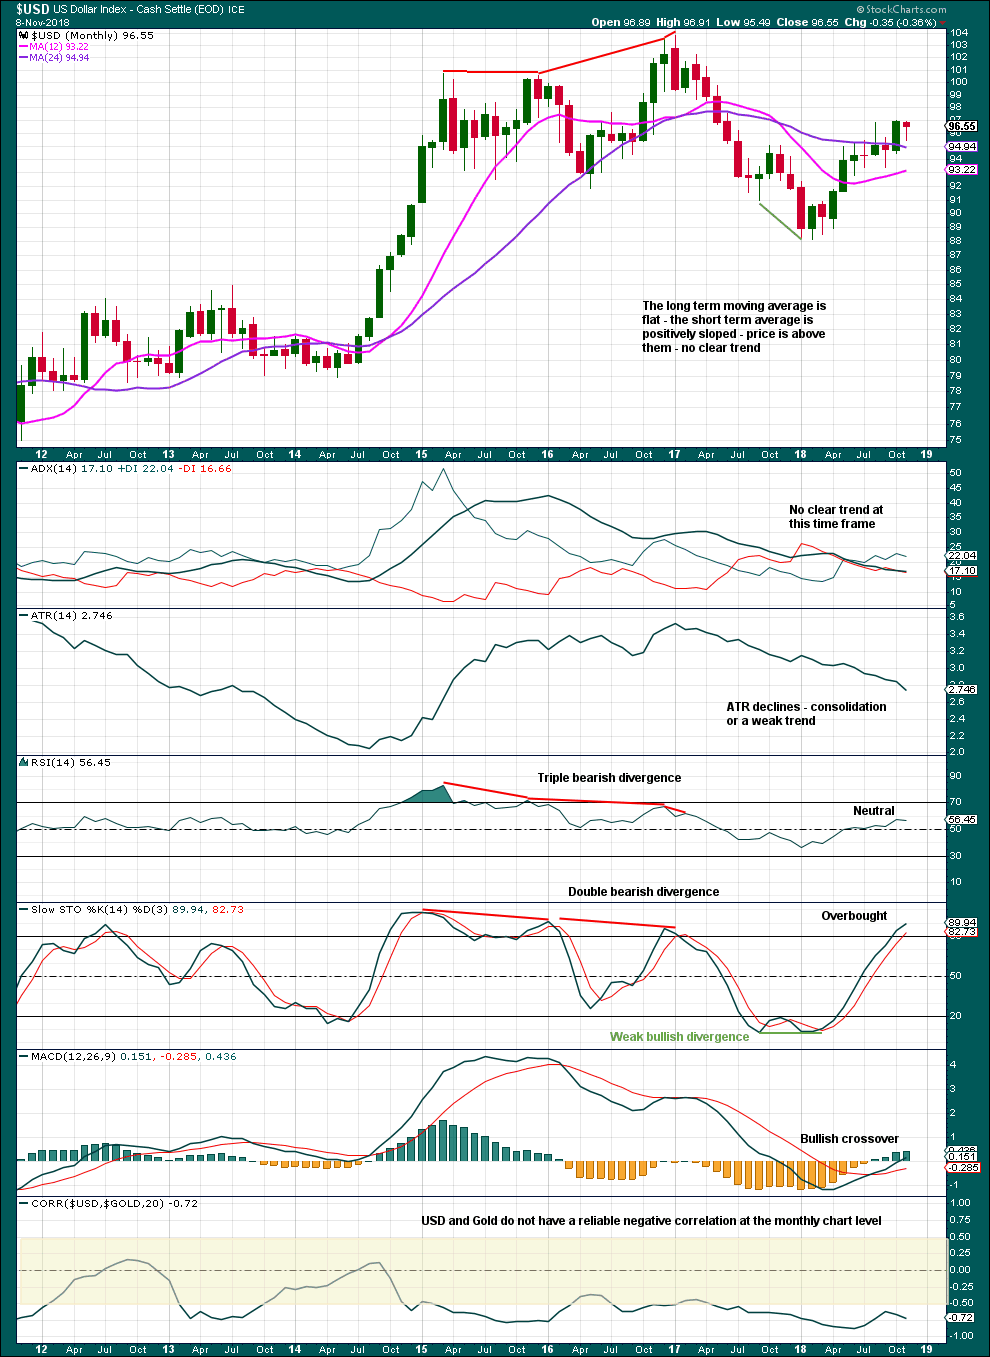
October was a strong bullish month. This may be reasonably expected to be followed by more upwards movement. This supports the main Elliott wave count.
DAILY CHART
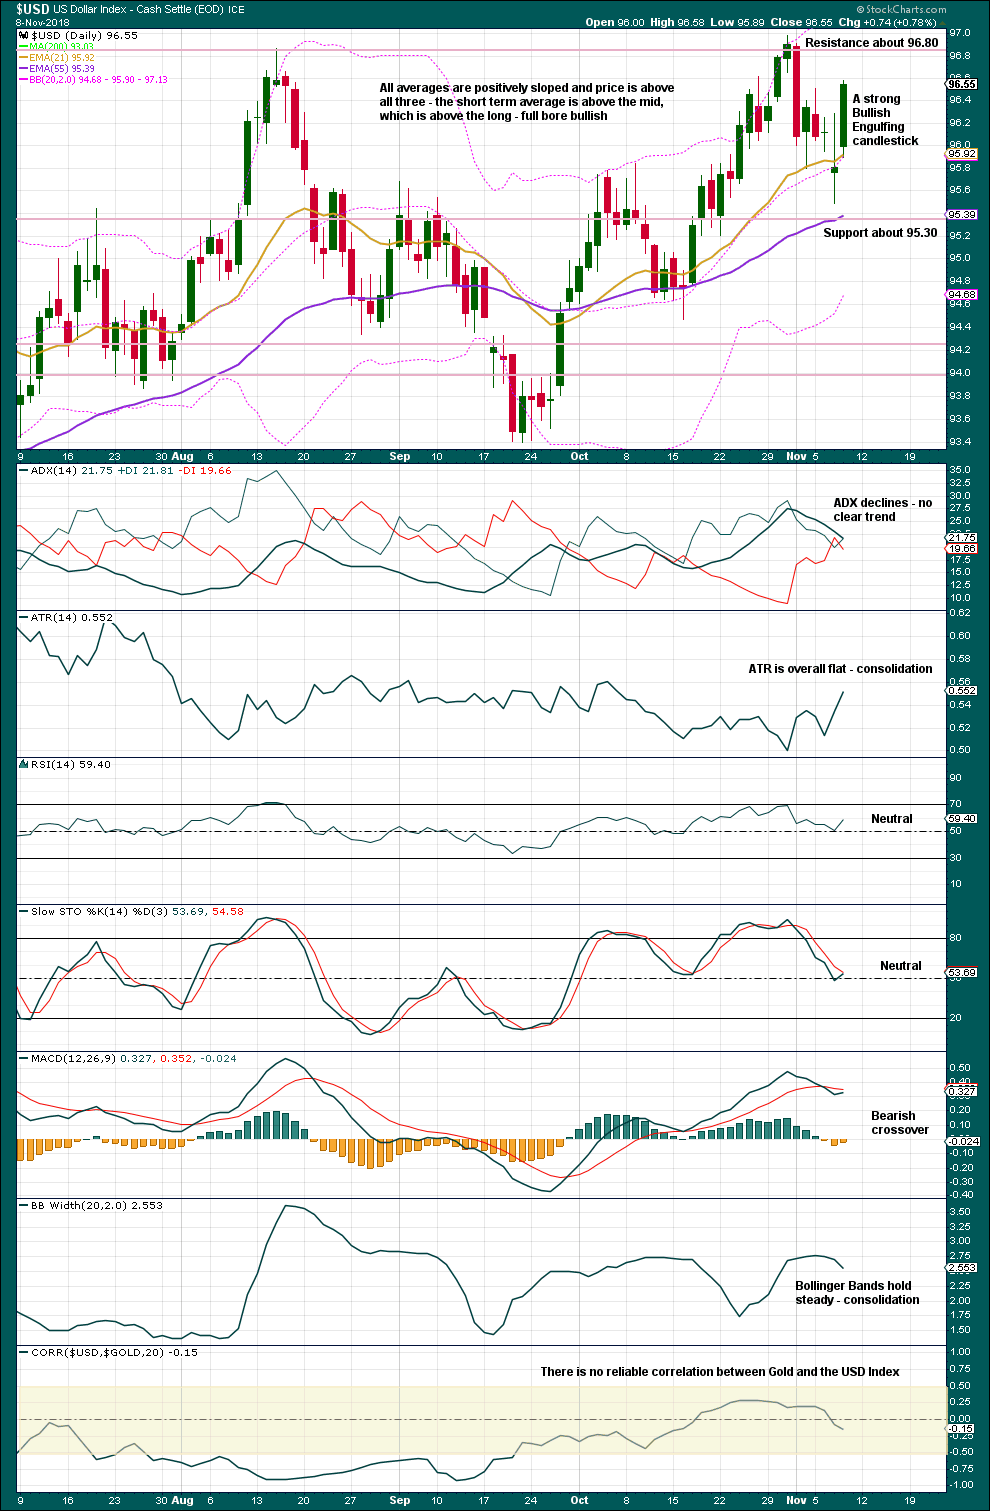
Click chart to enlarge. Chart courtesy of StockCharts.com.
There is a small consolidation with support about 95.30 and resistance about 96.80. A break above resistance would be an upwards breakout. For confidence look for any upwards breakout to have support from volume.
The strong Bullish Engulfing Candlestick pattern also completes a Morning Doji Star. This is very bullish and supports the main Elliott wave count.
Unfortunately, StockCharts do not provide volume data for currencies; no volume analysis is made for the USD Index. This does reduce the accuracy and depth of this analysis.
A note about the correlation co-efficient: Any two sets of data which have a correlation co-efficient that spends time in the shaded area between +0.5 to -0.5 are considered to not have a reliable correlation. Currently, the correlation co-efficient between Gold and the USD Index is very weakly negative at -0.15. This weak negative correlation may be only due to chance and not because there exists a relationship between the two sets of data.
Published @ 03:00 a.m. EST.
HI Lara
Thanks for your website.
I am wondering about your bearish and bullish.
May i recommend one more indicator.
that is ichimoku cloud. so that it is bullish if above the cloud??
regards
hak wan
Well, this is horribly embarrassing. When I did this analysis I did not notice that Motive Wave had not updated the data, my connection to BarChart must have been interrupted. And so it does not have the latest daily candlesticks.
I will update this analysis early next week.
And yes, for the alternate wave count it is possible that intermediate (2) could have been short and brief. Possible, but that would not be typical behaviour for an intermediate degree second wave so unlikely.
Hi Lara,
Looking at USD composition, it is 58% Euro and the look of the long term chart of the Euro is bearish… Would you take this in consideration?
If so, I would think that I would support more the alternative Elliott wave count… Also is it possible that the intermediate wave (2) would be short and may be already over for the alternative wave count and USD would go up from here?
thanks
Mathieu
This seems to still be a very unpopular approach, but I approach my analysis of each market independently.
There is almost always a strong negative correlation between EURUSD and the USD Index. But not always. It can occasionally break down to very weak, too weak to be considered not due to chance. And so, I should approach analysis of each independently.
While EURUSD is indeed in a bear market currently and has been overall since its high in July 2008, that does not mean the bear market must continue.
I would not want to base my analysis of the USD Index based upon an assumption that EURUSD will remain in a bear market. So again, I should approach analysis of each of these markets independently.
Anyway, if you think that my alternate wave count for USD Index is more likely because your own analysis offers it more support, then you should proceed with relying upon that wave count more than the other.
Thanks Lara…. I understand what you are doing since you are a pure Elliott Wave analyzer with the help of Classic analysis… You want an unbiased view as much as possible in the security in question…. I totally respect that.
I analyzed things differently than you and that’s why I value your opinion so much.
All the best,
Mathieu
Hi Lara, thanks for your USD analysis because I think it will be the key to all the markets before and hopefully after it will top below 103,7☝️☝️☝️ As for correlation with other assets it should increase more and more as USD is heading to its high and after that for a while…..So, we will see, but even oil’s decline seems to be influenced by USD as it goes up as anti-risk( especially against EEM currencies and markets) and is driven by hawkish Fed….pls, provide your thoughts if we are in 3rd wave in USD because we closed Friday at 96,9…thanks !
“As for correlation with other assets it should increase more and more”
Why should it? Is there some data you can point to that supports this claim?
“even oil’s decline seems to be influenced by USD” – what is the correlation co-efficient between USD and Oil? Are they actually correlated? I would rather use the math to determine if one market is influencing another, than just say that it “seems” to.
I think your comment is relying upon fundamental analysis. Which is mutually exclusive to Elliott wave.
I’m a technical analyst. I do not use fundamental analysis.
If you look back at the late 2015-early 2016 you will see that everything ( gold, oil, stocks, commodities) was going down against USD going up until the climax around 100-101 and Fed finally going against USD and after that everything turned back up recovering while USD went down … BTW, it was the second wave correction for SP…. write now we are experiencing wave 4 correction…. let’s see if it repeats…. of course, correlation is not perfect but as we are closer to climax and USD top the more all the markets will react to anti-risk( or USD) at the very top correlation drops…. you know, Elliot waves are great tool, but you use classic technical tools too and we live in real world and understanding its context helps a lot to see bigger picture🤷🏼♂️☝️ Looking at the charts the situation is going to some climax especially with USD… if it tops somewhere below 103,7 and goes down a long way to 80-85 or probably lower then we will be having big final rally everywhere ( stocks, commodities, gold)…. but if it goes up up as in your alternative I can not imagine SP ever to go up in wave 5 anymore..it seems we will be having worldwide markets collapse against the USD…. no EM market can survive that kind of rise in the USD anymore….so, we will see and this markets behavior in oil, gold( not going up even to 1250☝️☝️☝️), oil stocks, EEM, SP…. they are not perfectly correlated surely but in climax they should all react to USD going up to the top as it was in 2015-2016☝️ My bet is we will be having a kind of panic by the end of wave 4 in SP and across all assets against USD until Fed capitulates with interest rates rise and turns USD down and all other markets up…. Maybe, I am wrong but situation is very similar to end of 2015-2016 when Fed stood against rising USD….just general context and observation…🤷🏼♂️🤷🏼♂️🤷🏼♂️Sorry about that…I am not short-term trader and I am interested in longer waves which can give much greater opportunities, less risk and bigger more powerful trends…. I hope the moment will come when USD tops and knocks everything much lower and surely all the right EW invalidation levels should hold in oil, gold, SP and other markets☝️☝️☝️ If not, welcome to the new big bear in everything and big bull in the USD😩😩😩 so, thanks for USD update it helps to understand where it is going, the levels, channels…👍👌