
Last Elliott wave analysis of this pair (August 2018) expected some upwards movement but price has mostly moved sideways.
Summary: Upwards movement for another two or so months to 1.2046 – 1.20761 is expected.
Changes to this analysis are in bold.
ELLIOTT WAVE ANALYSIS
MONTHLY CHART
Click chart to enlarge.
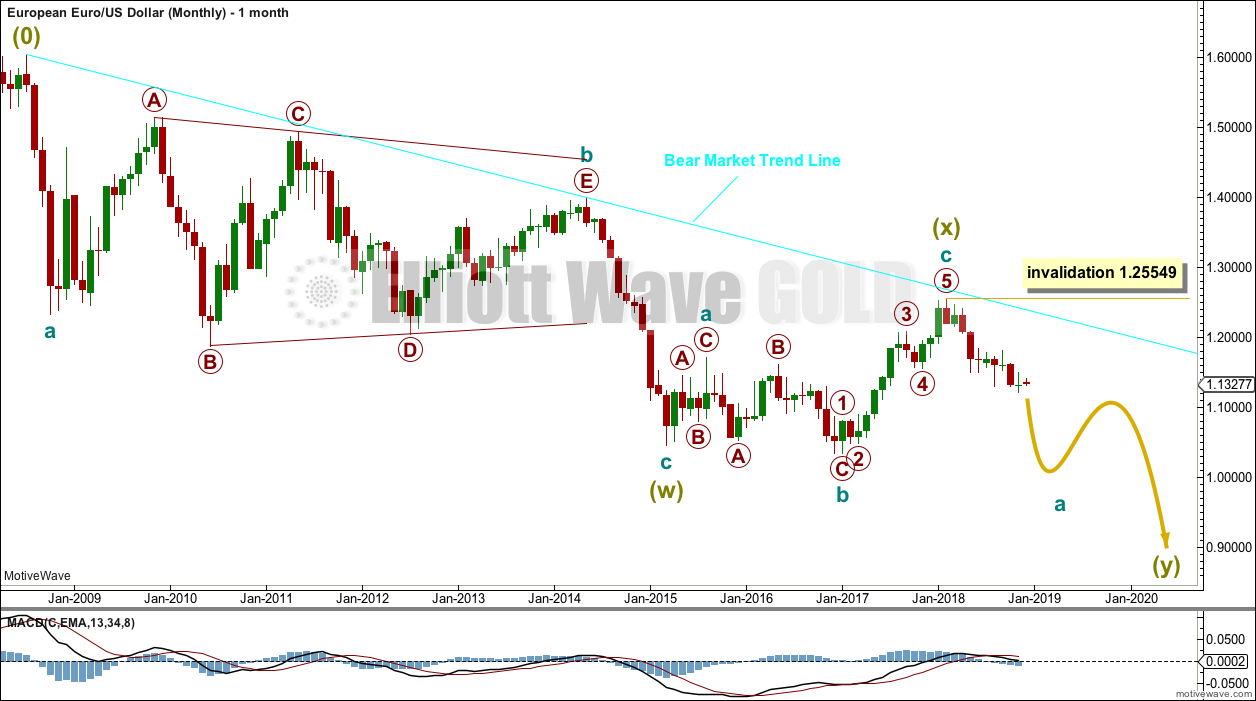
The (0) is from where the wave count begins.
A large zigzag can be seen complete at the low in March 2015. This is labelled Super Cycle wave (w).
A low now below this point indicates that the larger structure downwards is incomplete. The Elliott wave structure that fits best here is a double zigzag.
The first zigzag in the double is complete; it is labelled Super Cycle wave (w). The double is now joined by a complete three in the opposite direction, an expanded flat labelled Super Cycle wave (x). Because Super Cycle wave (x) ends just short of the cyan bear market trend line, it looks like it is over there.
Super Cycle wave (y) is most likely now to unfold as a zigzag.
While double zigzags and double combinations are labelled the same, W-X-Y, they are very different structures.
Double zigzags, like single zigzags, normally have a strong counter trend slope. To achieve this their X waves are usually brief and shallow. The second zigzag in the double usually moves reasonably beyond the end of the first zigzag, so that the whole structure has a strong slope.
Double combinations are sideways movements. To achieve a sideways look their X waves are usually deep and can also often be time consuming. The second structure in the double usually ends about the same level as the first, so that the whole structure takes up time and moves price sideways.
Here, Super Cycle wave (x) is relatively shallow. This indicates a double zigzag is most likely unfolding lower.
The bear market trend line may be expected to continue to provide resistance while the bear market for EURUSD remains intact.
The strongest piece of technical analysis on this chart is the cyan trend line. The fact that it was tested and recently held in February 2018 indicates this line has strength. Any strong bounces within the ongoing bear market may be expected to find strong resistance at this trend line.
WEEKLY CHART
Click chart to enlarge.
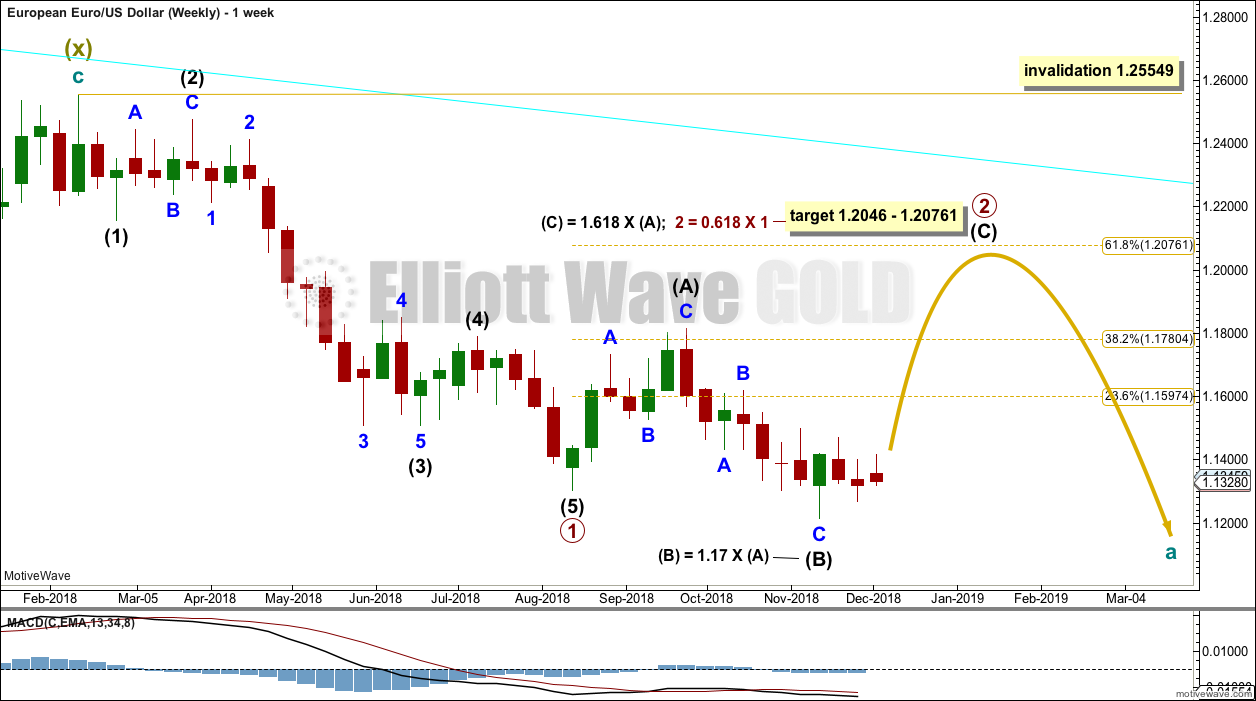
Primary wave 1 subdivides as an impulse.
Primary wave 2 may be unfolding as an expanded flat correction. Within primary wave 2, intermediate waves (A) and (B) both subdivide as zigzags. Intermediate wave (C) should subdivide as a five wave structure.
The most common Fibonacci ratio is used to calculate a target at intermediate degree for intermediate wave (C) to end. This is very close to the 0.618 Fibonacci ratio of primary wave 1.
If primary wave 2 moves above the target or is long lasting enough, it should find strong resistance at the cyan trend line that is copied over from the monthly chart.
DAILY CHART
Click chart to enlarge.
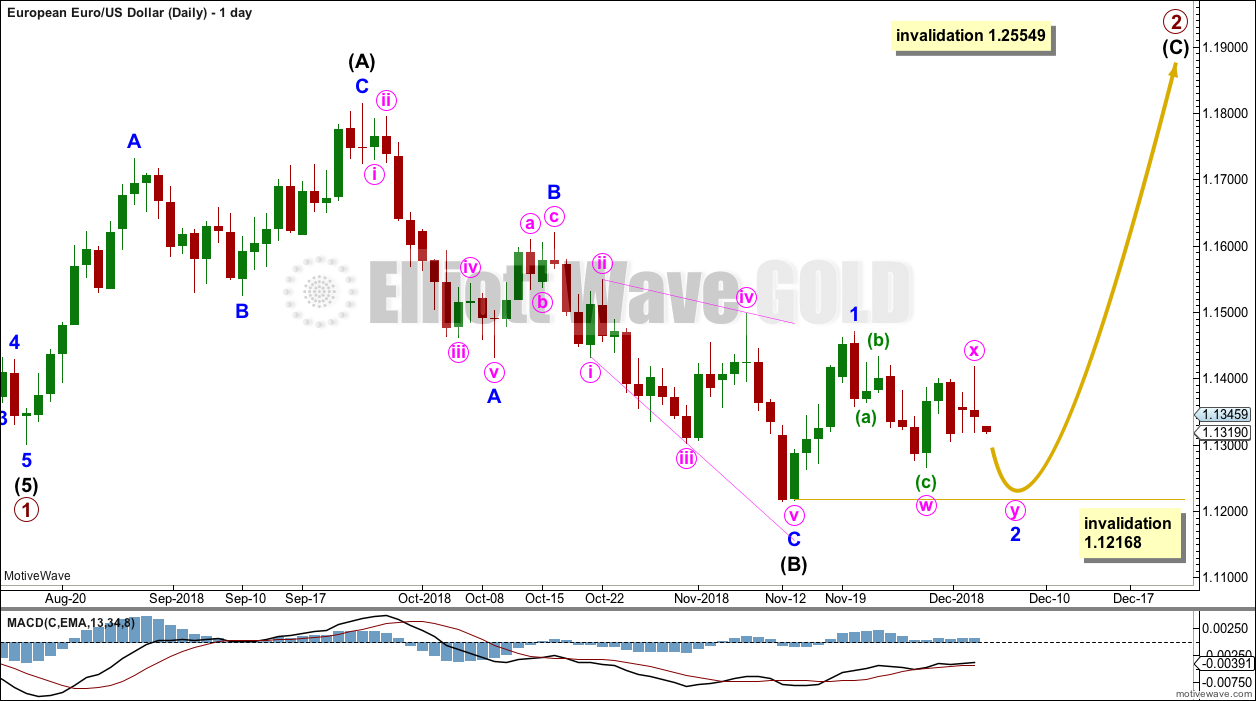
This daily chart focusses on the structure of primary wave 2.
Intermediate wave (C) must subdivide as a five wave structure. Within intermediate wave (C), minor wave 1 may be complete.
Minor wave 2 may be continuing a little lower as a double zigzag. Minor wave 2 may not move beyond the start of minor wave 1 below 1.12168.
TECHNICAL ANALYSIS
Click chart to enlarge.
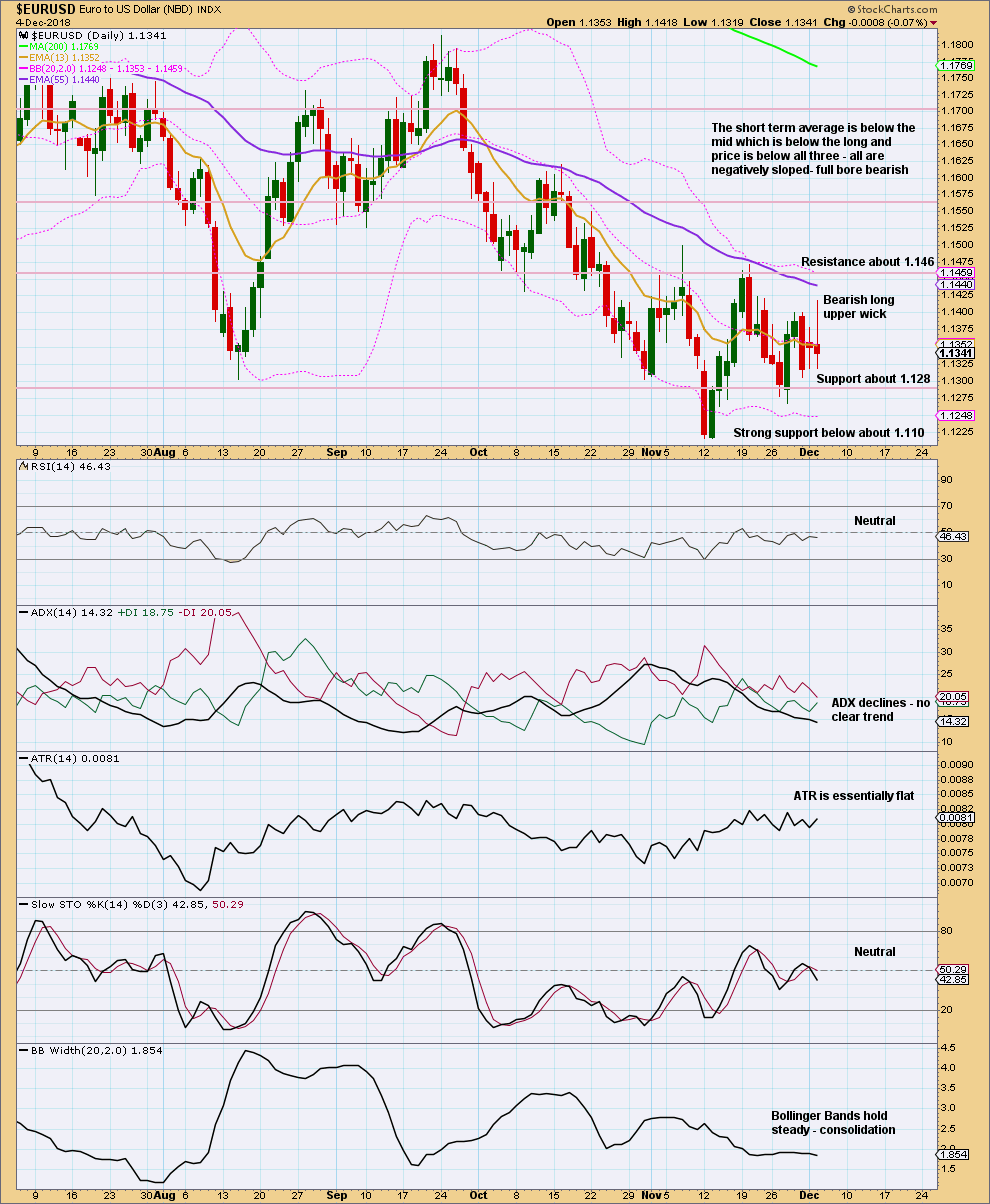
Price has made a series of lower lows and lower highs since the 24th of September, the definition of a downwards trend. However, ADX does not indicate a trend for the short term.
The trend has some weakness as indicated by flat ATR.
Currently, price is within a smaller consolidation with resistance about 1.146 and support about 1.128. It is an upwards day during this smaller consolidation that has strongest volume suggesting an upwards breakout may be more likely than downwards.
VOLUME ANALYSIS
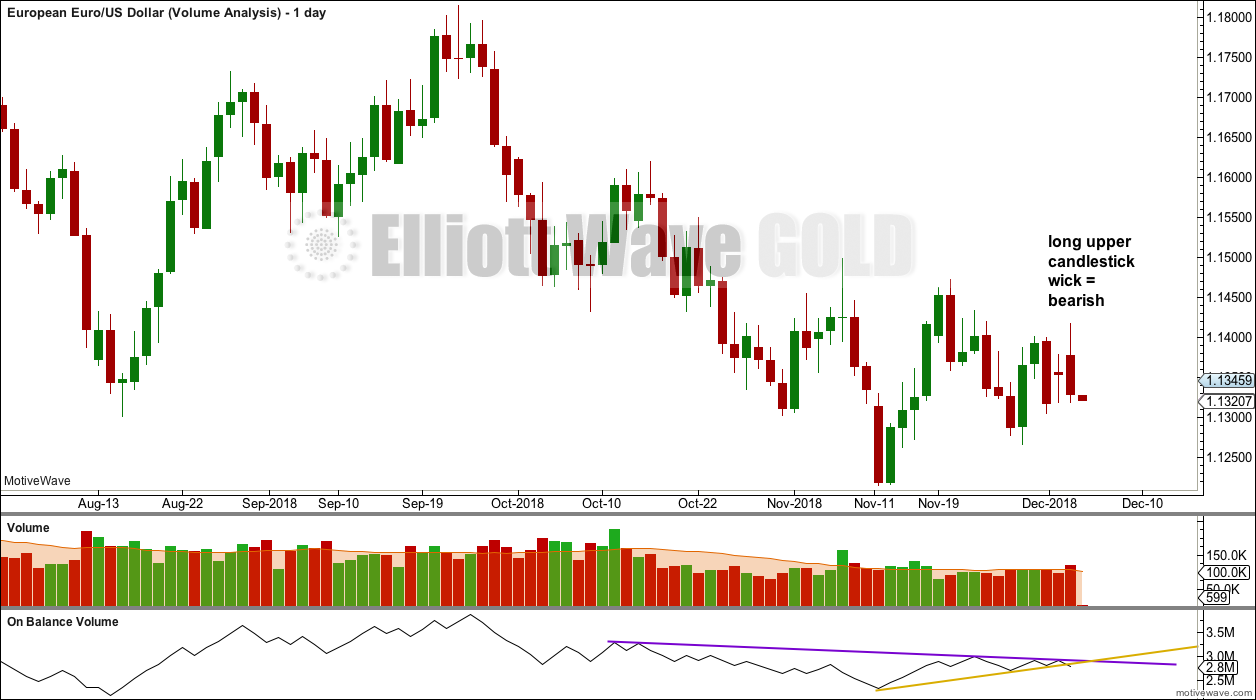
Click chart to enlarge.
For the short term, the volume profile is bearish. The long upper wick on the last complete daily candlestick is also bearish. On Balance Volume has breached a short held support line giving a weak bearish signal.
Expect at least a little more downwards movement here.
Published @ 02:52 a.m. EST.
—
Careful risk management protects your trading account(s).
Follow my two Golden Rules:
1. Always trade with stops.
2. Risk only 1-5% of equity on any one trade.
Hi Lara,
Thanks for update on euro… short-term it seems upward correction is coming, but after that your new wave count still do not correspond to your DXY main wave count which was strongly down🤷🏼♂️🤷🏼♂️🤷🏼♂️ Maybe, there are some alternatives for Euro moving upwards if DXY goes deeply lower to 80 or lower as you expect as your main scenario for DXY???
Thx
Alex