
Upwards movement has continued for Monday exactly as expected. The Elliott wave target remains the same.
Summary: The mid-term target is 1,295.
The final target for this bounce to end is about 1,305 – 1,310.
New updates to this analysis are in bold.
Grand SuperCycle analysis is here.
Last historic analysis with monthly charts is here.
There are four remaining weekly wave counts at this time for cycle wave b: a triangle, a flat, a combination, and a double zigzag.
At this time, the Triangle wave count may again be slightly more likely.
MAIN ELLIOTT WAVE COUNT
WEEKLY CHART – TRIANGLE
Click chart to enlarge.
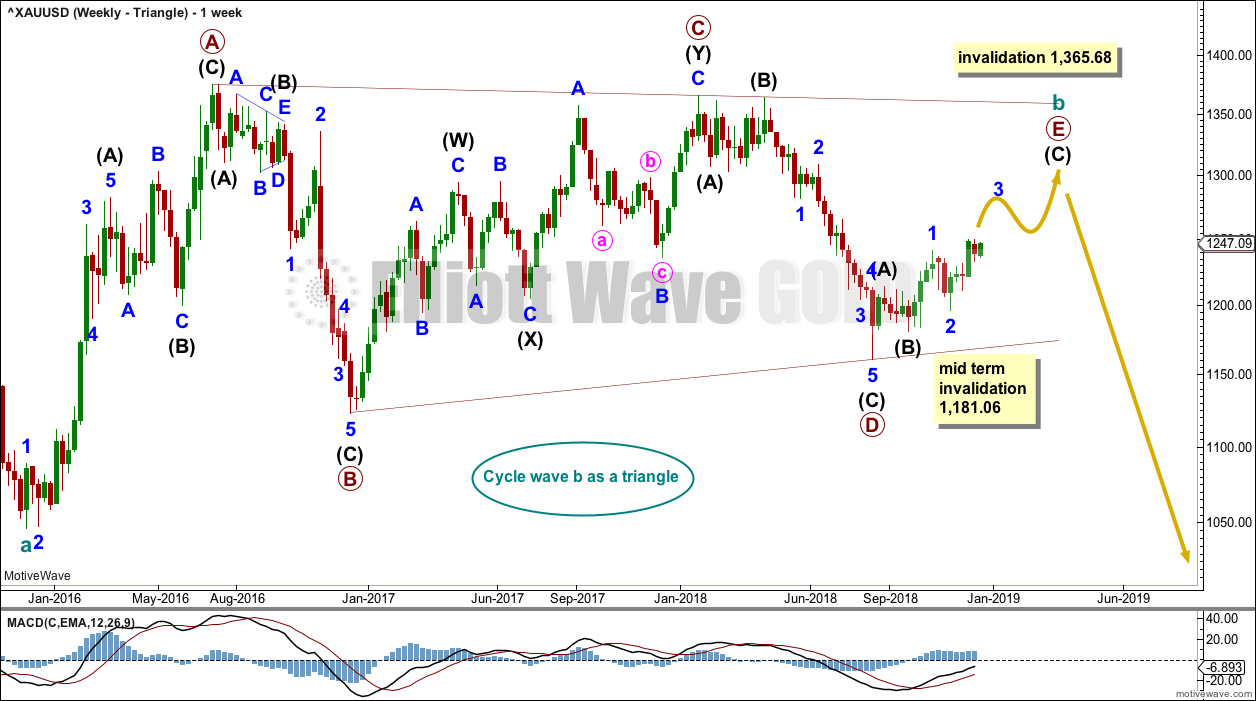
Cycle wave b may be an incomplete regular contracting triangle. Primary wave E may not move beyond the end of primary wave C above 1,365.68.
Within primary wave E, intermediate waves (A) and (B) may be complete. Intermediate wave (C) must subdivide as a five wave structure. Within intermediate wave (C), minor wave 2 may not move beyond the start of minor wave 1 below 1,181.06.
Four of the five sub-waves of a triangle must be zigzags, with only one sub-wave allowed to be a multiple zigzag. Wave C is the most common sub-wave to subdivide as a multiple, and this is how primary wave C for this example fits best. Primary wave E would most likely be a single zigzag. It is also possible that it may subdivide as a triangle to create a rare nine wave triangle.
There are no problems in terms of subdivisions or rare structures for this wave count. It has an excellent fit and so far a typical look.
When primary wave E is a complete three wave structure, then this wave count would expect a cycle degree trend change. Cycle wave c would most likely make new lows below the end of cycle wave a at 1,046.27 to avoid a truncation.
DAILY CHART – TRIANGLE
Click chart to enlarge.
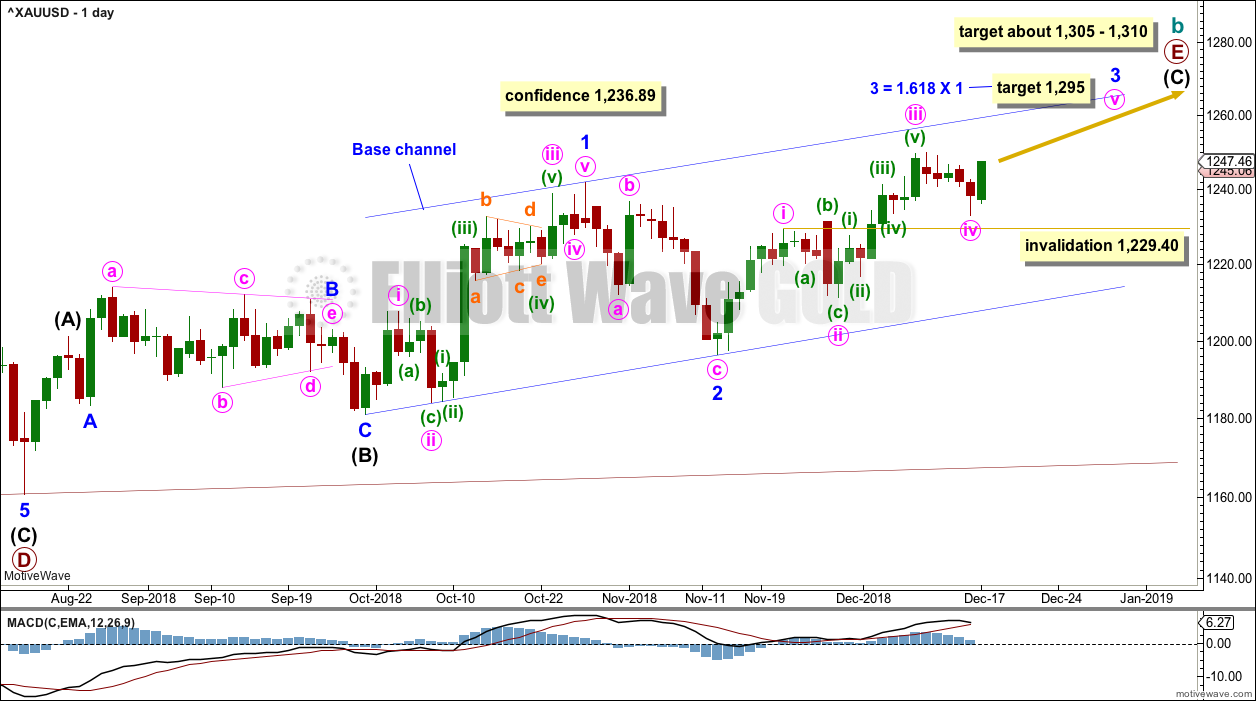
Primary wave E should now be underway for this wave count.
Primary wave E should subdivide as a zigzag. Intermediate waves (A) and (B) may now be complete. Intermediate wave (C) may be underway.
Minor wave 1 fits perfectly as a five wave impulse. Minor wave 2 is a deep zigzag.
Labelling within minor wave 3 today is changed. Minor wave 3 may be an almost complete impulse, now beginning the final fifth wave. The target is now calculated at two degrees and so has a higher probability.
Gold often exhibits swift strong fifth waves. This tendency is especially prevalent in fifth waves to end third wave impulses. Look out for a possible blow off top to end minute wave v of minor wave 3.
If it continues further, minute wave iv may not move into minute wave i price territory below 1,229.40.
A target for primary wave E is the strong zone of resistance about 1,305 to 1,310. Primary wave E is most likely to subdivide as a zigzag (although it may also subdivide as a triangle to create a rare nine wave triangle). It may last a total Fibonacci 21 or 34 weeks. So far it has lasted 13 weeks. Primary wave E may not move beyond the end of primary wave C above 1,365.68.
HOURLY CHART – TRIANGLE
Click chart to enlarge.
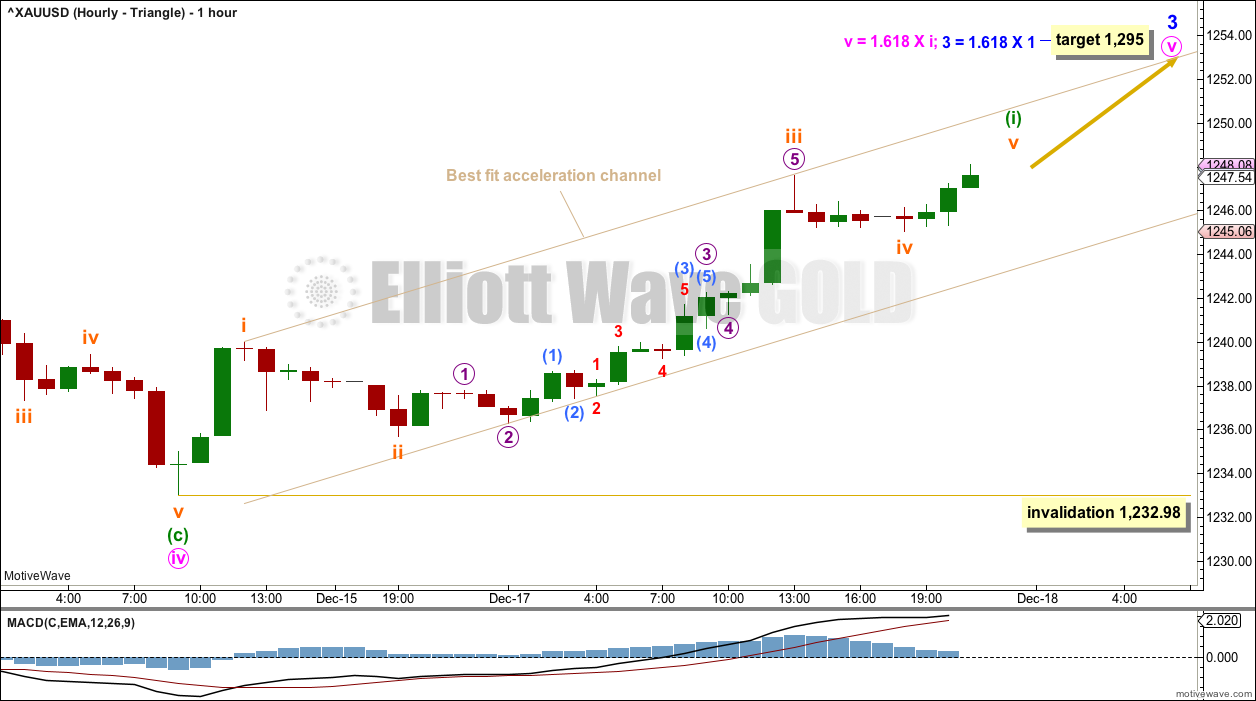
The hourly chart focusses on the start of minute wave v. Minute wave v must subdivide as a five wave structure, either an impulse or ending diagonal. An impulse is much more likely as these are more common structures.
So far minuette wave (i) may be incomplete. Use the channel as a guide to when minuette wave (i) is over. When the channel is breached by downwards movement, that may be an indication that minuette wave (i) is complete and minuette wave (ii) has then begun. When the channel is breached, then draw a Fibonacci retracement along the length of minuette wave (i) and use the 0.382 and 0.618 Fibonacci ratios as targets for minuette wave (ii) to end.
Minuette wave (ii) may not move beyond the start of minuette wave (i) below 1,232.98.
WEEKLY CHART – DOUBLE ZIGZAG
Click chart to enlarge.
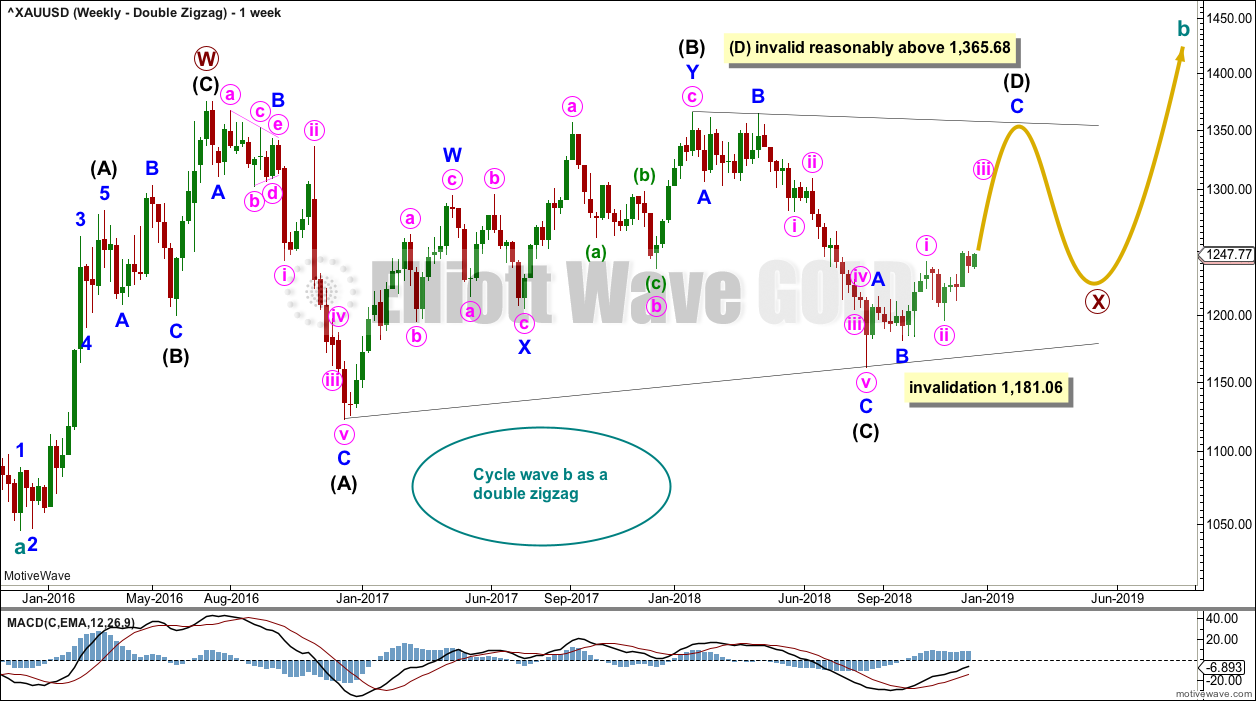
It is possible that cycle wave b may be a double zigzag or a double combination.
The first zigzag in the double is labelled primary wave W. This has a good fit.
The double may be joined by a corrective structure in the opposite direction, a triangle labelled primary wave X. The triangle would be about three quarters complete.
Within the triangle of primary wave X, intermediate wave (C) should be complete. Within intermediate wave (D), minor waves A and B may be complete. Minor wave C must subdivide as a five wave structure. Within minor wave C, minute wave ii may not move beyond the start of minute wave i below 1,181.06.
Intermediate wave (D) would most likely subdivide as a single zigzag.
This wave count may now expect choppy overlapping movement in an ever decreasing range for several more months.
Primary wave Y would most likely be a zigzag because primary wave X would be shallow; double zigzags normally have relatively shallow X waves.
Primary wave Y may also be a flat correction if cycle wave b is a double combination, but combinations normally have deep X waves. This would be less likely.
This wave count has good proportions and no problems in terms of subdivisions.
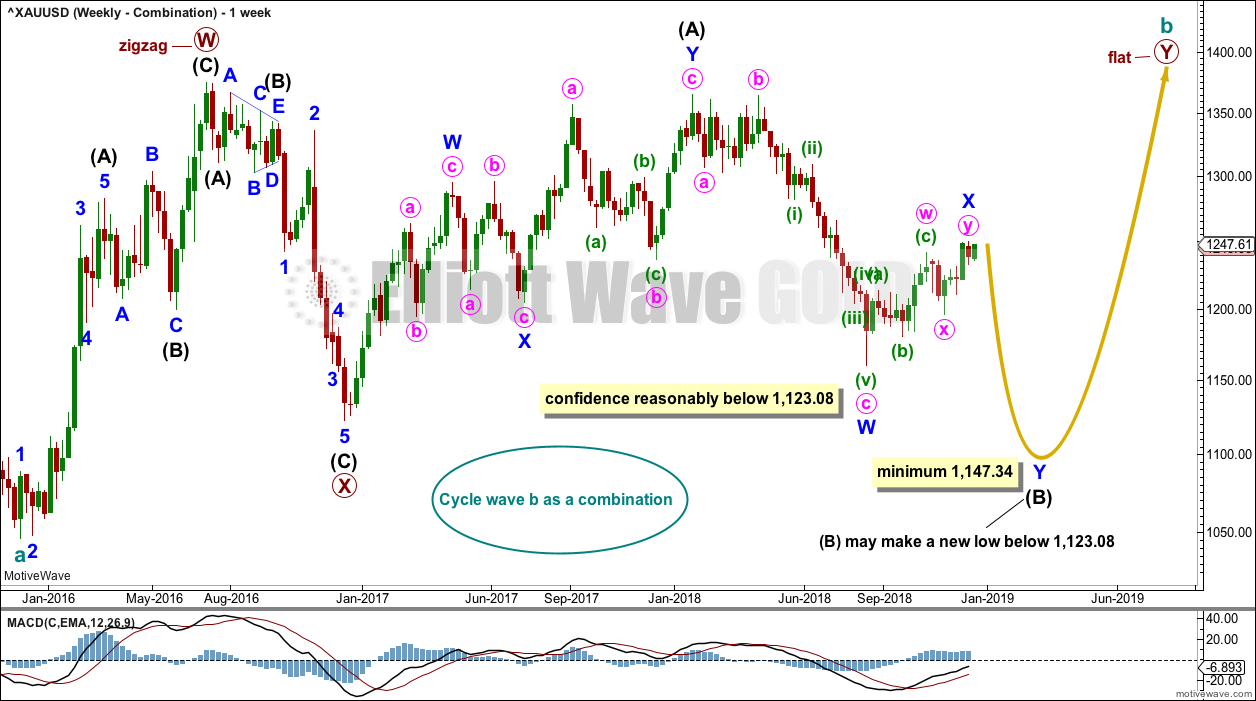
WEEKLY CHART – COMBINATION
Click chart to enlarge.
If cycle wave b is a combination, then the first structure in a double may be a complete zigzag labelled primary wave W.
The double may be joined by a three in the opposite direction, a zigzag labelled primary wave X.
The second structure in the double may be a flat correction labelled primary wave Y. My research on Gold so far has found that the most common two structures in a double combination are one zigzag and one flat correction. I have found only one instance where a triangle unfolded for wave Y. The most likely structure for wave Y would be a flat correction by a very wide margin, so that is what this wave count shall expect.
Within a flat correction for primary wave Y, the current downwards wave of intermediate wave (B) may be a double zigzag. Intermediate wave (B) must retrace a minimum 0.9 length of intermediate wave (A) at 1,147.34. Intermediate wave (B) may move beyond the start of intermediate wave (A) as in an expanded flat.
No upper invalidation point is given on this chart. Minor wave X may still continue higher. There is no Elliott wave rule stating a minimum nor maximum length for X waves within multiples.
Because the minimum requirement for intermediate wave (B) is not yet met, this wave count requires that intermediate wave (B) continues lower. This is the most immediately bearish of all four weekly wave counts.
When intermediate wave (B) is complete, then intermediate wave (C) would be expected to make at least a slight new high above the end of intermediate wave (A) at 1,365.68 to avoid a truncation. Primary wave Y would be most likely to end about the same level as primary wave W at 1,374.91, so that the whole structure takes up time and moves price sideways, as that is the purpose of double combinations.
While double combinations are very common, triples are extremely rare. I have found no examples of triple combinations for Gold at daily chart time frames or higher back to 1976. When the second structure in a double is complete, then it is extremely likely (almost certain) that the whole correction is over.
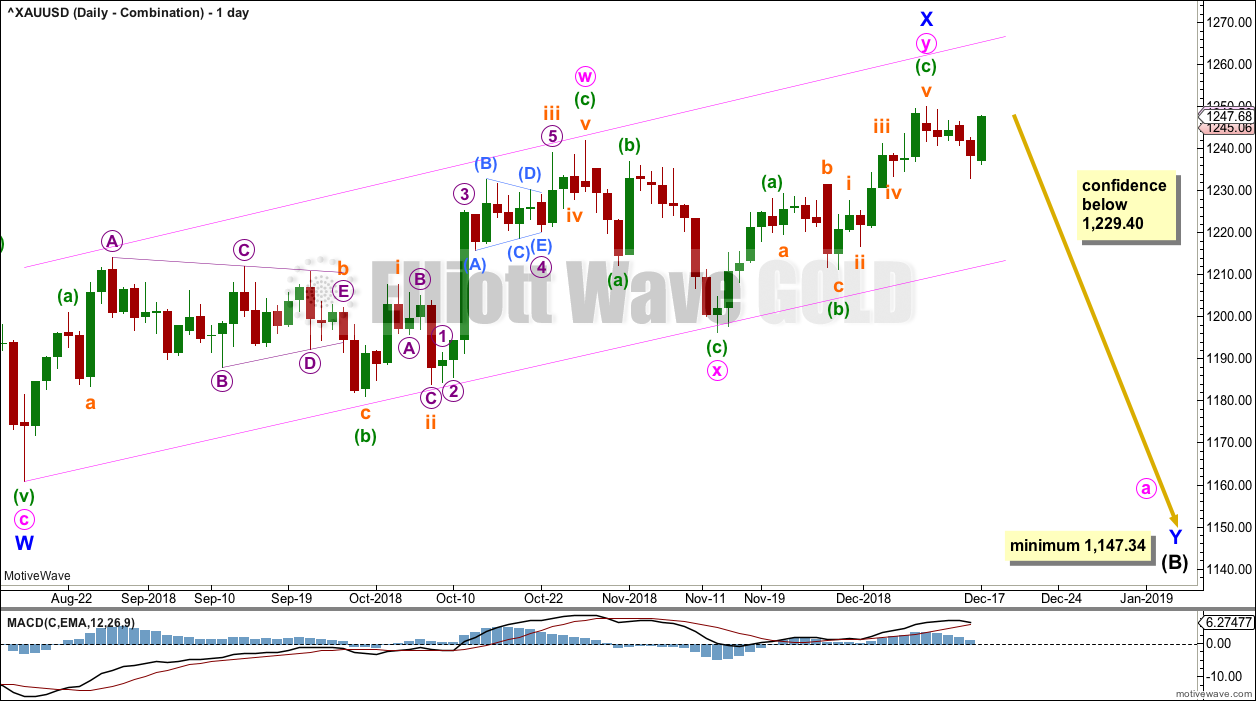
DAILY CHART – COMBINATION
Click chart to enlarge.
Minor wave X may be a complete double zigzag.
The maximum number of corrective structures within a multiple is three. This number refers to W, Y and Z. Each of W, Y and Z may only be simple corrective structures; they may not be multiples. However, the total of three does not include X waves, so X waves may be any corrective structure including multiples and the Elliott wave rule is not violated.
While X waves may be multiples, they very rarely are. The probability of this wave count is reduced.
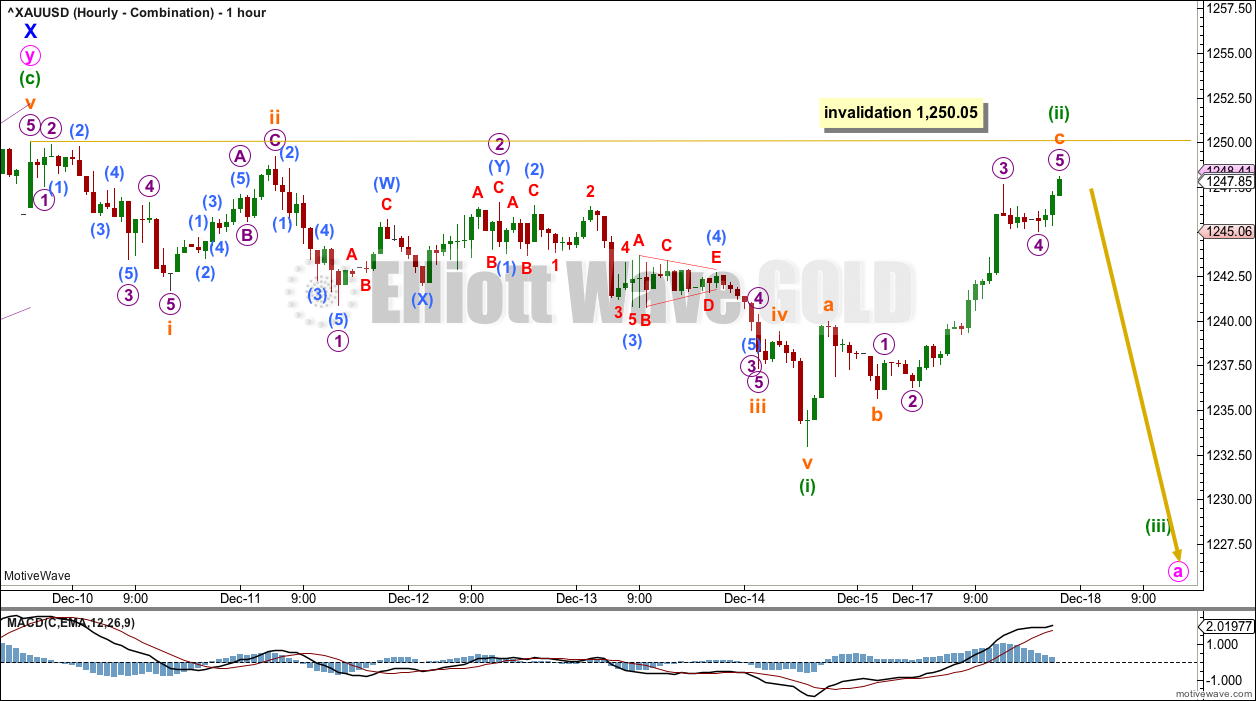
HOURLY CHART – COMBINATION
Click chart to enlarge.
This wave count now expects a downwards trend to 1,147.34 minimum.
Within the new trend of minor wave Y, minute wave a must subdivide as a five wave structure (most likely an impulse).
Within minute wave a, minuette wave (i) may be a complete impulse.
Minuette wave (ii) may not move beyond the start of minuette wave (i) above 1,250.05.
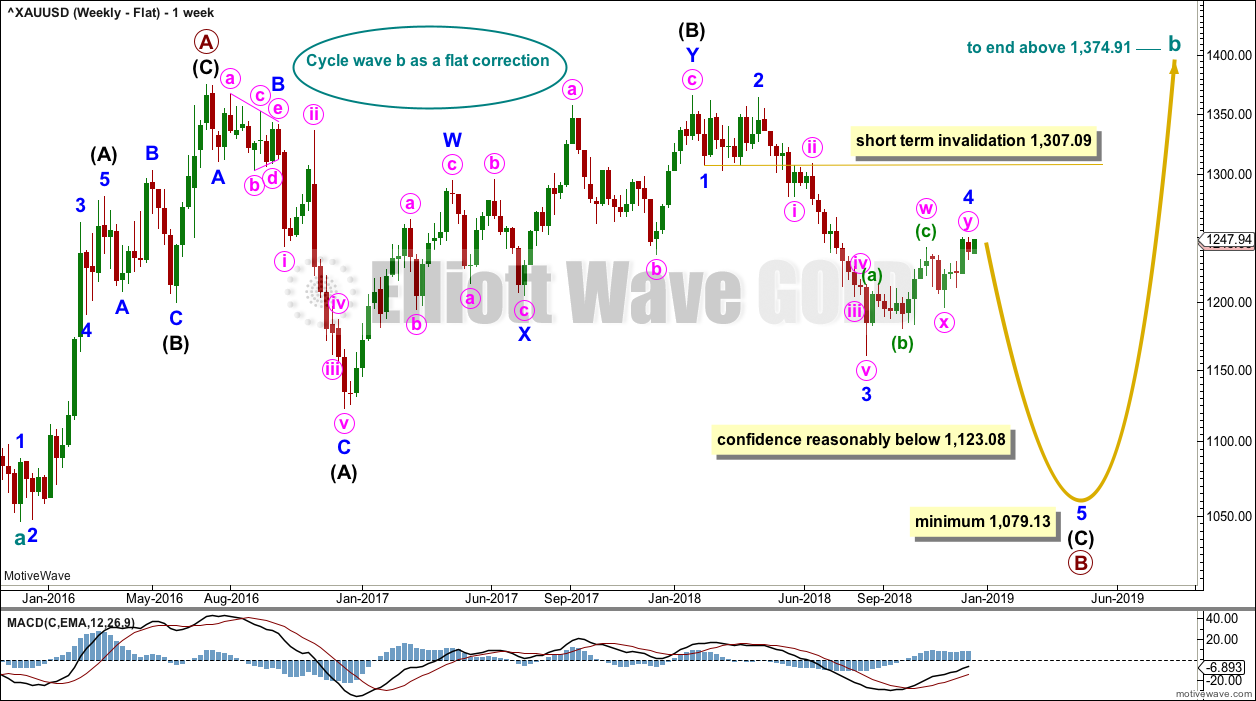
WEEKLY CHART – FLAT
Click chart to enlarge.
It is possible that cycle wave b may be a flat correction. Within a flat correction, primary wave B must retrace a minimum 0.9 length of primary wave A at 1,079.13 or below. Primary wave B may make a new low below the start of primary wave A at 1,046.27 as in an expanded flat correction.
Only a new low reasonably below 1,123.08 would provide reasonable confidence in this wave count.
Intermediate wave (C) must subdivide as a five wave structure; it may be unfolding as an impulse. Within intermediate wave (C), minor waves 1 through to 3 may be complete. Today minor wave 4 is relabelled as possibly incomplete as a double zigzag.
Minor wave 2 lasted 9 weeks. If minor wave 4 is now complete, then it has lasted 17 weeks. Minor wave 4 would be longer in duration than minor wave 2 by a reasonable margin. For Gold this is unusual, so the probability of this wave count is further reduced.
TECHNICAL ANALYSIS
WEEKLY CHART
Click chart to enlarge. Chart courtesy of StockCharts.com.
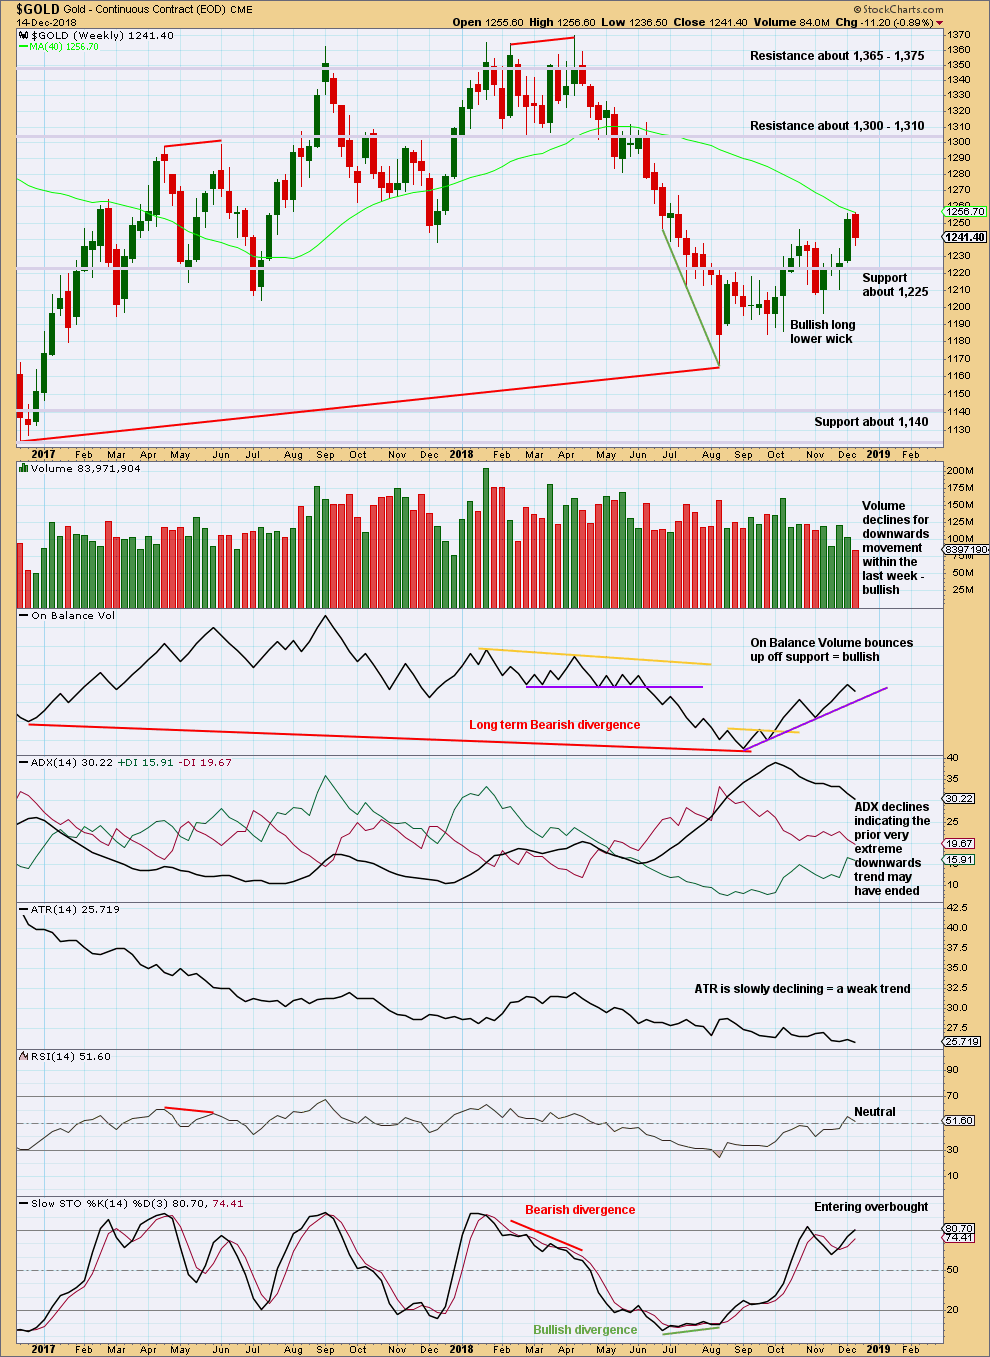
On Balance Volume has made a lower low than its prior low at the end of November 2015. This divergence is extremely bearish but does not rule out a consolidation unfolding here; the divergence does strongly support the Triangle wave count, which expects a consolidation or bounce up to test resistance now and then a continuation of a major bear market. It could also support the flat wave count that allows for a new low below 1,046.27 in coming months.
Last week completed an upwards week with a higher high and a higher low, but the candlestick is red and the balance of volume is downwards. Downwards movement within last week does not have support from volume.
DAILY CHART
Click chart to enlarge. Chart courtesy of StockCharts.com.
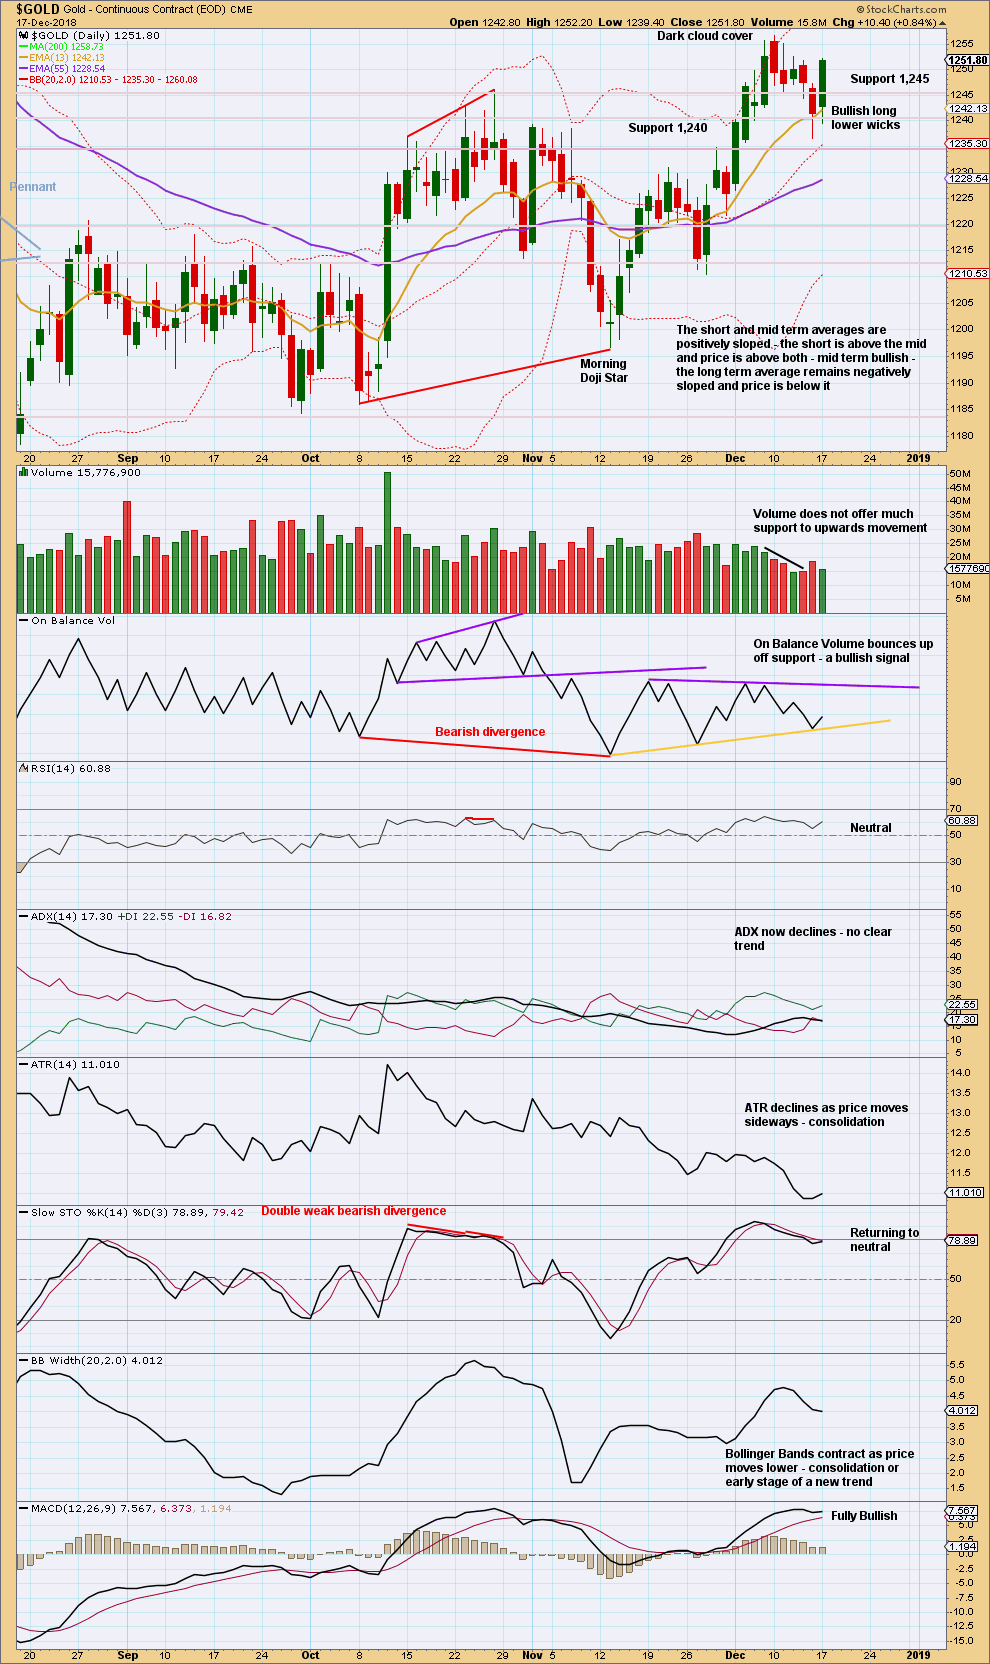
A bullish candlestick, with a bullish signal from On Balance Volume, support the idea a new high may be very close now.
The last small pullback looks very much like a pullback within an ongoing upwards trend.
GDX WEEKLY CHART
Click chart to enlarge. Chart courtesy of StockCharts.com.
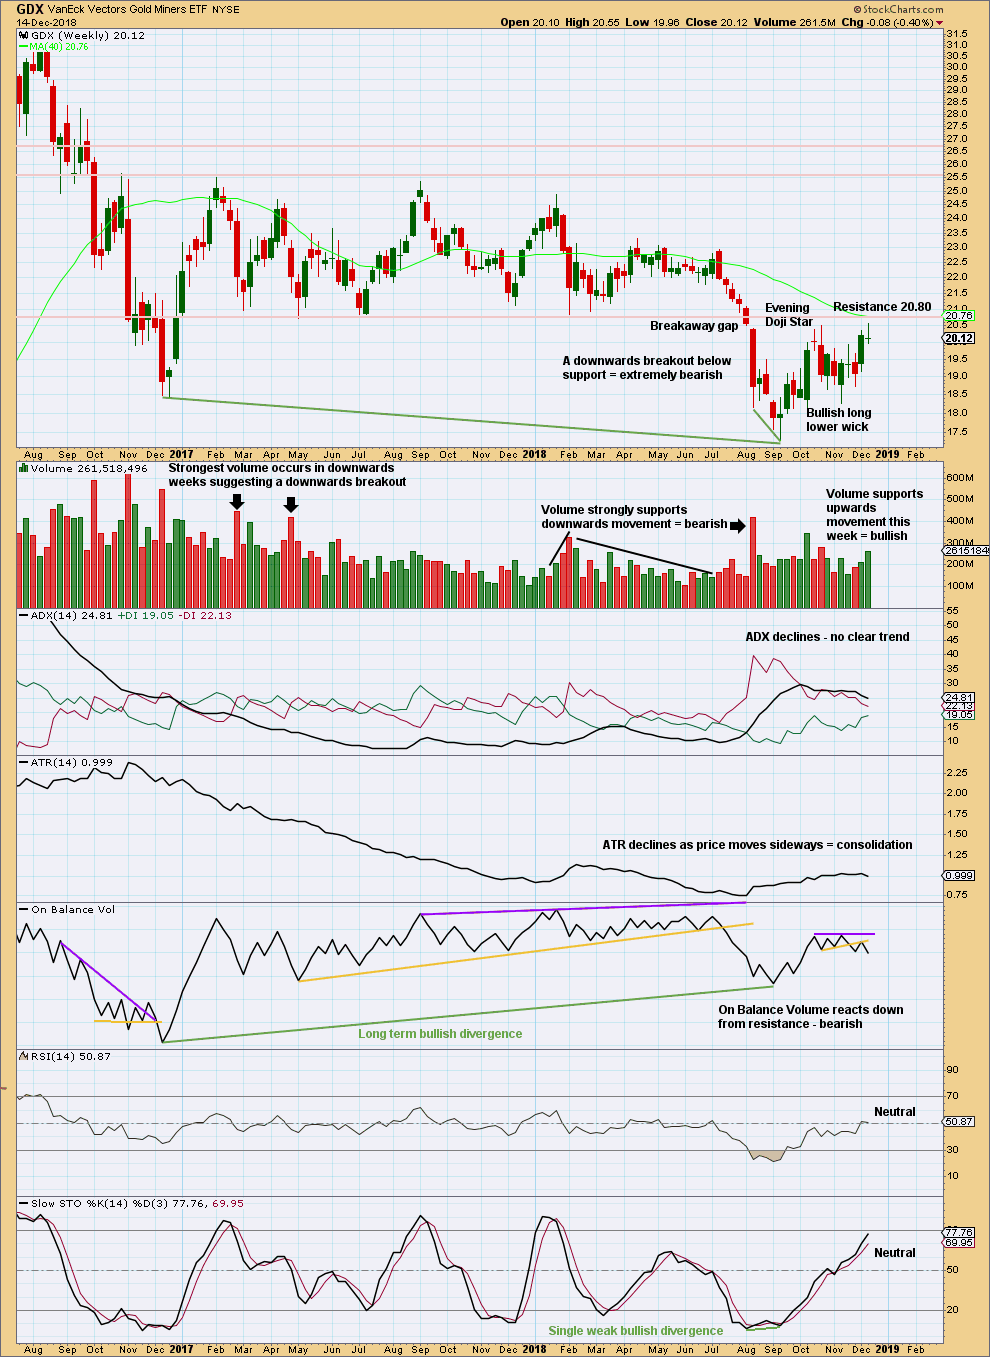
GDX had a large consolidation that lasted from January 2017 to August 2018. A downwards breakout below support at 20.80 in early August 2018 is highly significant. The breakout had support from volume, which adds confidence.
The breakaway gap has its low at 20.51. This gap is closed, but the target for the resulting movement following the long consolidation remains. The current bounce may still find strong resistance about 20.80.
The target is at 16.02.
GDX DAILY CHART
Click chart to enlarge. Chart courtesy of StockCharts.com.
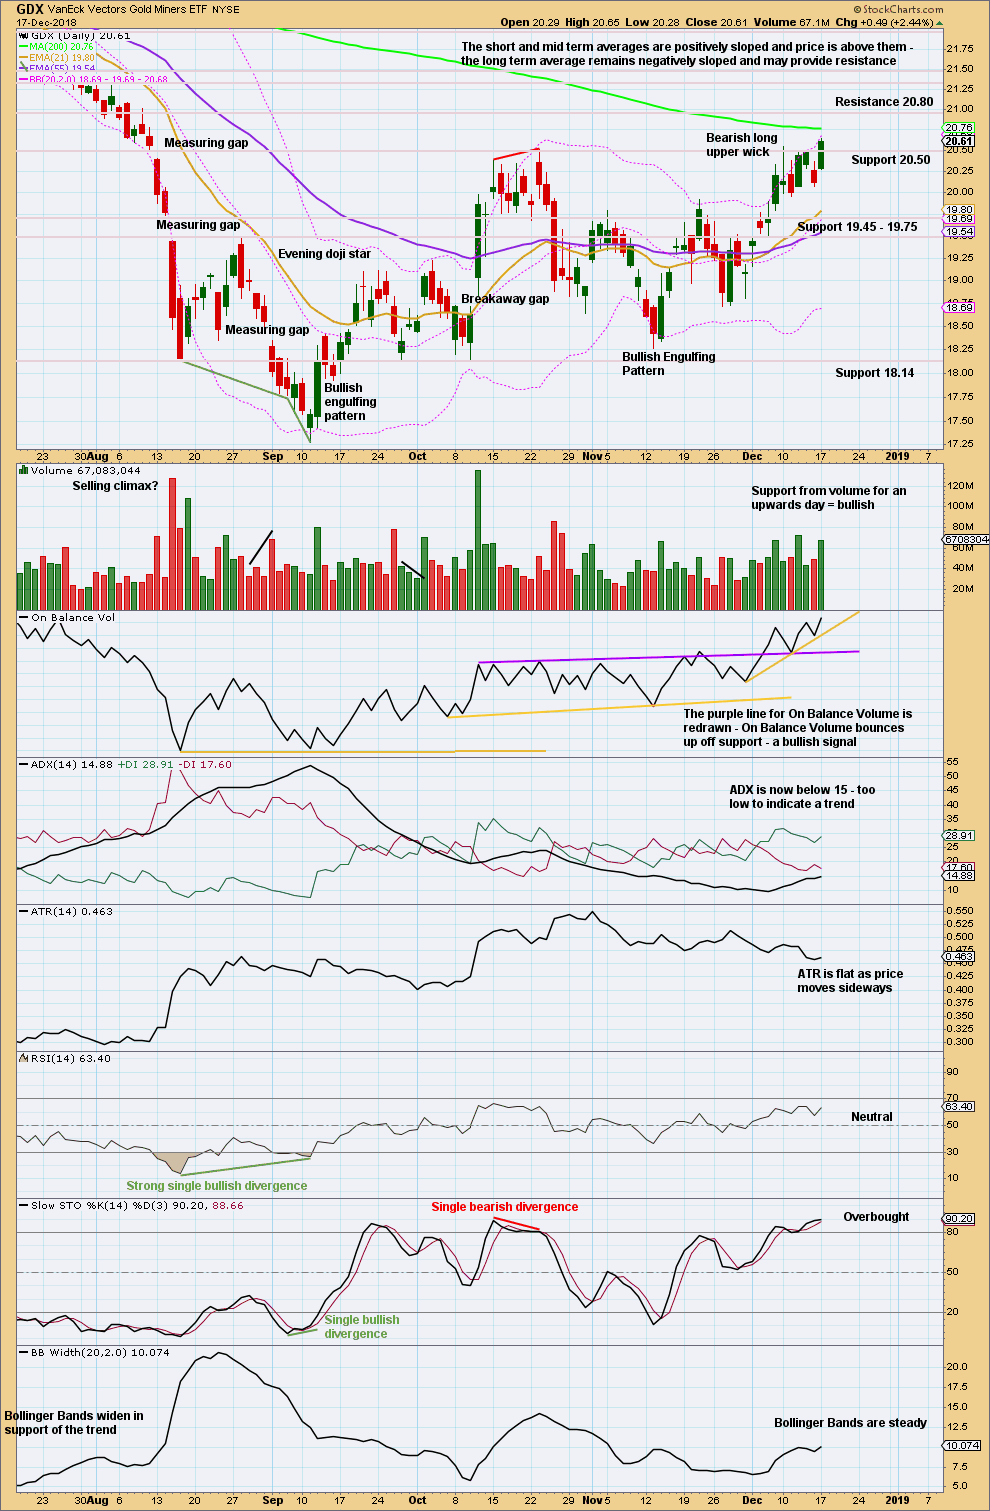
Strong resistance still remains above 20.80.
Published @ 10:35 p.m. EST.
—
Careful risk management protects your trading account(s).
Follow my two Golden Rules:
1. Always trade with stops.
2. Risk only 1-5% of equity on any one trade.
Hi, can we please have an oil update?
Done, on both Lara’s Weekly and the Oil post.
While price remains within the channel, assume it will continue higher.
Assume minuette (i) is incomplete.
Only when the channel is breached should we then look for the next pullback. The next one may last only a day or two.
Lara, I see in yesterdays comments that you sent an email regarding your upcoming holiday. Just an fyi, I didn’t receive it and as far as I know, I always get your emails. Thanks,
PS. Hope you enjoy some down time. Your analysis has been spot on lately!
Thanks Dreamer!
I’ll be taking a kind of holiday. I’ll still be here, and will still provide updated charts in comments sections. Or a new post if the main count changes.