
Upwards movement has continued as expected. The Elliott wave targets remain the same.
Summary: The upwards trend may resume. The mid-term target remains the same at 1,295.
For the very short term, another interruption to the upwards trend may occur about 1,250.
The final target for this bounce to end is about 1,305 – 1,310.
New updates to this analysis are in bold.
Grand SuperCycle analysis is here.
Last historic analysis with monthly charts is here.
There are four remaining weekly wave counts at this time for cycle wave b: a triangle, a flat, a combination, and a double zigzag.
At this time, the Triangle wave count may again be slightly more likely.
MAIN ELLIOTT WAVE COUNT
WEEKLY CHART – TRIANGLE
Click chart to enlarge.
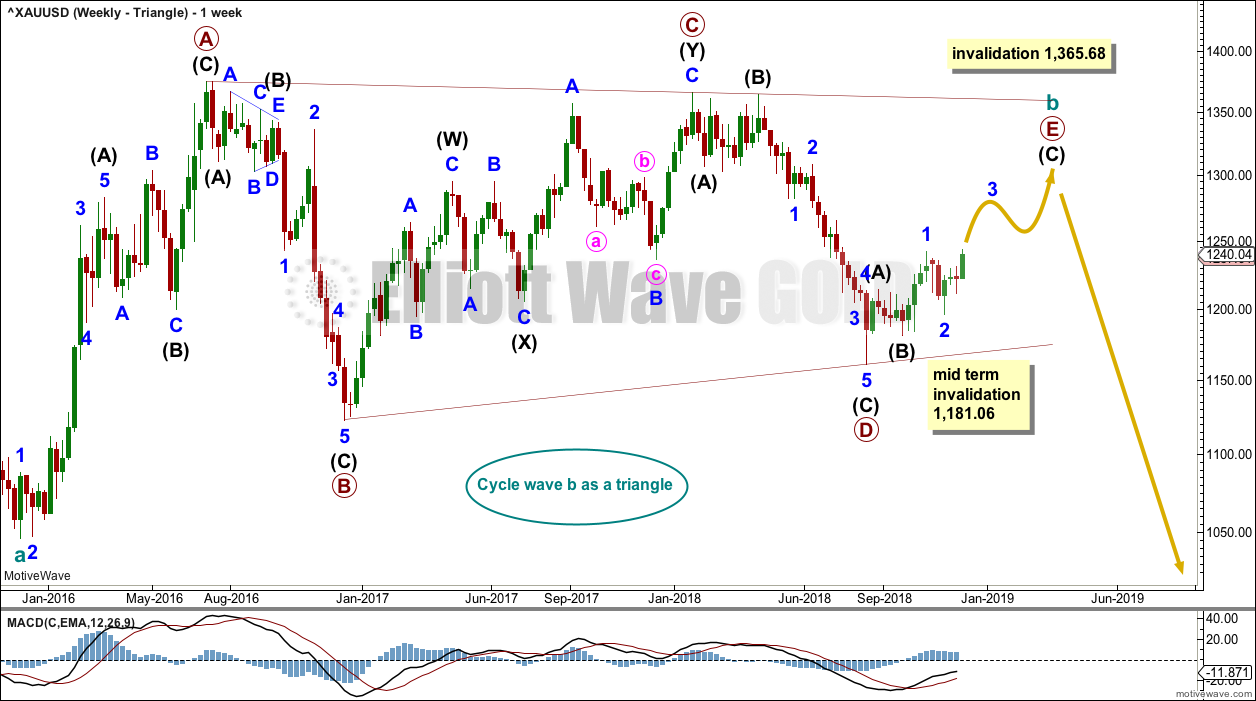
Cycle wave b may be an incomplete regular contracting triangle. Primary wave E may not move beyond the end of primary wave C above 1,365.68.
Within primary wave E, intermediate waves (A) and (B) may be complete. Intermediate wave (C) must subdivide as a five wave structure. Within intermediate wave (C), minor wave 2 may not move beyond the start of minor wave 1 below 1,181.06.
Four of the five sub-waves of a triangle must be zigzags, with only one sub-wave allowed to be a multiple zigzag. Wave C is the most common sub-wave to subdivide as a multiple, and this is how primary wave C for this example fits best. Primary wave E would most likely be a single zigzag. It is also possible that it may subdivide as a triangle to create a rare nine wave triangle.
There are no problems in terms of subdivisions or rare structures for this wave count. It has an excellent fit and so far a typical look.
When primary wave E is a complete three wave structure, then this wave count would expect a cycle degree trend change. Cycle wave c would most likely make new lows below the end of cycle wave a at 1,046.27 to avoid a truncation.
DAILY CHART – TRIANGLE
Click chart to enlarge.
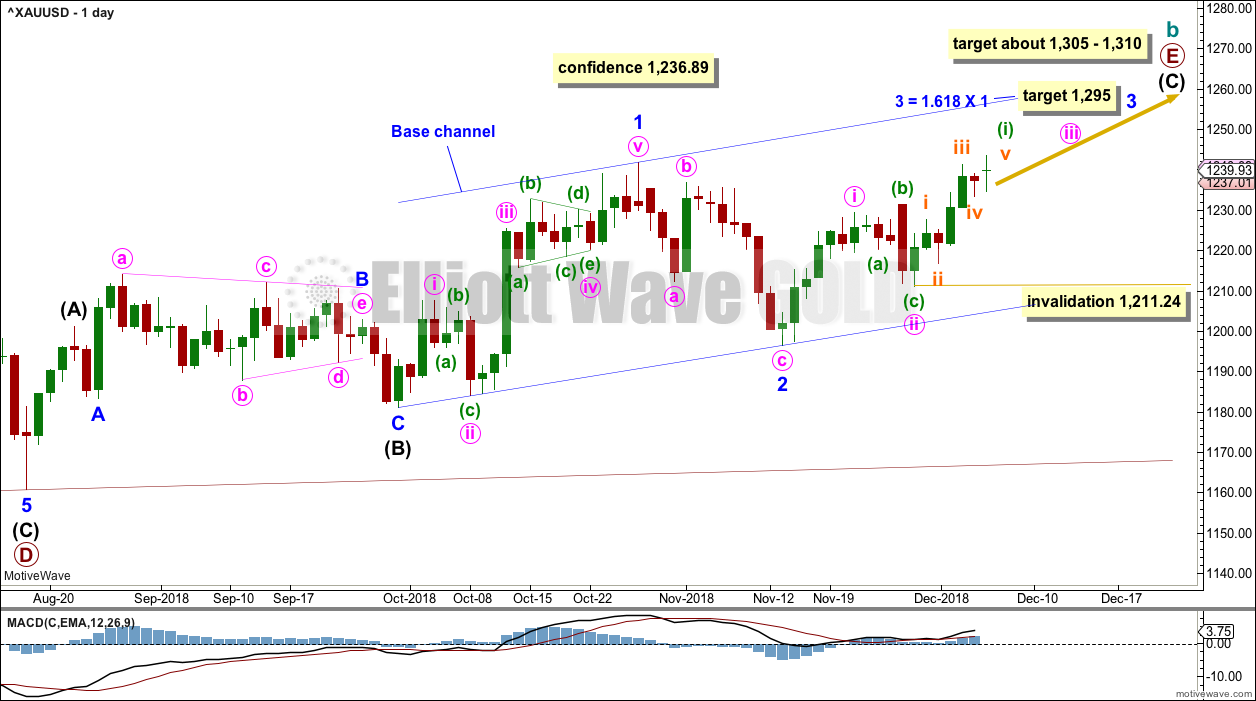
Primary wave E should now be underway for this wave count.
Primary wave E should subdivide as a zigzag. Intermediate waves (A) and (B) may now be complete. Intermediate wave (C) may be underway.
Minor wave 1 fits perfectly as a five wave impulse. Minor wave 2 should be complete as a deep zigzag. Minor wave 3 may now exhibit an increase in upwards momentum, and it should have support from volume. The target for minor wave 3 expects it to exhibit a common Fibonacci ratio to minor wave 1.
Minor wave 3 may only subdivide as an impulse. Within minor wave 3, minute waves i and ii may now be complete. Within minute wave iii, no second wave correction may move beyond the start of minute wave i below 1,211.24.
A target for primary wave E is the strong zone of resistance about 1,305 to 1,310. Primary wave E is most likely to subdivide as a zigzag (although it may also subdivide as a triangle to create a rare nine wave triangle). It may last a total Fibonacci 21 or 34 weeks. So far it has lasted 13 weeks. Primary wave E may not move beyond the end of primary wave C above 1,365.68.
HOURLY CHART – TRIANGLE
Click chart to enlarge.
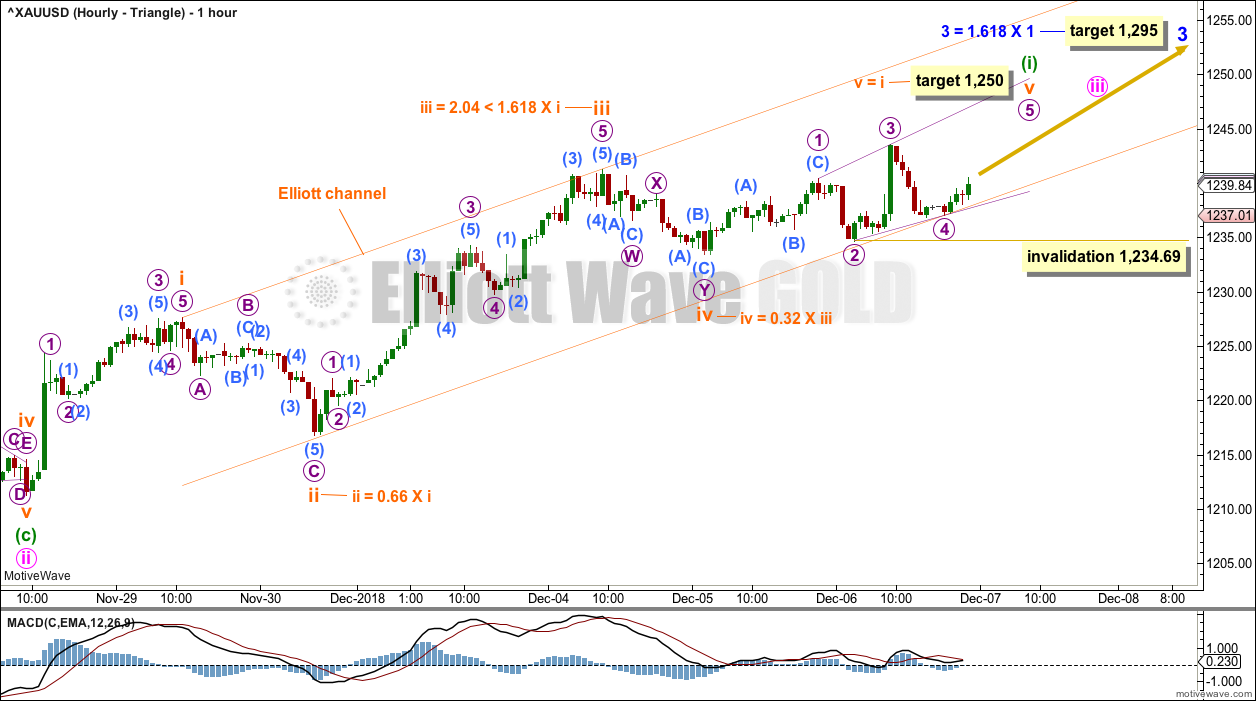
An impulse is nearly complete, which is labelled minuette wave (i).
Within this impulse, subminuette wave iii exhibits the most common Fibonacci ratio for a third wave to the first wave, and it is reasonably likely that subminuette wave v may exhibit the most common Fibonacci ratio for a fifth wave. Gold reasonably often exhibits textbook perfect impulses.
There is within this impulse almost perfect alternation between subminuette wave ii, which ended close to the 0.618 Fibonacci ratio as a single zigzag, and subminuette wave iv, which ended close to the 0.382 Fibonacci ratio as a double zigzag.
Subminuette wave v may be unfolding as an ending expanding diagonal. Within the diagonal, micro wave 4 may not move beyond the end of micro wave 2 below 1,234.69.
When minuette wave (i) is complete, then the invalidation point must move down to its start at 1,211.24. At that stage, minuette wave (ii) may be a small brief pullback and may not move beyond the start of minuette wave (i).
WEEKLY CHART – DOUBLE ZIGZAG
Click chart to enlarge.
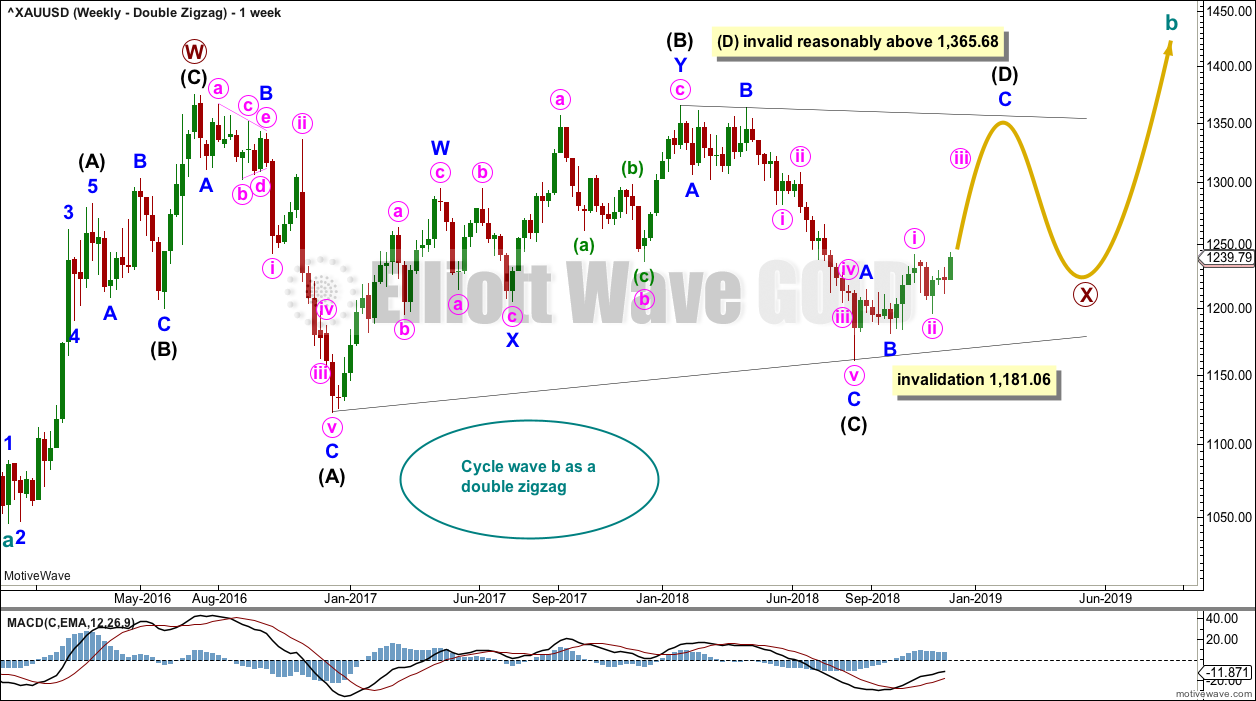
It is possible that cycle wave b may be a double zigzag or a double combination.
The first zigzag in the double is labelled primary wave W. This has a good fit.
The double may be joined by a corrective structure in the opposite direction, a triangle labelled primary wave X. The triangle would be about three quarters complete.
Within the triangle of primary wave X, intermediate wave (C) should be complete. Within intermediate wave (D), minor waves A and B may be complete. Minor wave C must subdivide as a five wave structure. Within minor wave C, minute wave ii may not move beyond the start of minute wave i below 1,181.06.
Intermediate wave (D) would most likely subdivide as a single zigzag.
This wave count may now expect choppy overlapping movement in an ever decreasing range for several more months.
Primary wave Y would most likely be a zigzag because primary wave X would be shallow; double zigzags normally have relatively shallow X waves.
Primary wave Y may also be a flat correction if cycle wave b is a double combination, but combinations normally have deep X waves. This would be less likely.
This wave count has good proportions and no problems in terms of subdivisions.
WEEKLY CHART – COMBINATION
Click chart to enlarge.
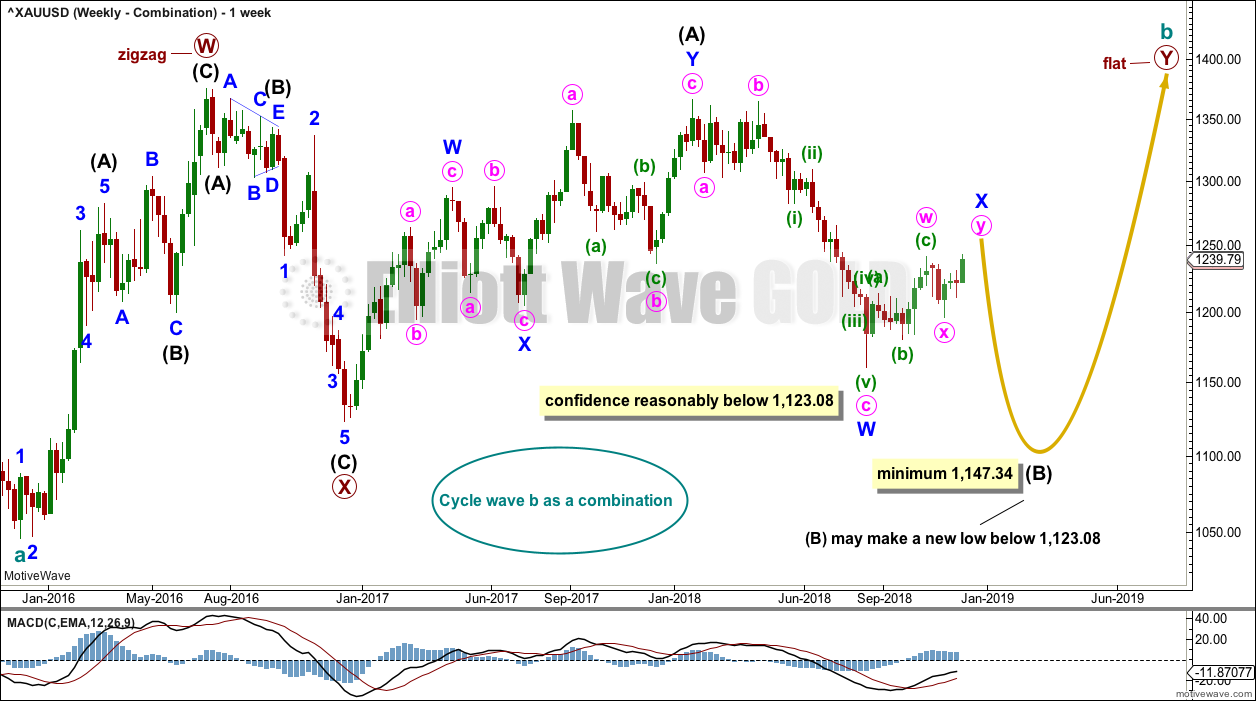
If cycle wave b is a combination, then the first structure in a double may be a complete zigzag labelled primary wave W.
The double may be joined by a three in the opposite direction, a zigzag labelled primary wave X.
The second structure in the double may be a flat correction labelled primary wave Y. My research on Gold so far has found that the most common two structures in a double combination are one zigzag and one flat correction. I have found only one instance where a triangle unfolded for wave Y. The most likely structure for wave Y would be a flat correction by a very wide margin, so that is what this wave count shall expect.
Within a flat correction for primary wave Y, the current downwards wave of intermediate wave (B) may be a double zigzag. Intermediate wave (B) must retrace a minimum 0.9 length of intermediate wave (A) at 1,147.34. Intermediate wave (B) may move beyond the start of intermediate wave (A) as in an expanded flat.
Because the minimum requirement for intermediate wave (B) is not yet met, this wave count requires that intermediate wave (B) continues lower. This is the most immediately bearish of all four weekly wave counts.
When intermediate wave (B) is complete, then intermediate wave (C) would be expected to make at least a slight new high above the end of intermediate wave (A) at 1,365.68 to avoid a truncation. Primary wave Y would be most likely to end about the same level as primary wave W at 1,374.91, so that the whole structure takes up time and moves price sideways, as that is the purpose of double combinations.
While double combinations are very common, triples are extremely rare. I have found no examples of triple combinations for Gold at daily chart time frames or higher back to 1976. When the second structure in a double is complete, then it is extremely likely (almost certain) that the whole correction is over.
DAILY CHART – COMBINATION
Click chart to enlarge.
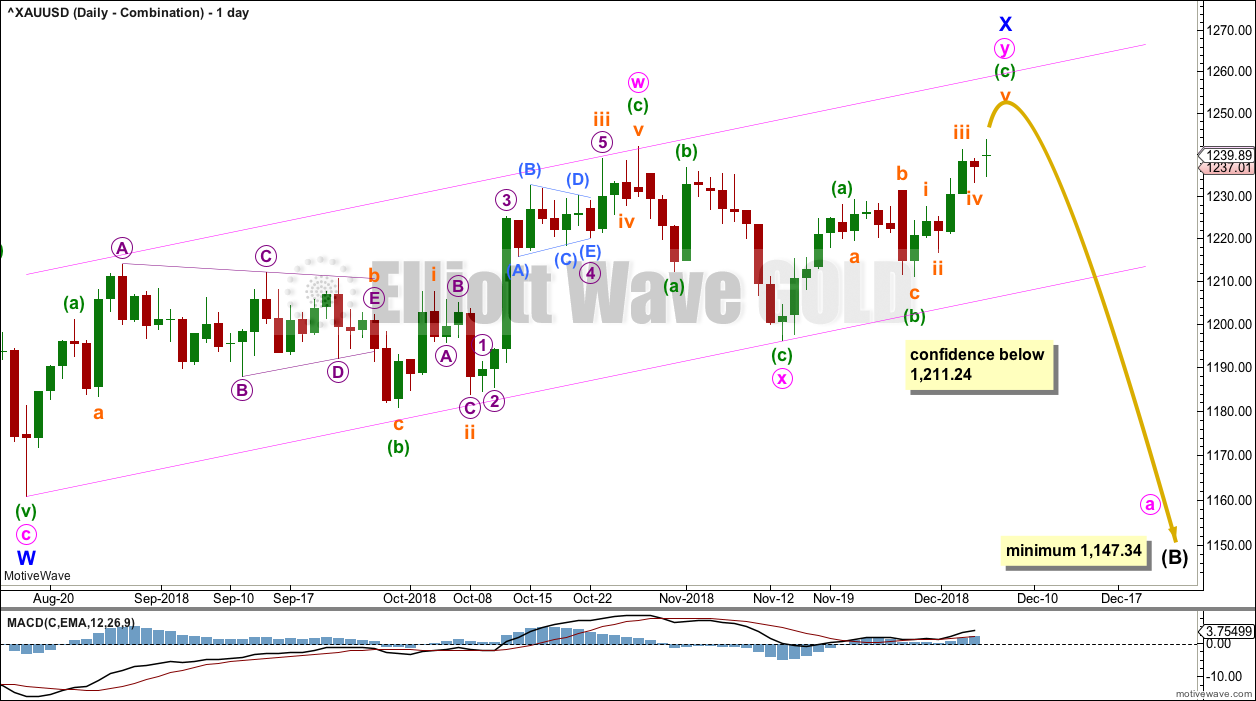
Minor wave X may be an incomplete double zigzag.
The maximum number of corrective structures within a multiple is three. This number refers to W, Y and Z. Each of W, Y and Z may only be simple corrective structures; they may not be multiples. However, the total of three does not include X waves, so X waves may be any corrective structure including multiples and the Elliott wave rule is not violated.
While X waves may be multiples, they very rarely are. The probability of this wave count is reduced.
HOURLY CHART – COMBINATION
Click chart to enlarge.
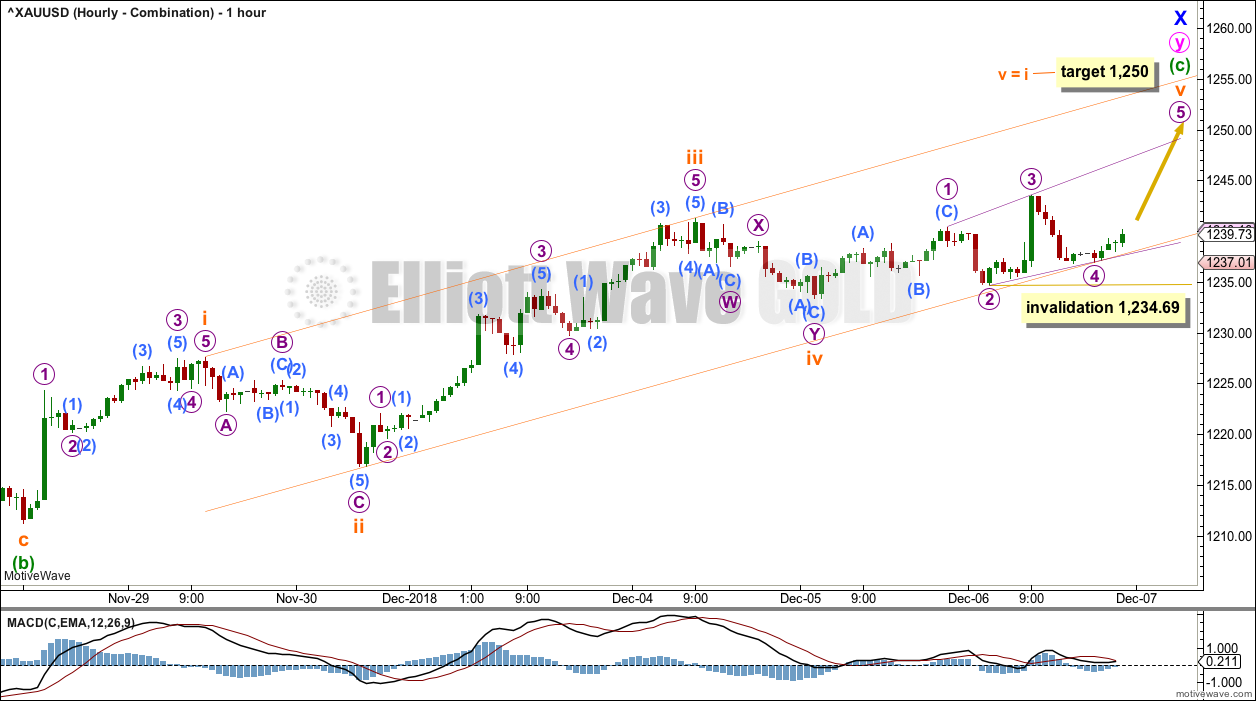
At the hourly chart level, this wave count expects an impulse is completing higher, exactly the same as the fist published hourly chart. The subdivisions, invalidation point and channel are all the same.
WEEKLY CHART – FLAT
Click chart to enlarge.
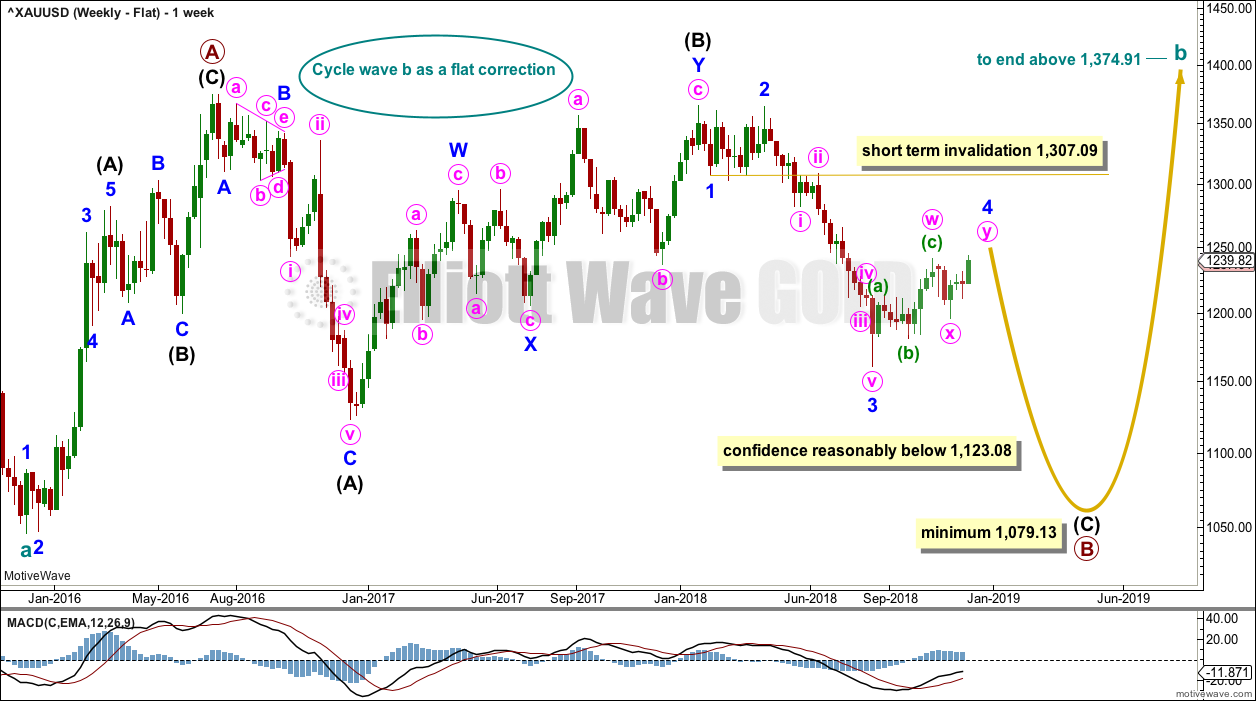
It is possible that cycle wave b may be a flat correction. Within a flat correction, primary wave B must retrace a minimum 0.9 length of primary wave A at 1,079.13 or below. Primary wave B may make a new low below the start of primary wave A at 1,046.27 as in an expanded flat correction.
Only a new low reasonably below 1,123.08 would provide reasonable confidence in this wave count.
Intermediate wave (C) must subdivide as a five wave structure; it may be unfolding as an impulse. Within intermediate wave (C), minor waves 1 through to 3 may be complete. Today minor wave 4 is relabelled as possibly incomplete as a double zigzag.
Minor wave 2 lasted 9 weeks. If minor wave 4 is incomplete, then at this time it has lasted 16 weeks and may continue for another one to few weeks. Minor wave 4 would be longer in duration than minor wave 2 by a reasonable margin. For Gold this is unusual, so the probability of this wave count is further reduced today.
TECHNICAL ANALYSIS
WEEKLY CHART
Click chart to enlarge. Chart courtesy of StockCharts.com.
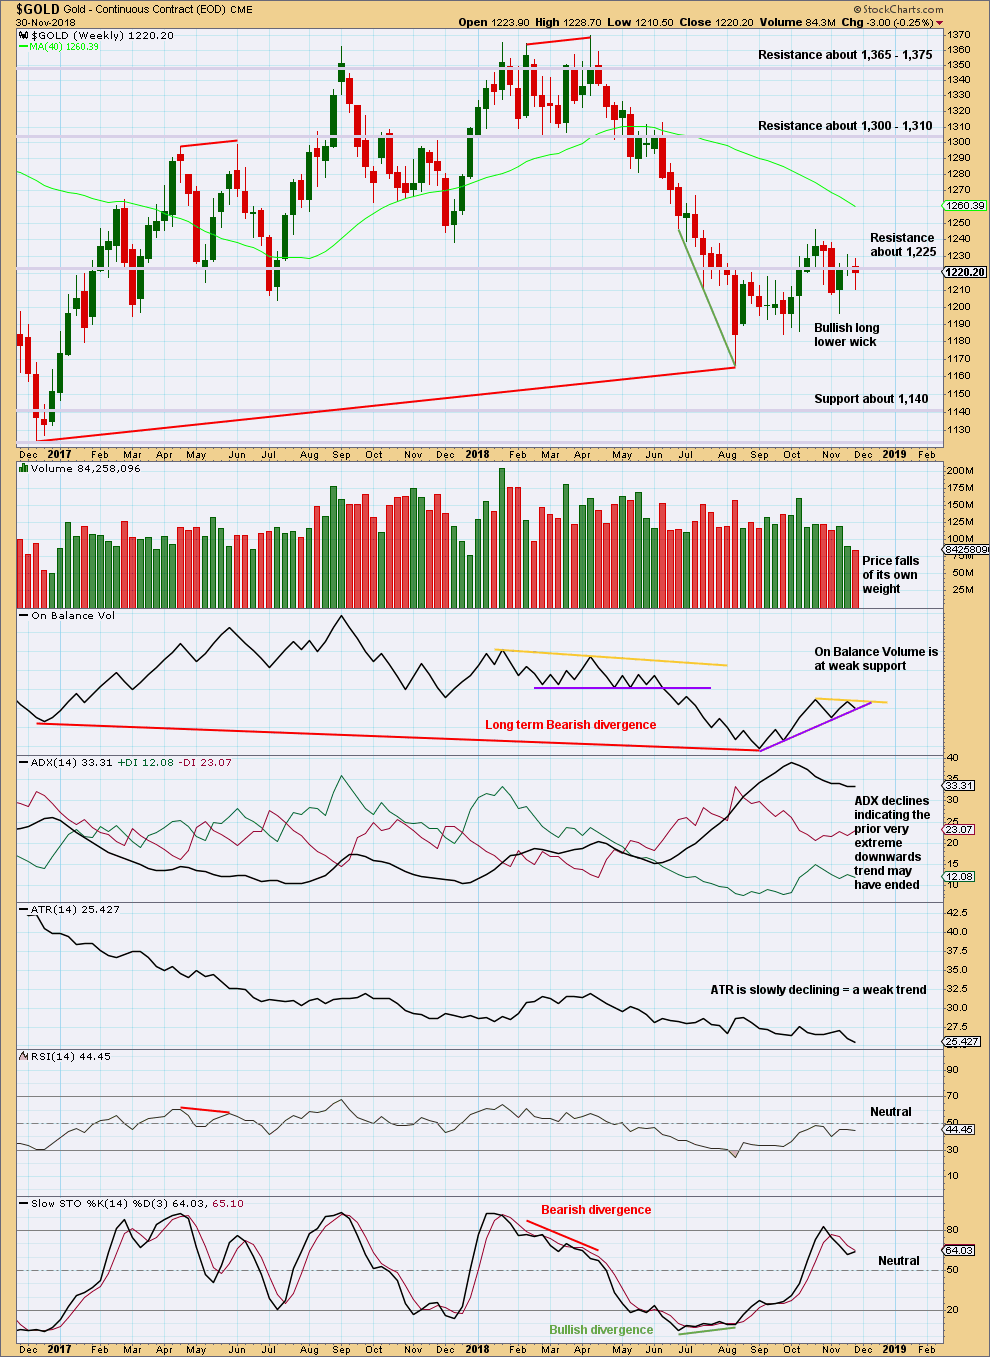
On Balance Volume has made a lower low than its prior low at the end of November 2015. This divergence is extremely bearish but does not rule out a consolidation unfolding here; the divergence does strongly support the Triangle wave count, which expects a consolidation or bounce up to test resistance now and then a continuation of a major bear market. It could also support the flat wave count that allows for a new low below 1,046.27 in coming months.
The last weekly candlestick is weak, but the long lower wick suggests upwards movement this week.
The support line for On Balance Volume is weak because it has a strong slope, but it may provide support. A break below it would be only a weak bearish signal; the line may have to then be redrawn.
DAILY CHART
Click chart to enlarge. Chart courtesy of StockCharts.com.
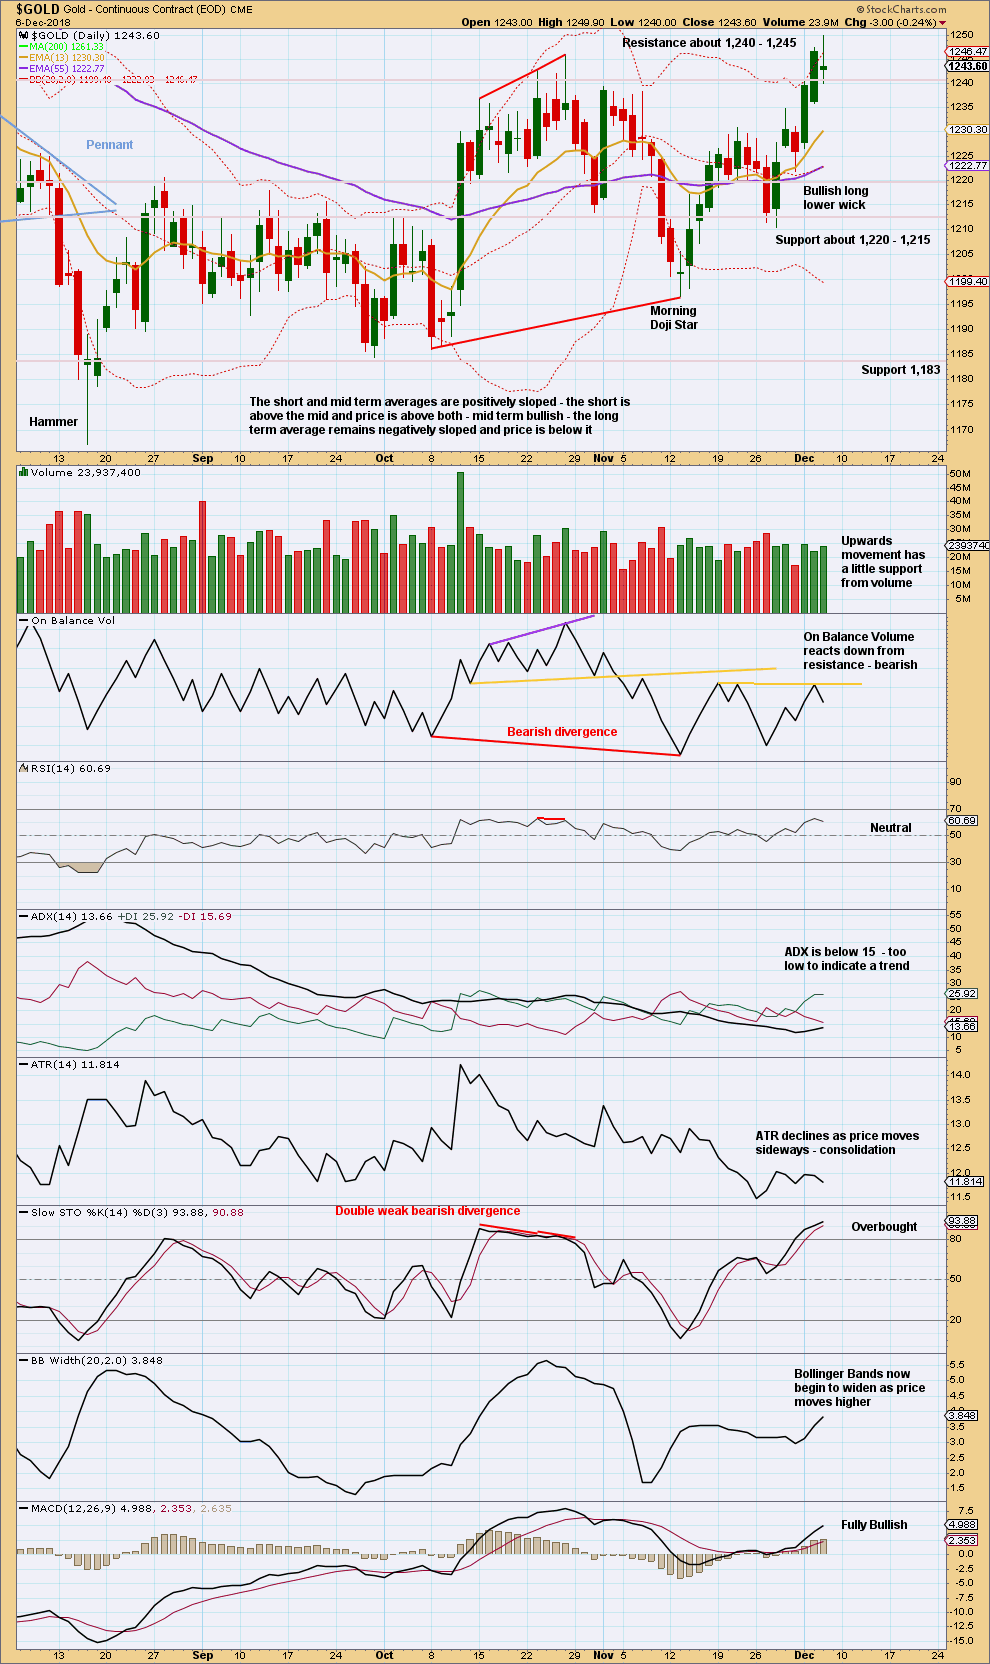
Gold may be within a larger consolidation with resistance about 1,240 – 1,245 and support about 1,195 – 1,183. Price is swinging from resistance to support and back again, with Stochastics reaching overbought when price reached resistance and oversold when price reached support.
Stochastics is now overbought. Price is at resistance, 1,240 – 1,245. The session for the 4th of December is not strong enough to be considered a clear upwards breakout; the close was only just above resistance, and volume did not show and increase beyond the day immediately prior.
However, with a new high on the 4th and 6th of December, there is a continuation of a series of higher highs and higher lows from the low of 16th of August. This is the basic definition of an upwards trend and what the preferred triangle Elliott wave count expects to see.
GDX WEEKLY CHART
Click chart to enlarge. Chart courtesy of StockCharts.com.
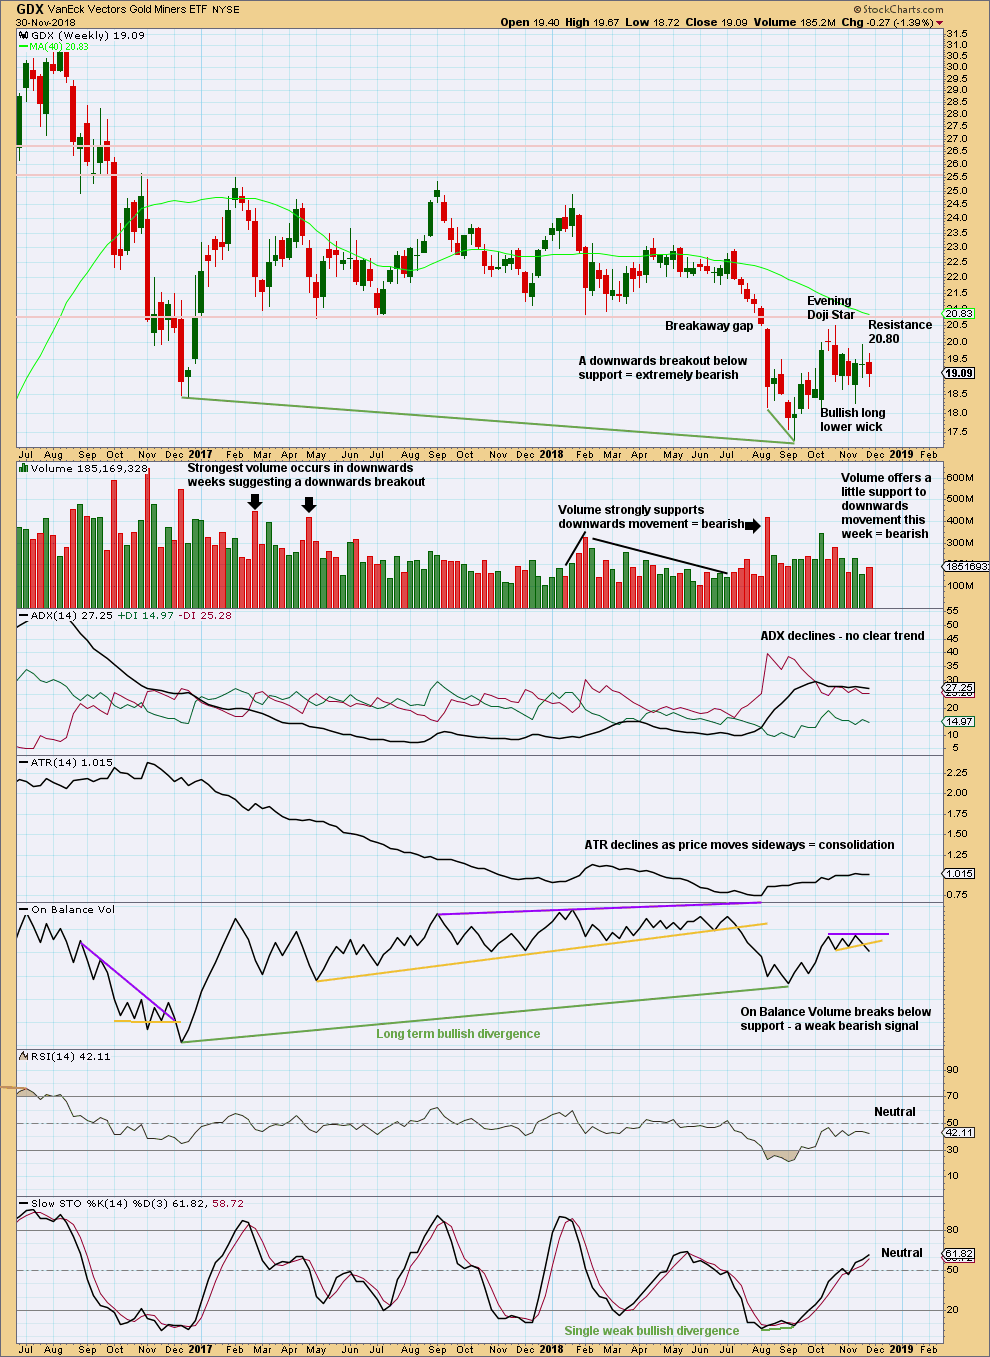
GDX had a large consolidation that lasted from January 2017 to August 2018. A downwards breakout below support at 20.80 in early August 2018 is highly significant. The breakout had support from volume, which adds confidence.
The target is at 16.02.
It looks again like the bounce may be complete. GDX this week has a bearish volume profile and a bearish signal from On Balance Volume.
GDX DAILY CHART
Click chart to enlarge. Chart courtesy of StockCharts.com.
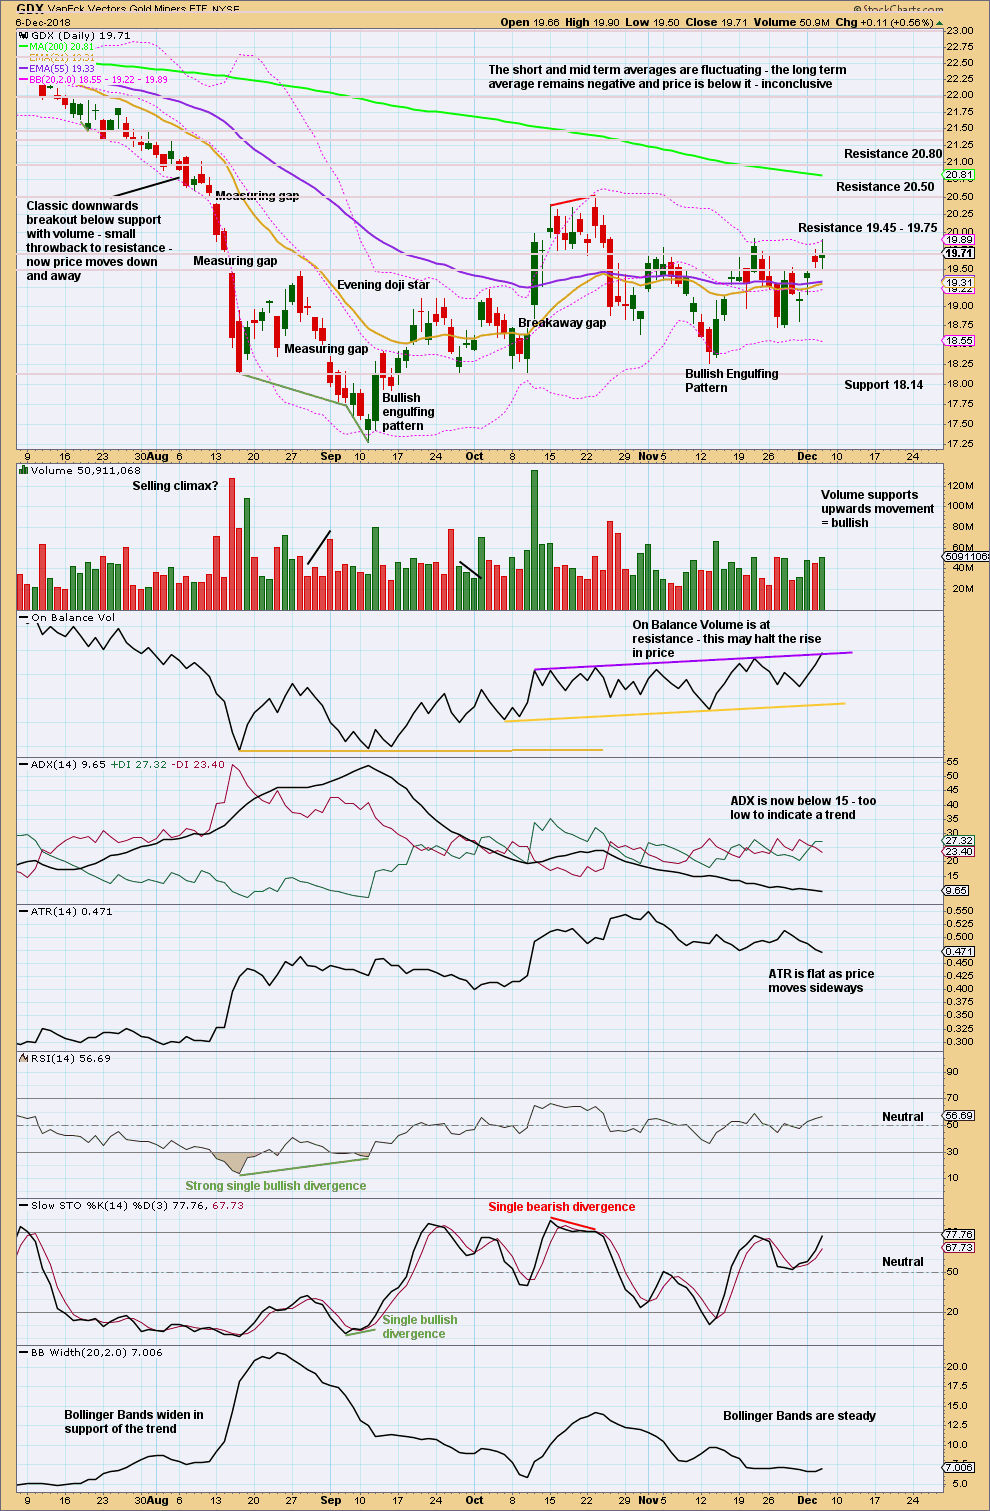
At the daily chart level, price is now within a consolidation that is bound by resistance above at 20.50 and support below at 18.14. It is the upwards day of the 11th of October that has strongest volume during this consolidation, suggesting an upwards breakout may be more likely than downwards. This technique does not always work, but it does work more often than it fails.
However, if price does break above 20.50, then it would be extremely likely to find very strong resistance just above at 20.80 and halt there. At a higher time frame that would look like a classic back test of resistance at prior support, identified on the weekly chart. If price does behave like that, it would offer a high probability low risk set up for a short position on GDX that may be held for the long term.
Price and On Balance Volume are both at resistance. For the short term, an upwards swing may be over about here.
Published @ 11:50 p.m. EST.
—
Careful risk management protects your trading account(s).
Follow my two Golden Rules:
1. Always trade with stops.
2. Risk only 1-5% of equity on any one trade.
The target is almost met. The structure of the ending expanding diagonal for subminuette wave v could be complete at any moment.
However, lets see how this session closes. If this is an upwards breakout with support from volume, then we may expect a little more upwards movement to begin next week.
Minuette wave (i) may continue higher, my target may be inadequate. Submineutte wave v may be an impulse, not a diagonal.