

S&P 500
Another downwards day remains above the invalidation point on the main Elliott wave count. Two alternate Elliott wave counts are published for members today.
Summary: With the data in hand, it still looks like a low may more likely be in place. This view has support from mid-term bullish divergence between price and both of the AD line and inverted VIX, with short-term divergence between price and both of RSI and Stochastics, and a bullish candlestick reversal pattern at the last low. The target remains at 3,070 for this bull market to end next year, either in March or October.
Two alternate Elliott wave counts allow for more downwards movement here for the short term. If price makes a new low below 2,583.23, then it is possible a low may be found very quickly. If not, then the target for the end of primary wave 4 would be about 2,478.
The biggest picture, Grand Super Cycle analysis, is here.
Last published monthly chart is here, video is here.
MAIN ELLIOTT WAVE COUNT
WEEKLY CHART

Click chart to enlarge.
Cycle wave V must complete as a five structure, which should look clear at the weekly chart level and also at the monthly chart level. It may only be an impulse or ending diagonal. It is clear it is an impulse.
Within primary wave 3, there is perfect alternation and excellent proportion between intermediate waves (2) and (4).
Draw the teal channel from the high of cycle wave I at 1,343.80 on the week beginning 3rd July 2011, to the high of cycle wave III at 2,079.46 on the week beginning 30th November 2014, and place a parallel copy on the low of cycle wave II at 1,074.77 on the week beginning 2nd October 2011. Draw this chart on a semi-log scale. A small overshoot, like that seen at the end of cycle wave IV, would be entirely acceptable.
The channel has now been overshot twice at the end of primary wave 4. This is acceptable. If this wave count is correct, then a breach of this channel would be unlikely. A breach may be defined as a full weekly candlestick below and not touching the lower trend line.
This wave count has the right look at the monthly chart level.
If primary wave 5 ends at or after the end of December 2018 and the AD line fails to make new all time highs, there would then be the minimum required four months of bearish divergence between price and the AD line. If this happens, then the conditions for the end of this bull market would be in place.
Primary wave 4 may not move into primary wave 1 price territory below 2,111.05.
Three daily charts are published.
DAILY CHART
Click chart to enlarge.
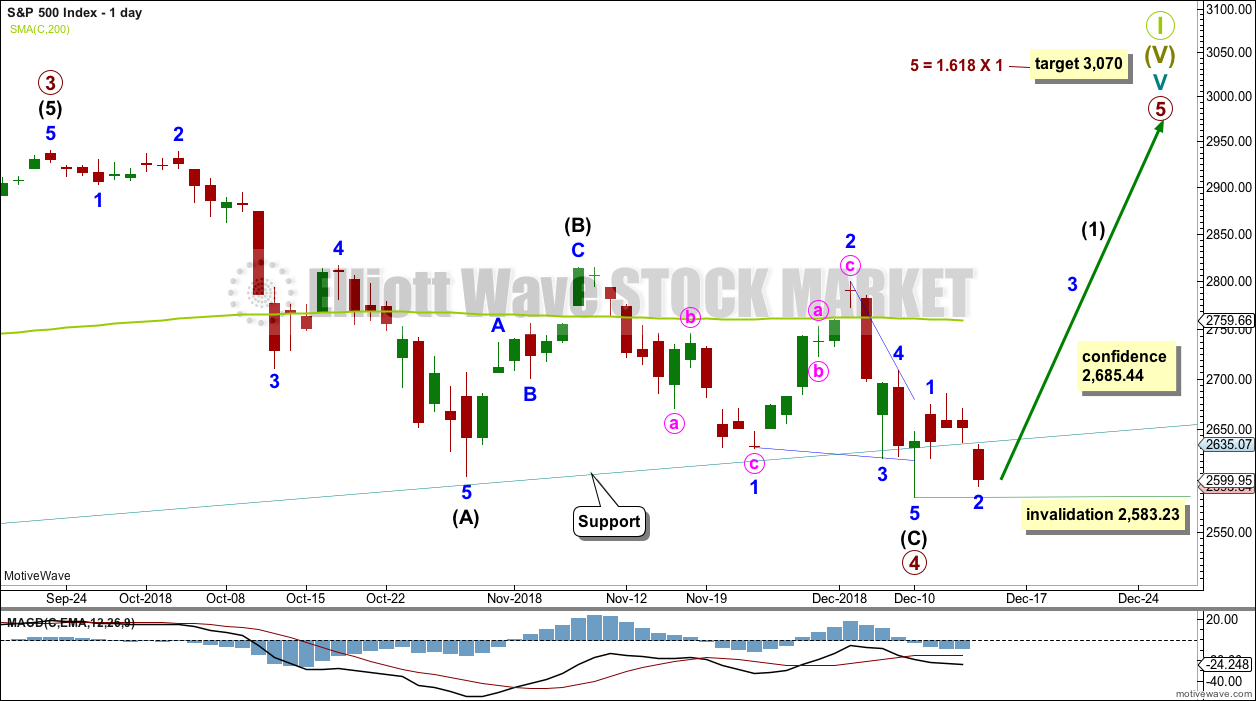
Primary wave 4 may be a complete single zigzag.
Within the zigzag, intermediate wave (C) must subdivide as a five wave structure. It may be a complete ending contracting diagonal.
Within the ending diagonal, all sub-waves must subdivide as zigzags, minor wave 4 must overlap minor wave 1 price territory, and minor wave 4 may not move beyond the end of minor wave 2 above 2,800.18.
Minor wave 5 may have ended with an overshoot of the 1-3 trend line.
If primary wave 5 were to only reach equality in length with primary wave 1, it would be truncated. The next Fibonacci ratio in the sequence is used to calculate a target.
Within primary wave 5, minor wave 2 may not move beyond the start of minor wave 1 below 2,583.23.
FIRST ALTERNATE DAILY CHART
Click chart to enlarge.
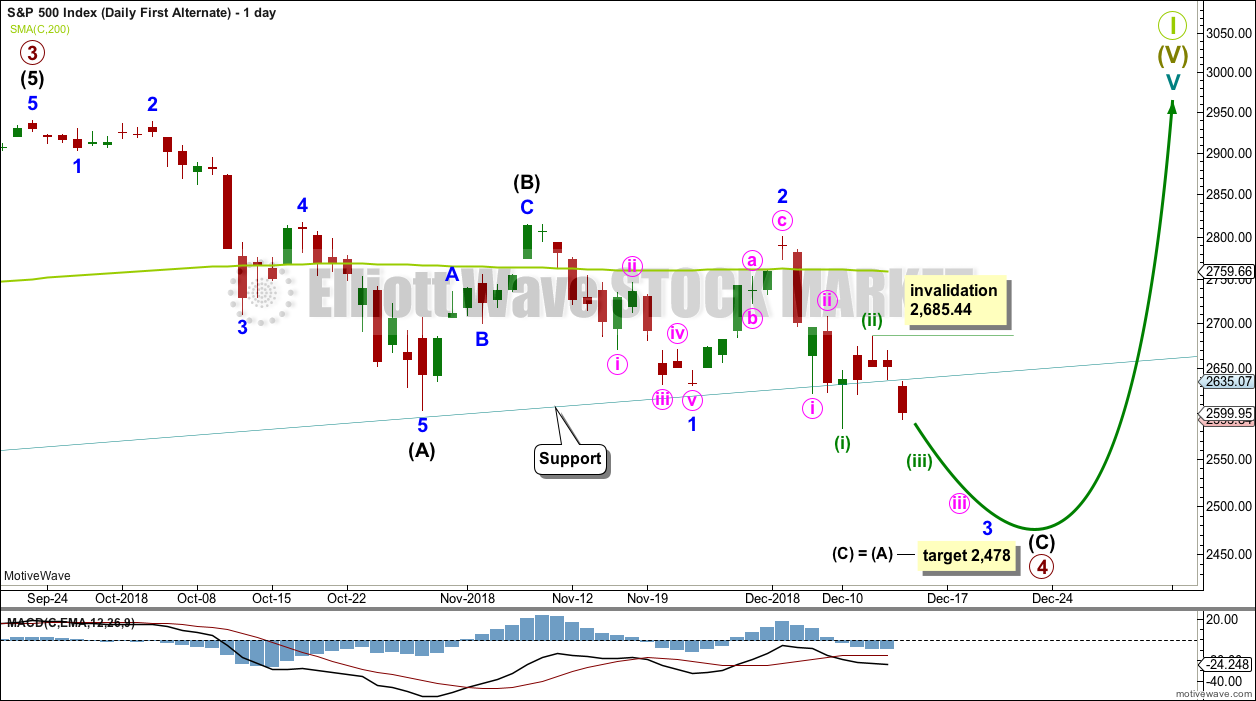
The other possible structure for intermediate wave (C) would be a simple impulse. If intermediate wave (C) is unfolding as an impulse, then it may now have three first and second waves complete. This wave count would expect to see an increase in downwards momentum as the middle of a third wave unfolds.
Within minute wave iii, minuette wave (ii) may not move beyond the start of minuette wave (i) above 2,709.21.
This wave count would expect to see a very large breach of the teal trend channel on the weekly chart. This has not happened during the life of this trend channel.
The S&P commonly forms slow curving rounded tops. When it does this, it can breach channels only to continue on to make new all time highs. When it breaches upwards channels and then continues onwards, price often will find resistance at the lower edge of the channel. It is possible that Super Cycle wave I may end in this way.
SECOND ALTERNATE DAILY CHART
Click chart to enlarge.
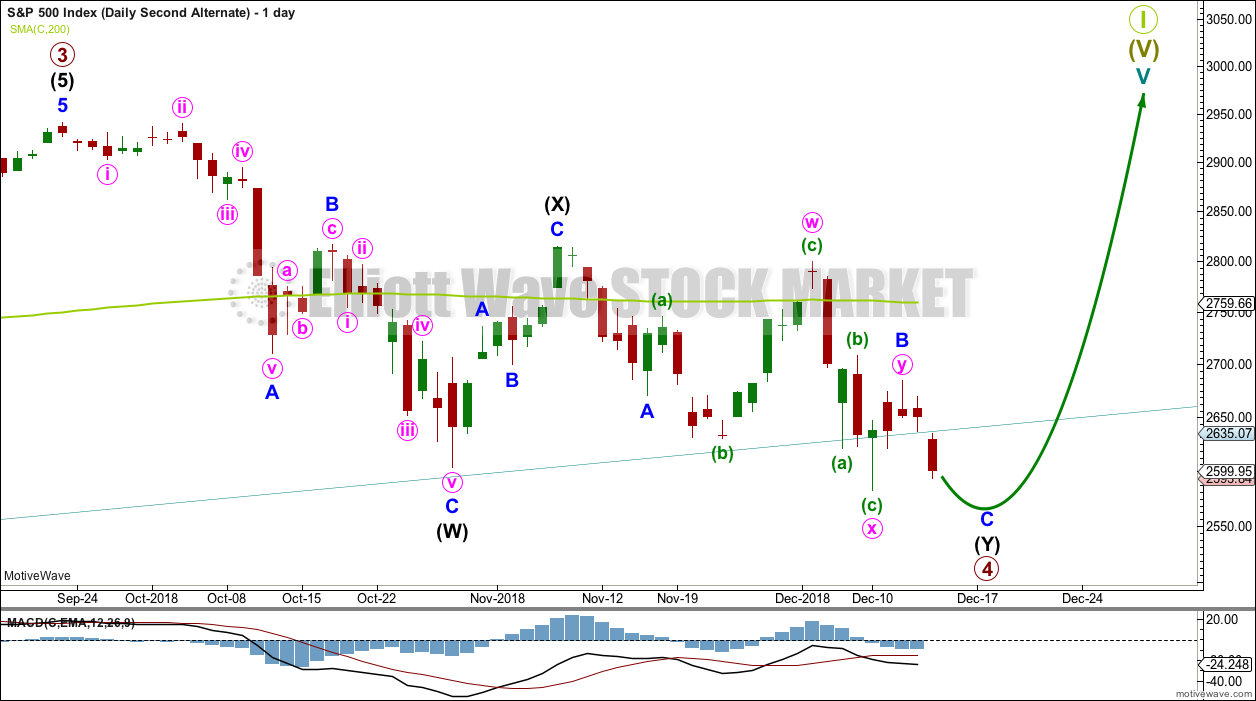
While the first two daily charts consider primary wave 4 as a single zigzag, this second daily alternate chart considers primary wave 4 as a double zigzag.
The first zigzag in the double is complete and labelled intermediate wave (W). The double is joined by a complete three in the opposite direction, a zigzag labelled intermediate wave (X). The second zigzag in the double may be incomplete, which is labelled intermediate wave (Y).
Within the second zigzag of intermediate wave (Y), minor waves A and B may be complete. Minor wave B is labeled as a possible double combination. All subdivisions fit perfectly, but this structure has a downwards slope. Double combinations are fairly common structures, but they normally have a sideways look. This one does not. However, the S&P does not always have normal looking structures. This is an acceptable alternate wave count for this market.
This wave count allows for a very little more downwards movement to a new low next week, followed by a quick reversal. This wave count would expect to see the teal trend channel overshot by next week’s weekly candlestick but not properly breached.
TECHNICAL ANALYSIS
WEEKLY CHART
Click chart to enlarge. Chart courtesy of StockCharts.com.
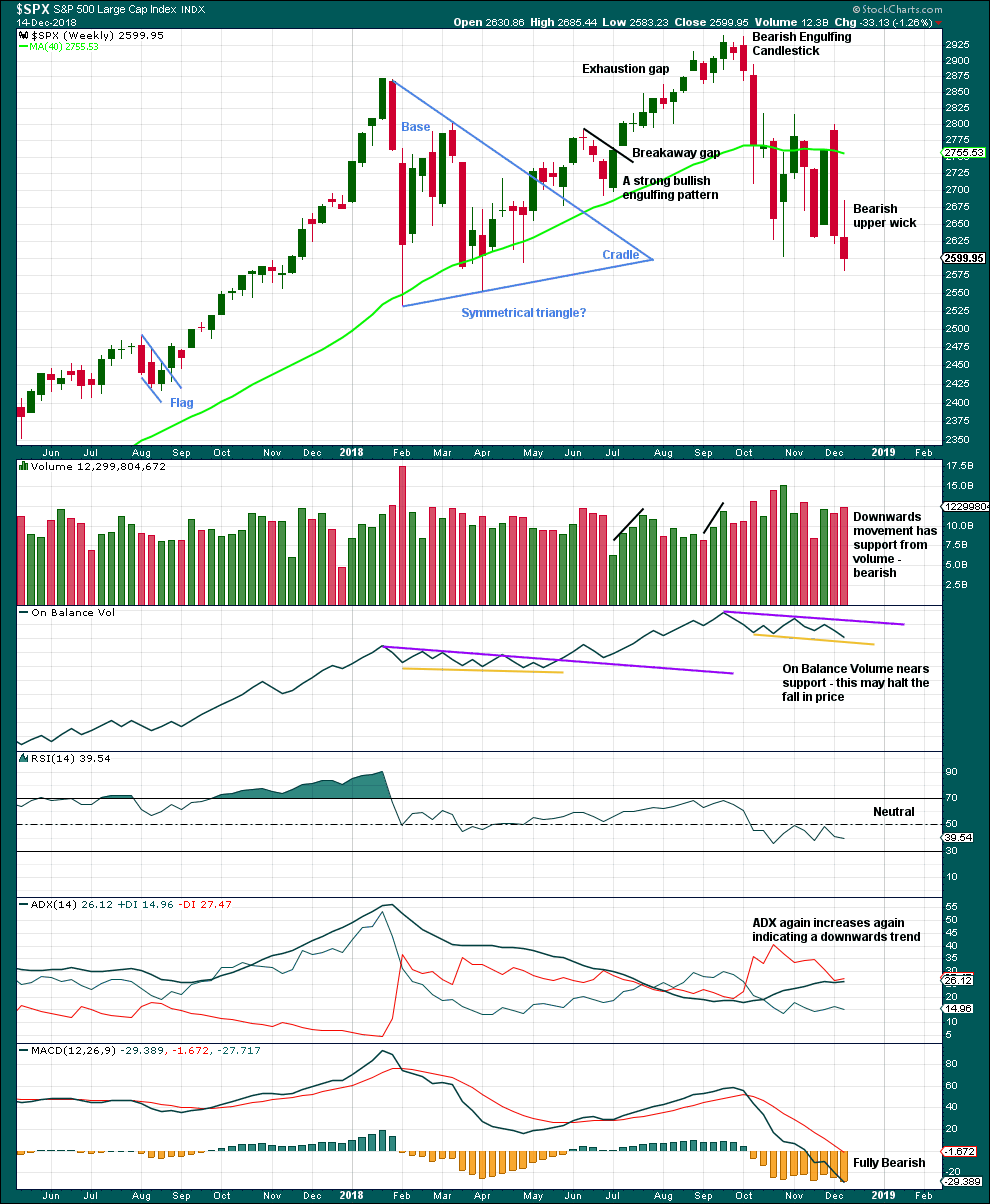
The strongest volume for recent weeks is for the upwards week beginning 29th of October. This short-term volume profile at this time frame is bullish.
For a more bearish outlook a bearish signal from On Balance Volume would be preferred.
The last weekly candlestick has a bearish long upper wick, but it has a smaller real body and has not moved price substantially lower.
DAILY CHART

Click chart to enlarge. Chart courtesy of StockCharts.com.
The lower edge of the teal trend channel is not shown on this chart, but it should be considered as part of this technical analysis. Expect that trend line to continue to provide support, until it does not.
A downwards trend ended on the 29th of October and a sideways consolidation began on that date. Price is bound with resistance above about 2,800 – 2,815 and final support below about 2,630 – 2,580. It is four upwards days during this consolidation that have strongest volume. This suggests an upwards breakout is more likely than downwards. This technique does not always work, but it works more often than it fails. In this instance, because the number of days in agreement is four, it has a little more confidence.
While volume has slightly increased on Friday for a downwards day, volume is still weaker than previous upwards days.
The signal from On Balance Volume is very weak because the line breached had only the minimum two anchor points and was very short.
There is still bullish divergence between price and both of RSI and Stochastics.
BREADTH – AD LINE
WEEKLY CHART
Click chart to enlarge. Chart courtesy of StockCharts.com. So that colour blind members are included, bearish signals
will be noted with blue and bullish signals with yellow.
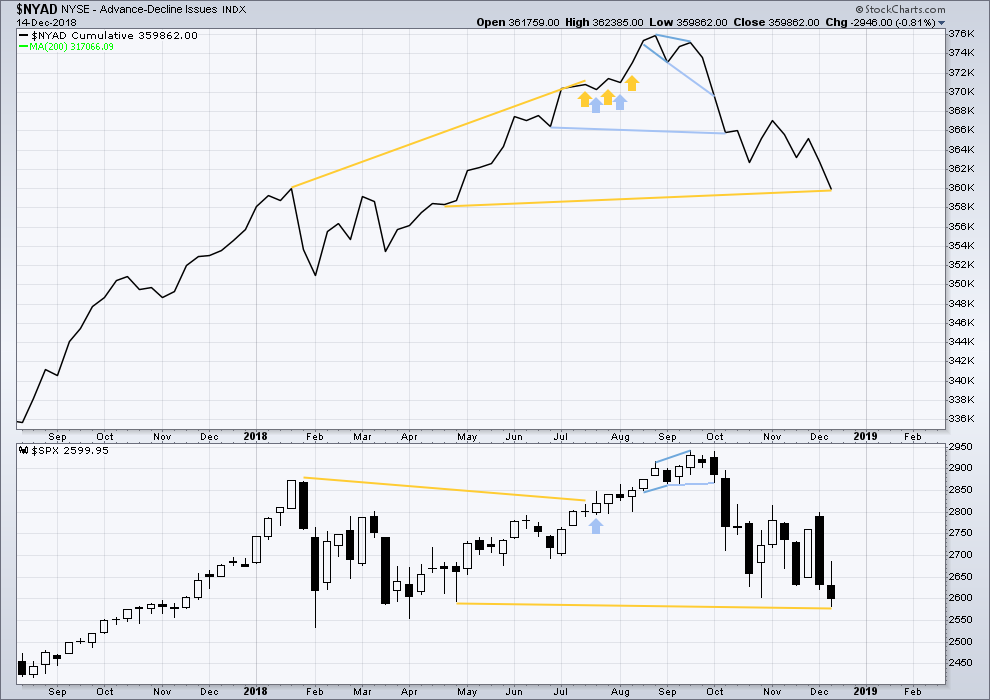
There is mid-term bullish divergence between price and the AD line. This week price has made new lows below the prior low of the week beginning the 30th of April, but the AD line has not. This indicates that downwards movement does not have support from a corresponding decline in market breadth; there is some weakness within price.
DAILY CHART
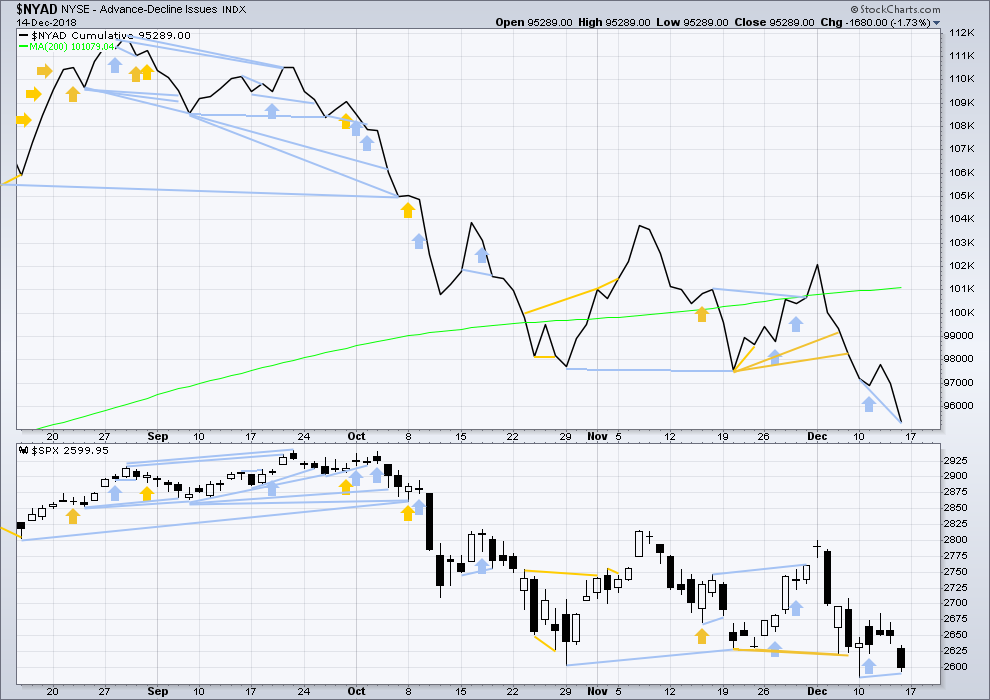
Click chart to enlarge. Chart courtesy of StockCharts.com. So that colour blind members are included, bearish signals
will be noted with blue and bullish signals with yellow.
There is normally 4-6 months divergence between price and market breadth prior to a full fledged bear market. This has been so for all major bear markets within the last 90 odd years. With no longer-term divergence yet at this point, any decline in price should be expected to be a pullback within an ongoing bull market and not necessarily the start of a bear market. New all time highs from the AD line on the 29th of August means that the beginning of any bear market may be at the end of December 2018, but it may of course be a lot longer than that.
Breadth should be read as a leading indicator.
On Friday the AD line has made a new low below the prior low of 10th of December, but price has not. This divergence is bearish for the short term and supports either alternate Elliott wave count.
Nearing the end of this bull market, to the end of primary wave 5, bearish signals from the AD line may begin to accumulate.
VOLATILITY – INVERTED VIX CHART
WEEKLY CHART
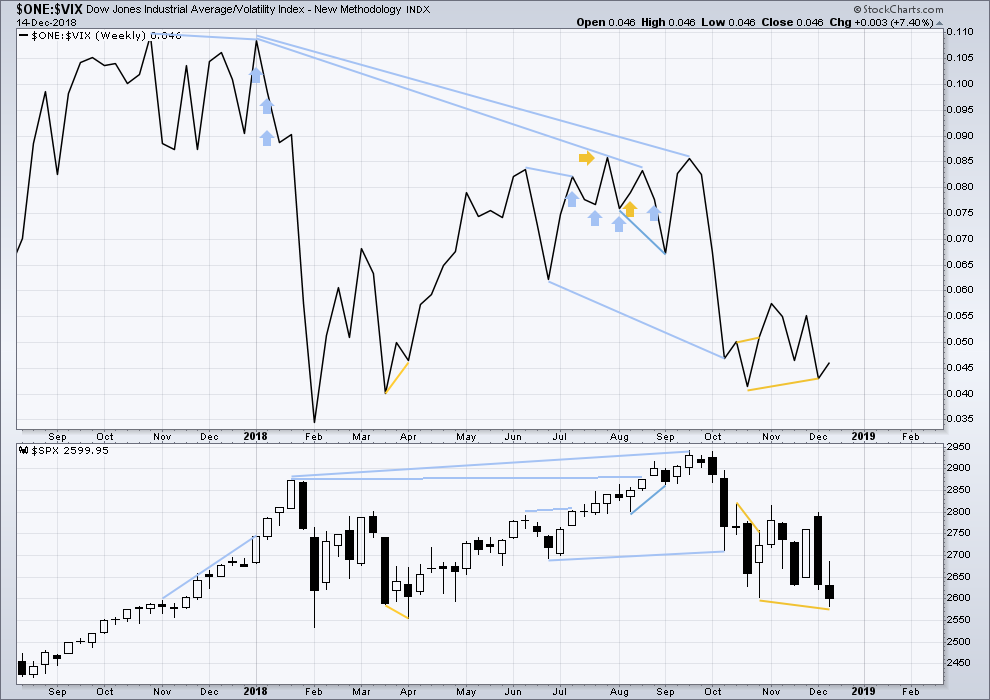
Click chart to enlarge. Chart courtesy of StockCharts.com. So that colour blind members are included, bearish signals
will be noted with blue and bullish signals with yellow.
This week price has made a new low below the prior swing low, but inverted VIX has not. This divergence is bullish and indicates downwards movement this week does not come with a normal corresponding increase in VIX.
DAILY CHART

Click chart to enlarge. Chart courtesy of StockCharts.com. So that colour blind members are included, bearish signals
will be noted with blue and bullish signals with yellow.
Normally, volatility should decline as price moves higher and increase as price moves lower. This means that normally inverted VIX should move in the same direction as price.
Like the AD line, inverted VIX may now begin to accumulate instances of bearish signals or divergence as a fifth wave at three large degrees comes to an end.
Downwards movement in price for Friday has a normal corresponding increase in VIX. VIX is not increasing any faster than price is falling. There is no divergence.
DOW THEORY
The following lows need to be exceeded for Dow Theory to confirm the end of the bull market and a change to a bear market:
DOW JONES INDUSTRIAL AVERAGE

Click chart to enlarge.
DJIA: 23,344.52.
DOW JONES TRANSPORTATION AVERAGE
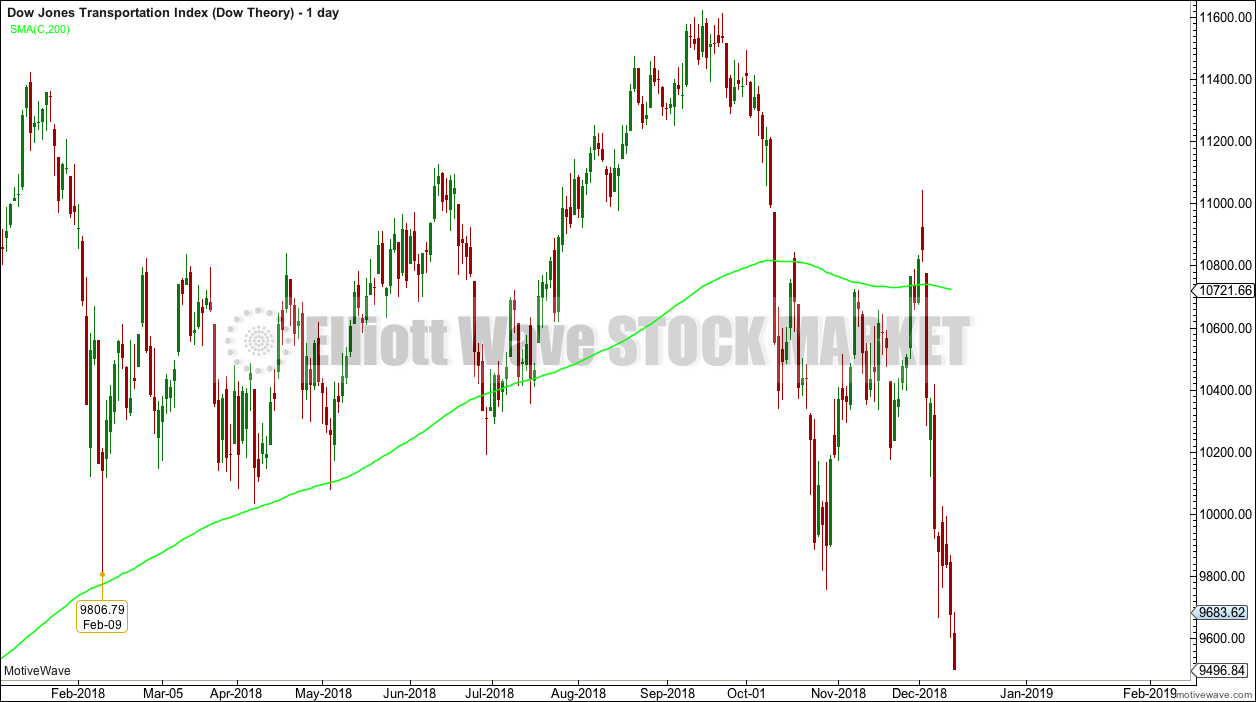
Click chart to enlarge.
DJT: 9,806.79 – price has closed below this point on the 13th of December.
S&P500

Click chart to enlarge.
S&P500: 2,532.69.
NASDAQ
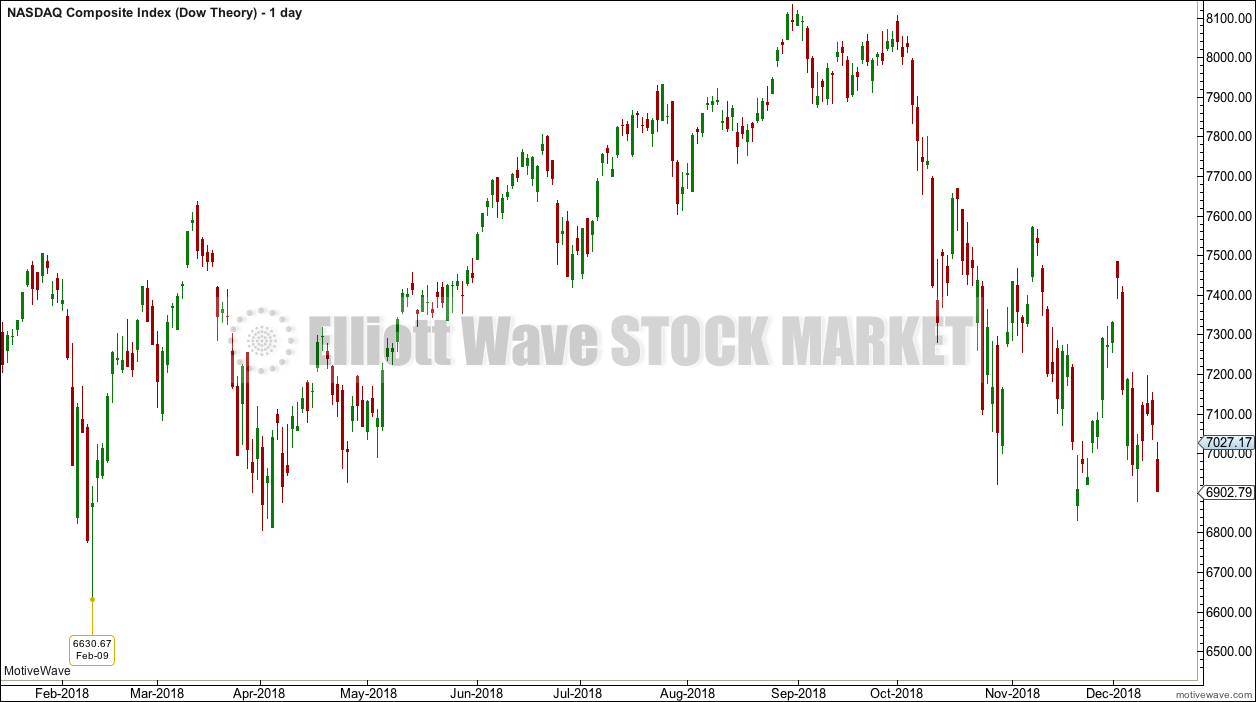
Click chart to enlarge.
Nasdaq: 6,630.67.
GOLD
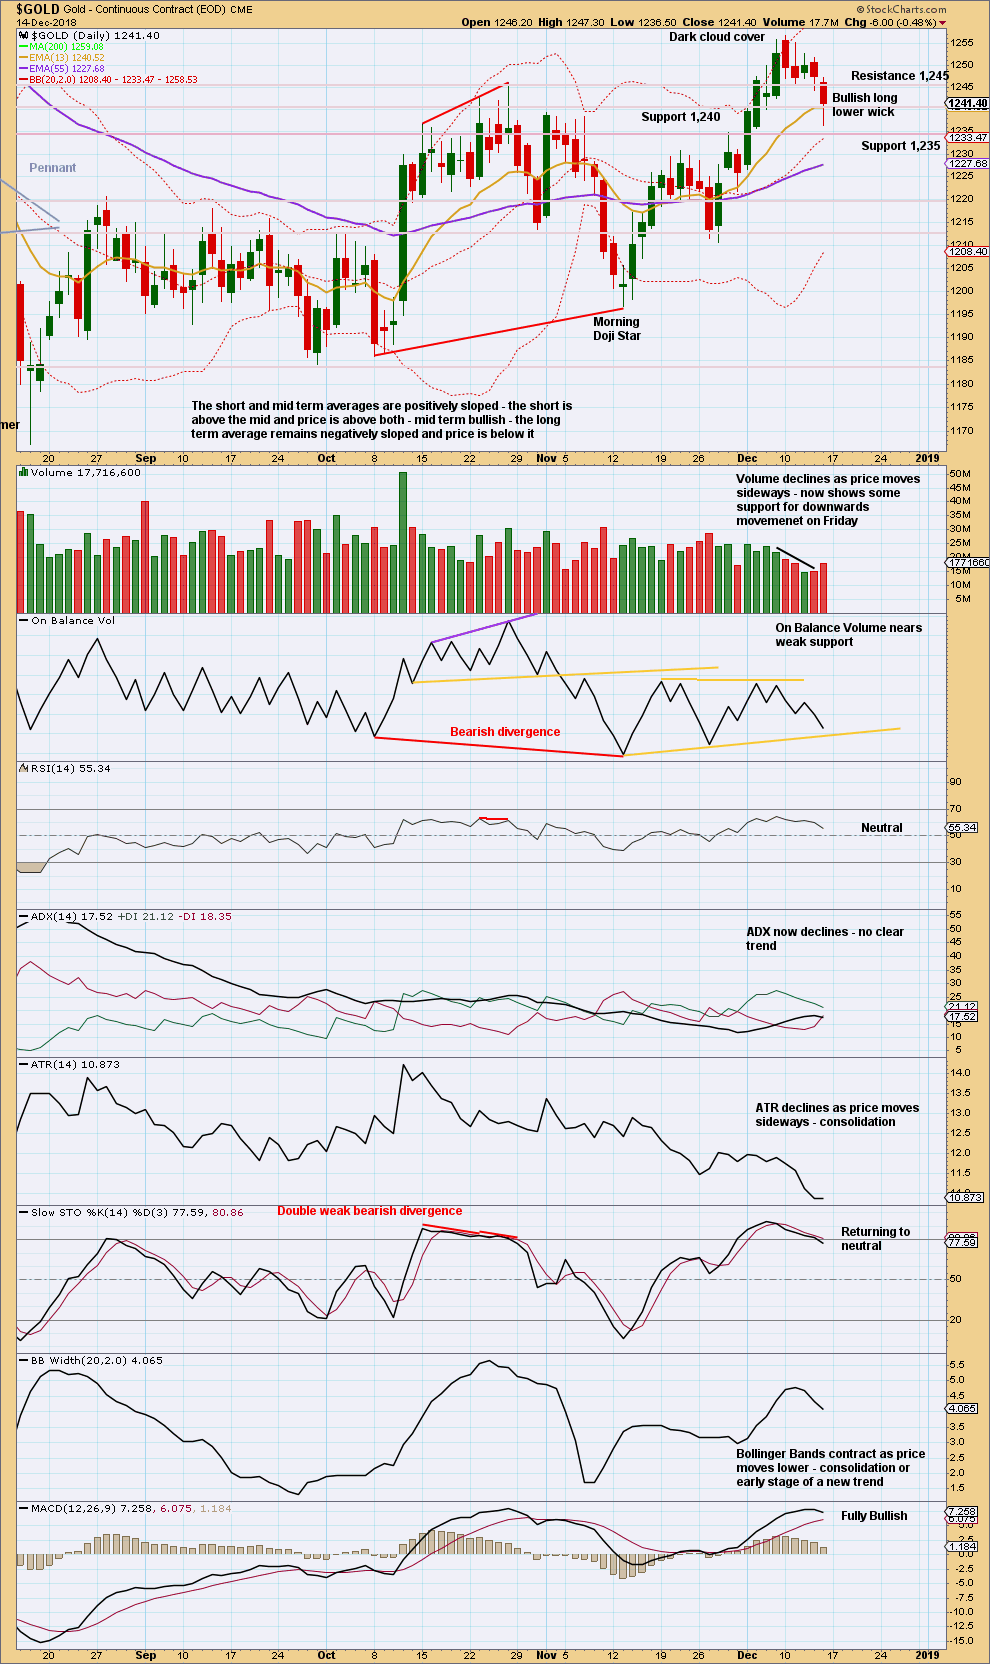
A pullback was expected to end about 1,235. Downwards movement for Friday reached 1,232.98 and then quickly reversed.
Summary: The upwards trend may now resume. The mid-term target is 1,295.
The final target for this bounce to end is about 1,305 – 1,310.
Grand SuperCycle analysis is here.
Last historic analysis with monthly charts is here.
There are four remaining weekly wave counts at this time for cycle wave b: a triangle, a flat, a combination, and a double zigzag.
At this time, the Triangle wave count may again be slightly more likely.
MAIN ELLIOTT WAVE COUNT
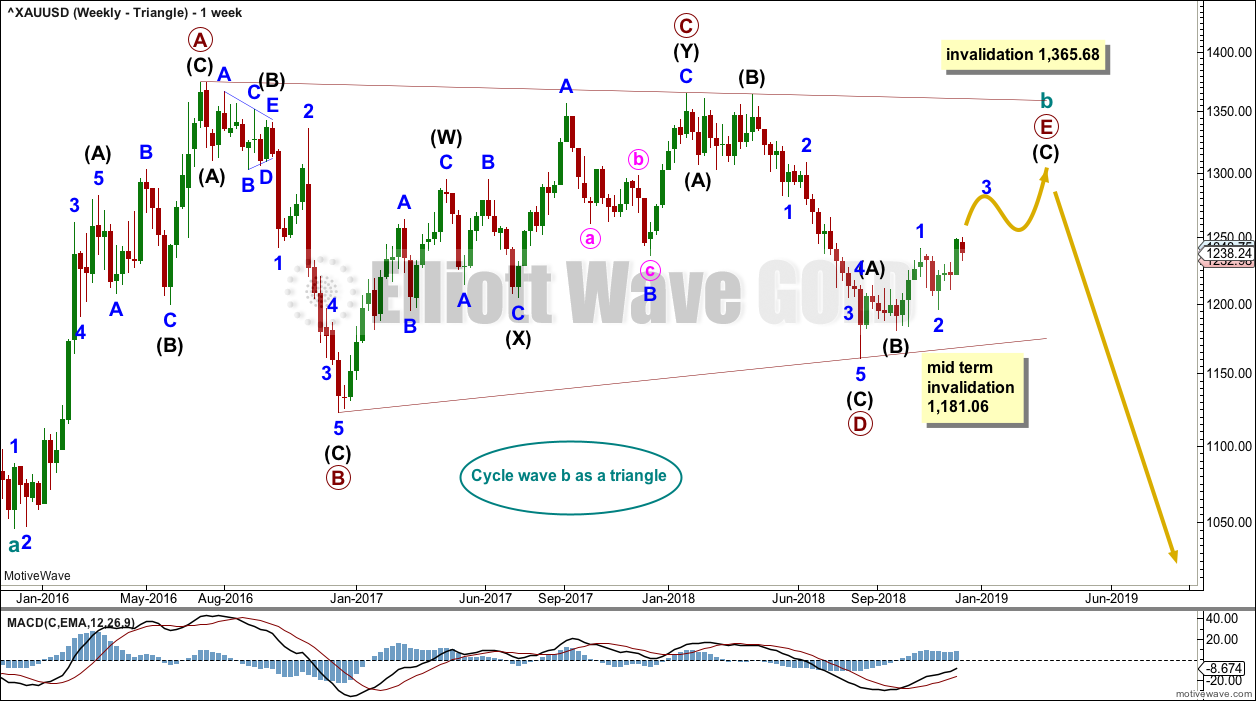
WEEKLY CHART – TRIANGLE
Click chart to enlarge.
Cycle wave b may be an incomplete regular contracting triangle. Primary wave E may not move beyond the end of primary wave C above 1,365.68.
Within primary wave E, intermediate waves (A) and (B) may be complete. Intermediate wave (C) must subdivide as a five wave structure. Within intermediate wave (C), minor wave 2 may not move beyond the start of minor wave 1 below 1,181.06.
Four of the five sub-waves of a triangle must be zigzags, with only one sub-wave allowed to be a multiple zigzag. Wave C is the most common sub-wave to subdivide as a multiple, and this is how primary wave C for this example fits best. Primary wave E would most likely be a single zigzag. It is also possible that it may subdivide as a triangle to create a rare nine wave triangle.
There are no problems in terms of subdivisions or rare structures for this wave count. It has an excellent fit and so far a typical look.
When primary wave E is a complete three wave structure, then this wave count would expect a cycle degree trend change. Cycle wave c would most likely make new lows below the end of cycle wave a at 1,046.27 to avoid a truncation.
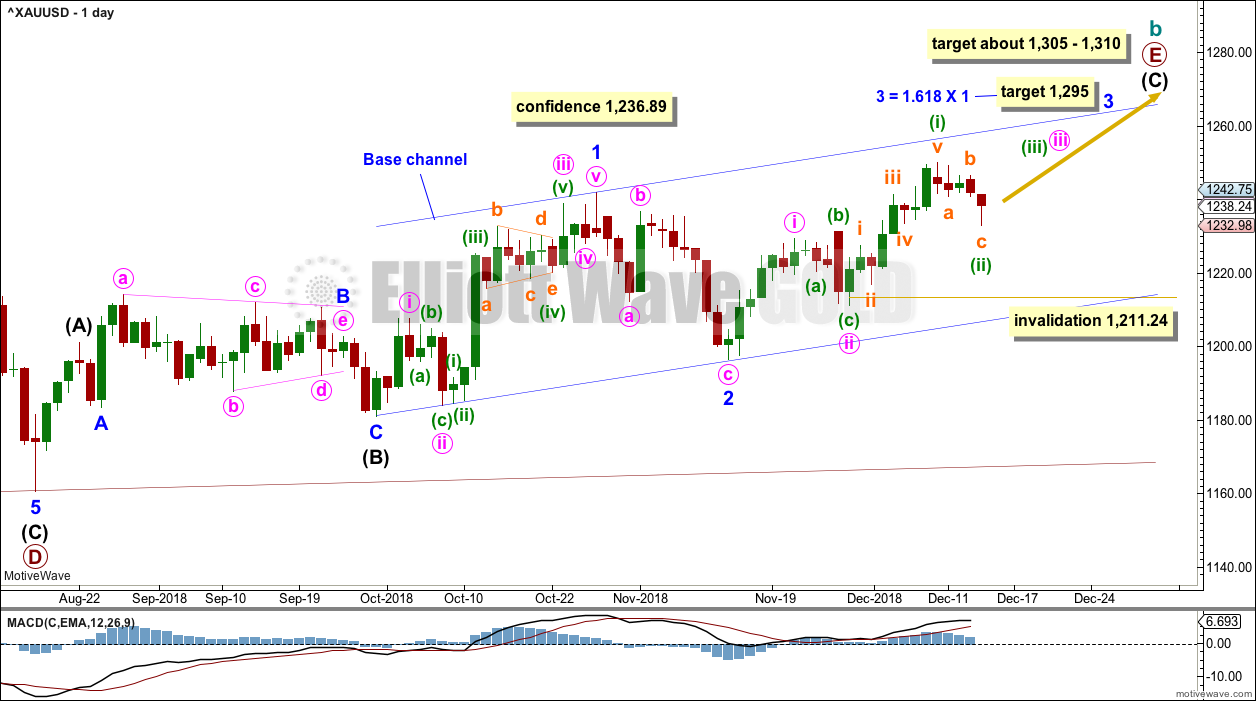
DAILY CHART – TRIANGLE
Click chart to enlarge.
Primary wave E should now be underway for this wave count.
Primary wave E should subdivide as a zigzag. Intermediate waves (A) and (B) may now be complete. Intermediate wave (C) may be underway.
Minor wave 1 fits perfectly as a five wave impulse. Minor wave 2 should be complete as a deep zigzag. Minor wave 3 may now exhibit an increase in upwards momentum, and it should have support from volume. The target for minor wave 3 expects it to exhibit a common Fibonacci ratio to minor wave 1.
Minor wave 3 may only subdivide as an impulse. Within minor wave 3, minute waves i and ii may now be complete. Within minute wave iii, minuette wave (ii) may not move beyond the start of minuette wave (i) below 1,211.24.
This wave count now expects to see a third wave at three degrees to begin next week. An increase in upwards momentum is expected.
A target for primary wave E is the strong zone of resistance about 1,305 to 1,310. Primary wave E is most likely to subdivide as a zigzag (although it may also subdivide as a triangle to create a rare nine wave triangle). It may last a total Fibonacci 21 or 34 weeks. So far it has lasted 13 weeks. Primary wave E may not move beyond the end of primary wave C above 1,365.68.
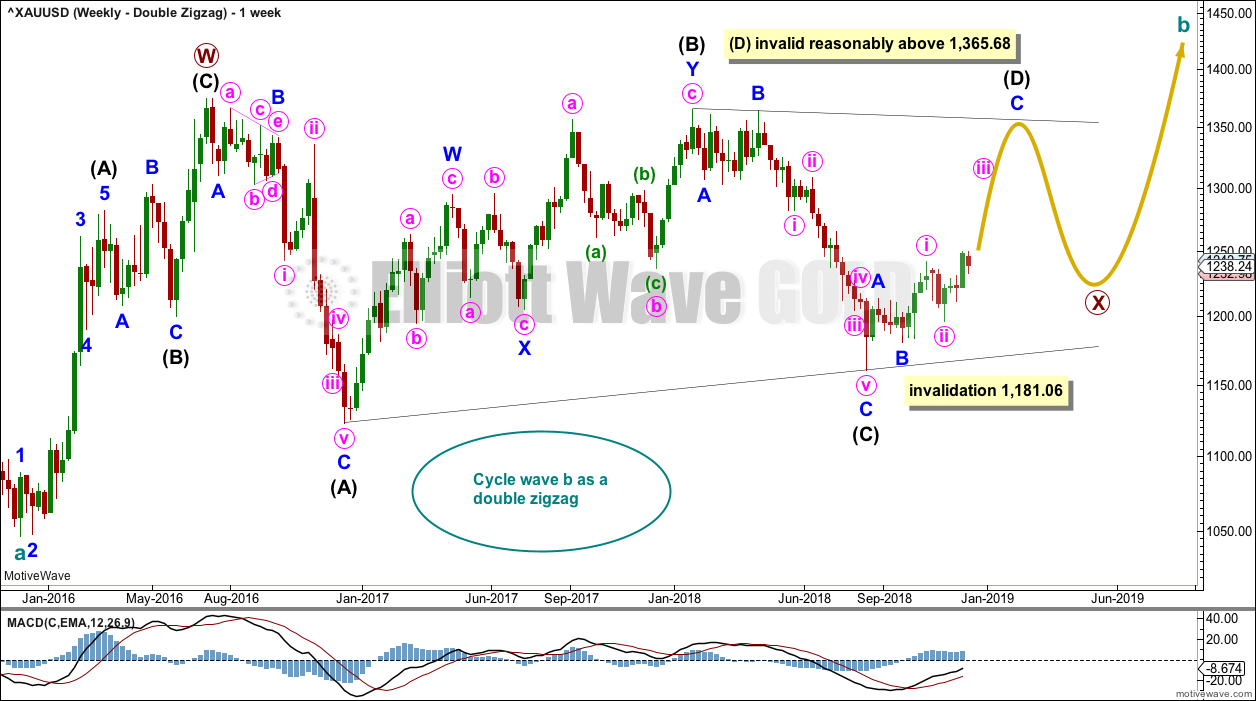
WEEKLY CHART – DOUBLE ZIGZAG
Click chart to enlarge.
It is possible that cycle wave b may be a double zigzag or a double combination.
The first zigzag in the double is labelled primary wave W. This has a good fit.
The double may be joined by a corrective structure in the opposite direction, a triangle labelled primary wave X. The triangle would be about three quarters complete.
Within the triangle of primary wave X, intermediate wave (C) should be complete. Within intermediate wave (D), minor waves A and B may be complete. Minor wave C must subdivide as a five wave structure. Within minor wave C, minute wave ii may not move beyond the start of minute wave i below 1,181.06.
Intermediate wave (D) would most likely subdivide as a single zigzag.
This wave count may now expect choppy overlapping movement in an ever decreasing range for several more months.
Primary wave Y would most likely be a zigzag because primary wave X would be shallow; double zigzags normally have relatively shallow X waves.
Primary wave Y may also be a flat correction if cycle wave b is a double combination, but combinations normally have deep X waves. This would be less likely.
This wave count has good proportions and no problems in terms of subdivisions.
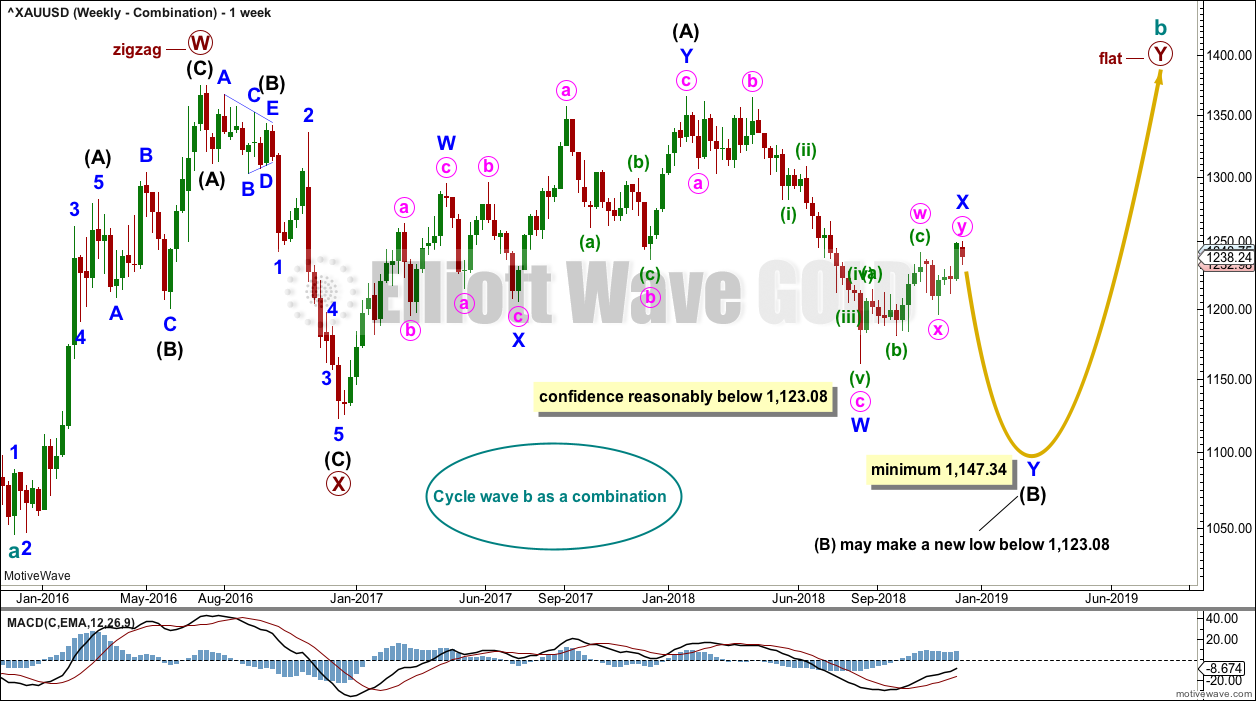
WEEKLY CHART – COMBINATION
Click chart to enlarge.
If cycle wave b is a combination, then the first structure in a double may be a complete zigzag labelled primary wave W.
The double may be joined by a three in the opposite direction, a zigzag labelled primary wave X.
The second structure in the double may be a flat correction labelled primary wave Y. My research on Gold so far has found that the most common two structures in a double combination are one zigzag and one flat correction. I have found only one instance where a triangle unfolded for wave Y. The most likely structure for wave Y would be a flat correction by a very wide margin, so that is what this wave count shall expect.
Within a flat correction for primary wave Y, the current downwards wave of intermediate wave (B) may be a double zigzag. Intermediate wave (B) must retrace a minimum 0.9 length of intermediate wave (A) at 1,147.34. Intermediate wave (B) may move beyond the start of intermediate wave (A) as in an expanded flat.
No upper invalidation point is given on this chart. Minor wave X may still continue higher. There is no Elliott wave rule stating a minimum nor maximum length for X waves within multiples.
Because the minimum requirement for intermediate wave (B) is not yet met, this wave count requires that intermediate wave (B) continues lower. This is the most immediately bearish of all four weekly wave counts.
When intermediate wave (B) is complete, then intermediate wave (C) would be expected to make at least a slight new high above the end of intermediate wave (A) at 1,365.68 to avoid a truncation. Primary wave Y would be most likely to end about the same level as primary wave W at 1,374.91, so that the whole structure takes up time and moves price sideways, as that is the purpose of double combinations.
While double combinations are very common, triples are extremely rare. I have found no examples of triple combinations for Gold at daily chart time frames or higher back to 1976. When the second structure in a double is complete, then it is extremely likely (almost certain) that the whole correction is over.
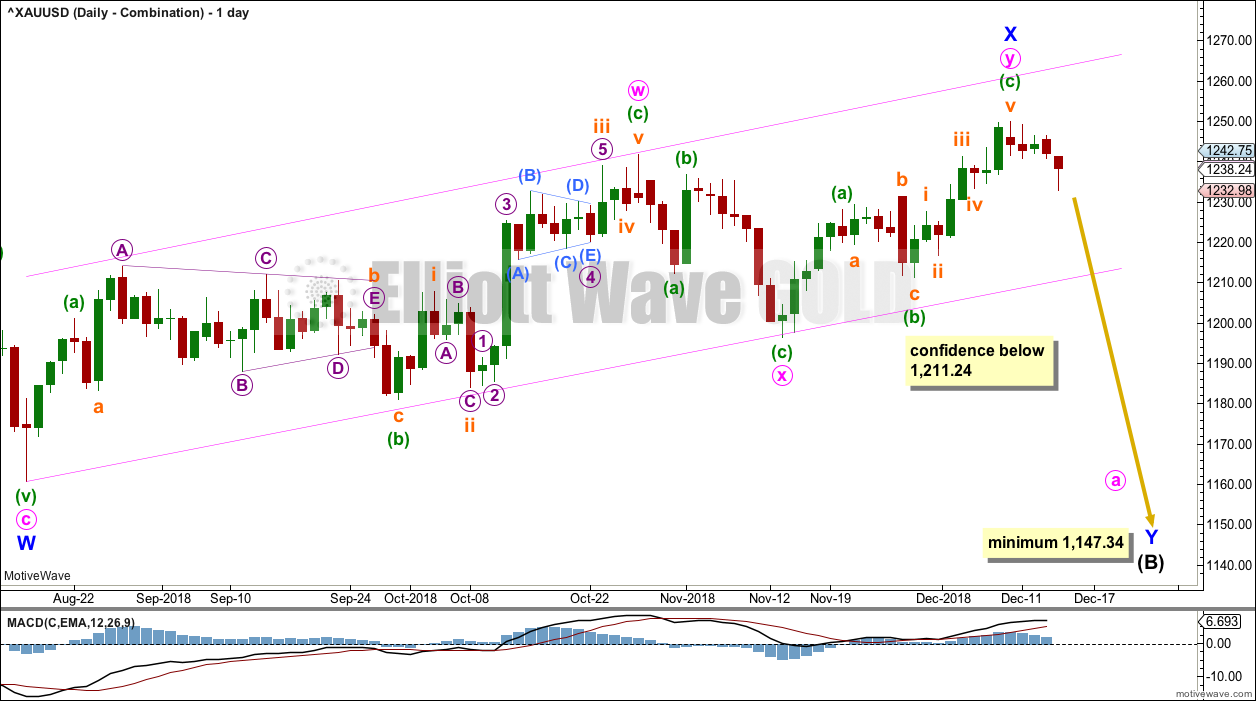
DAILY CHART – COMBINATION
Click chart to enlarge.
Minor wave X may be a complete double zigzag.
The maximum number of corrective structures within a multiple is three. This number refers to W, Y and Z. Each of W, Y and Z may only be simple corrective structures; they may not be multiples. However, the total of three does not include X waves, so X waves may be any corrective structure including multiples and the Elliott wave rule is not violated.
While X waves may be multiples, they very rarely are. The probability of this wave count is reduced.
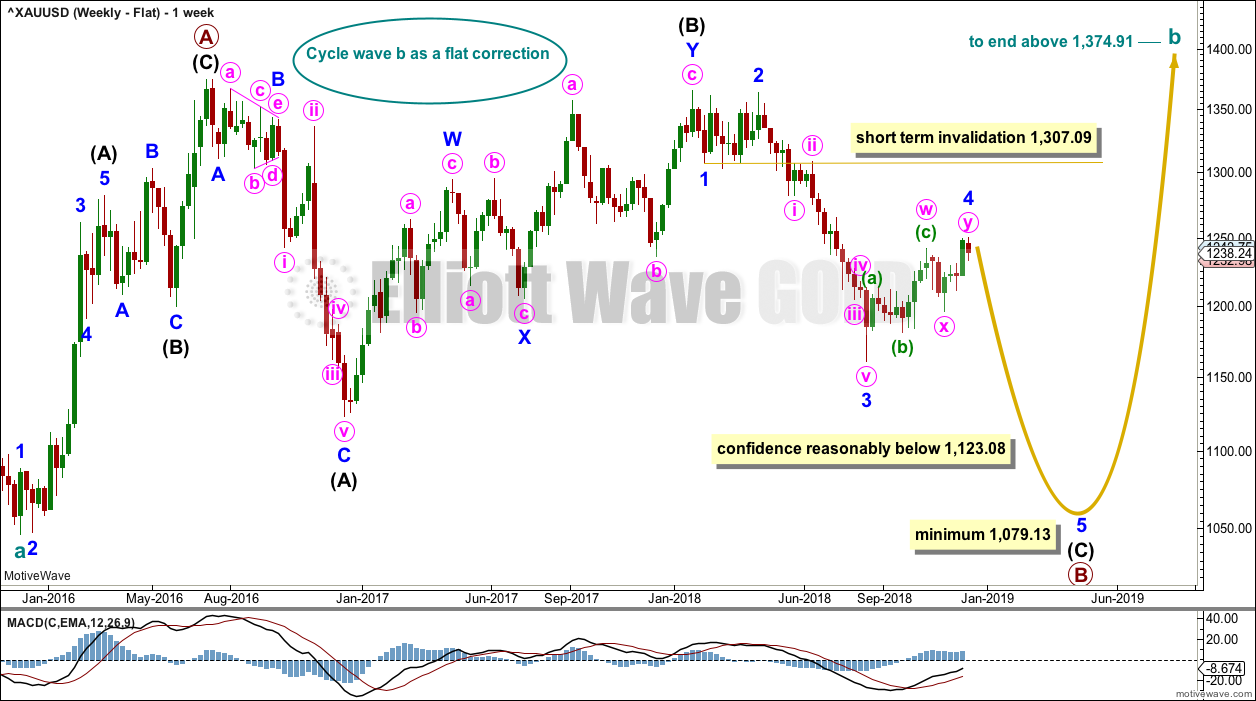
WEEKLY CHART – FLAT
Click chart to enlarge.
It is possible that cycle wave b may be a flat correction. Within a flat correction, primary wave B must retrace a minimum 0.9 length of primary wave A at 1,079.13 or below. Primary wave B may make a new low below the start of primary wave A at 1,046.27 as in an expanded flat correction.
Only a new low reasonably below 1,123.08 would provide reasonable confidence in this wave count.
Intermediate wave (C) must subdivide as a five wave structure; it may be unfolding as an impulse. Within intermediate wave (C), minor waves 1 through to 3 may be complete. Today minor wave 4 is relabelled as possibly incomplete as a double zigzag.
Minor wave 2 lasted 9 weeks. If minor wave 4 is now complete, then it has lasted 17 weeks. Minor wave 4 would be longer in duration than minor wave 2 by a reasonable margin. For Gold this is unusual, so the probability of this wave count is further reduced.
TECHNICAL ANALYSIS
WEEKLY CHART
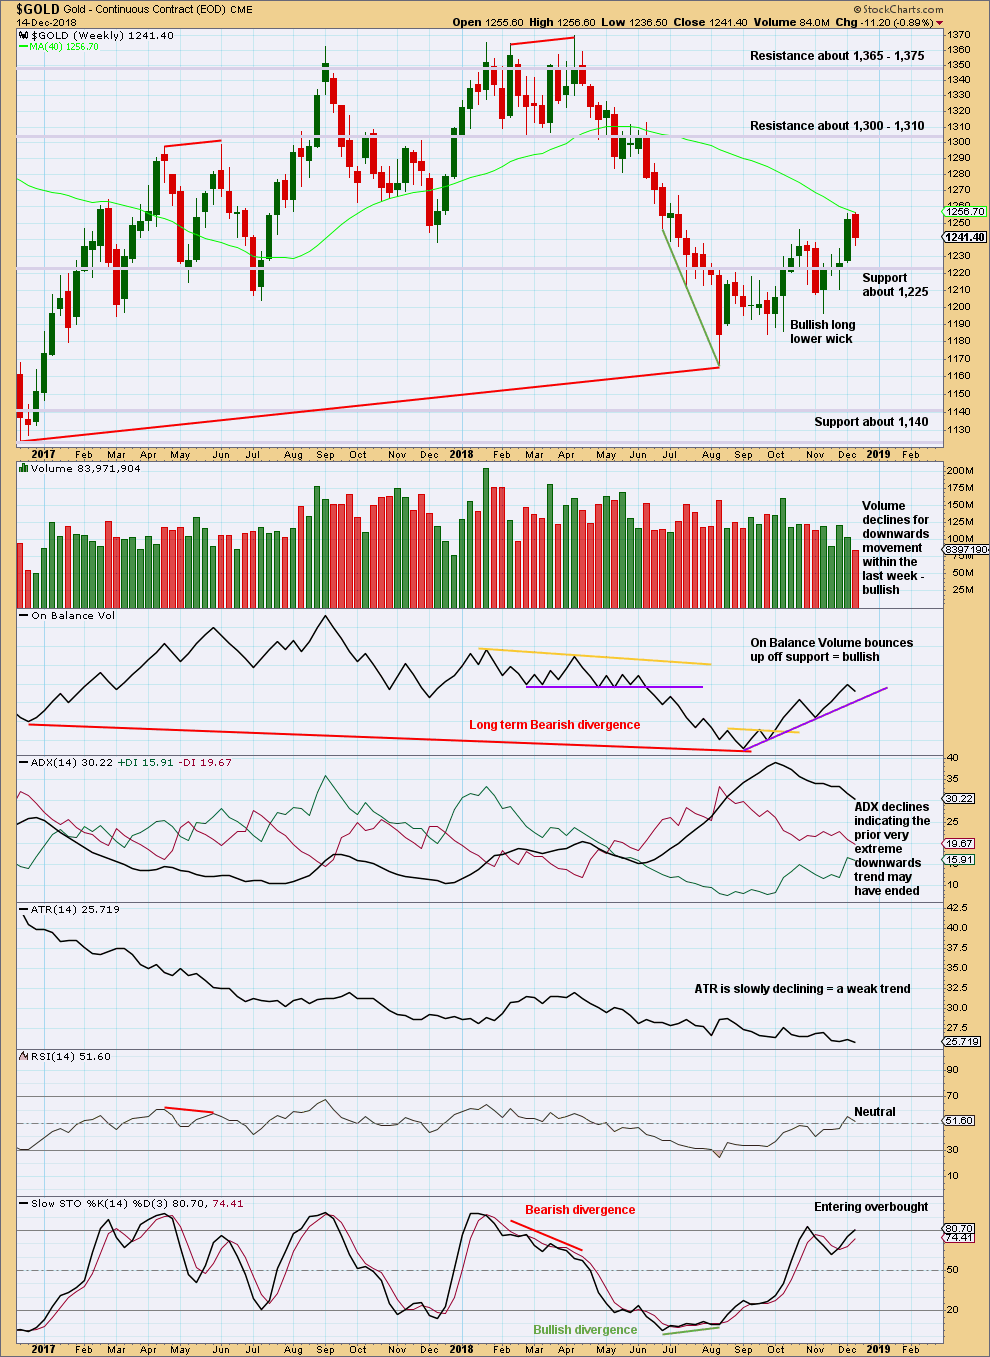
Click chart to enlarge. Chart courtesy of StockCharts.com.
On Balance Volume has made a lower low than its prior low at the end of November 2015. This divergence is extremely bearish but does not rule out a consolidation unfolding here; the divergence does strongly support the Triangle wave count, which expects a consolidation or bounce up to test resistance now and then a continuation of a major bear market. It could also support the flat wave count that allows for a new low below 1,046.27 in coming months.
This week completed an upwards week with a higher high and a higher low, but the candlestick is red and the balance of volume is downwards. Downwards movement within this week does not have support from volume.
DAILY CHART
Click chart to enlarge. Chart courtesy of StockCharts.com.
Weight is given to the bullish long lower wick on Friday’s candlestick. It looks like Monday may print a green daily candlestick.
The support line for On Balance Volume is redrawn.
Support from volume for Friday is bearish, but this can occur at the end of a movement for commodity markets.
Overall, this chart shows an upwards trend for Gold since the low on 16th of August. A series of higher highs and higher lows may be expected to continue, until a swing low is exceeded.
GDX WEEKLY CHART
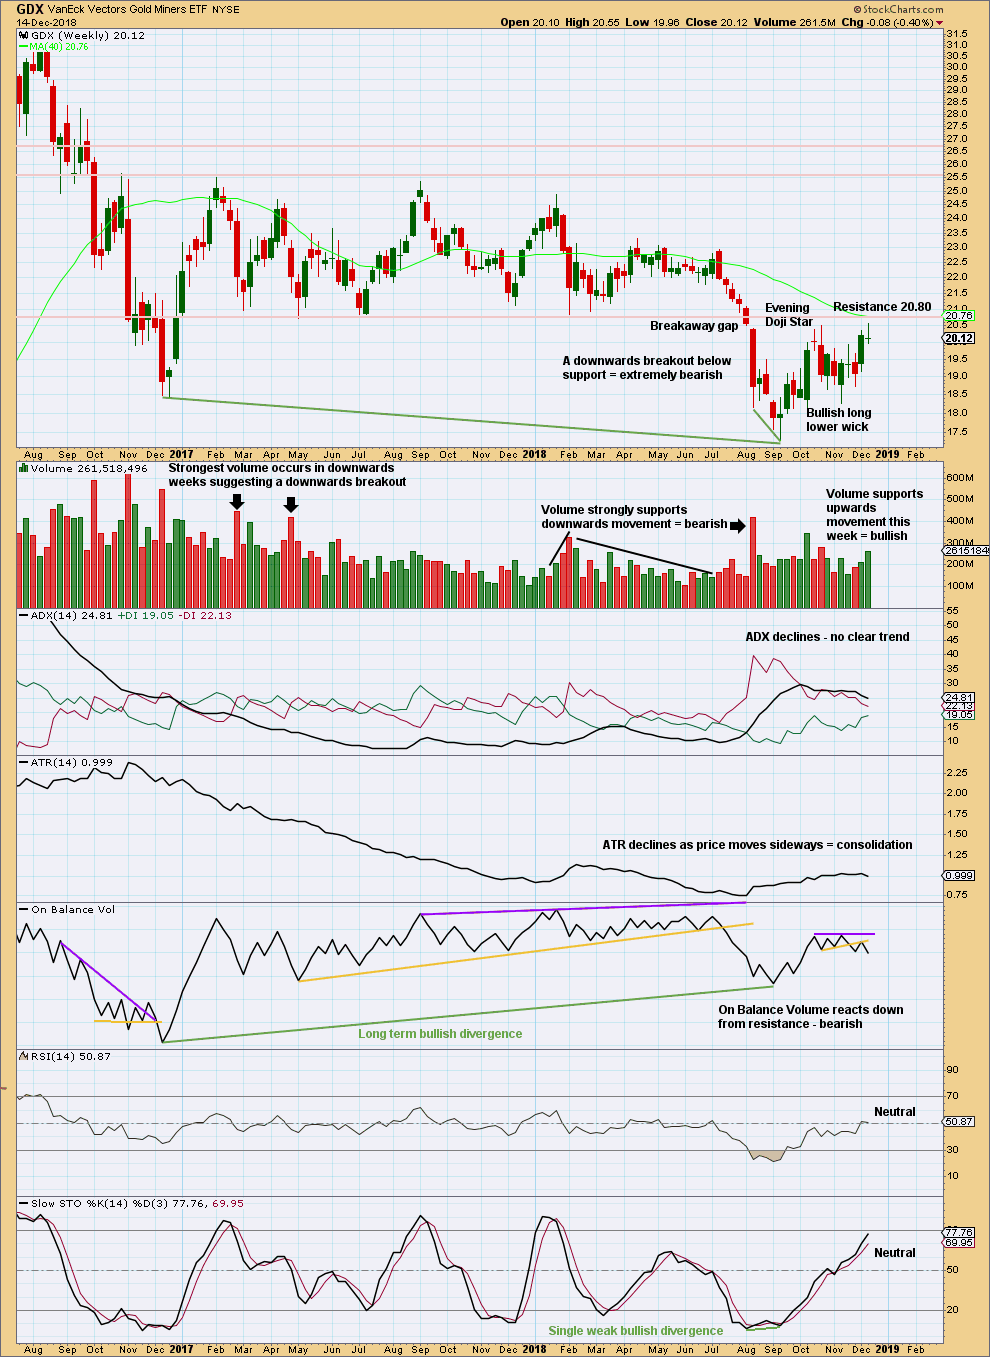
Click chart to enlarge. Chart courtesy of StockCharts.com.
GDX had a large consolidation that lasted from January 2017 to August 2018. A downwards breakout below support at 20.80 in early August 2018 is highly significant. The breakout had support from volume, which adds confidence.
The breakaway gap has its low at 20.51. This gap is closed, but the target for the resulting movement following the long consolidation remains. The current bounce may still find strong resistance about 20.80.
The target is at 16.02.
GDX DAILY CHART
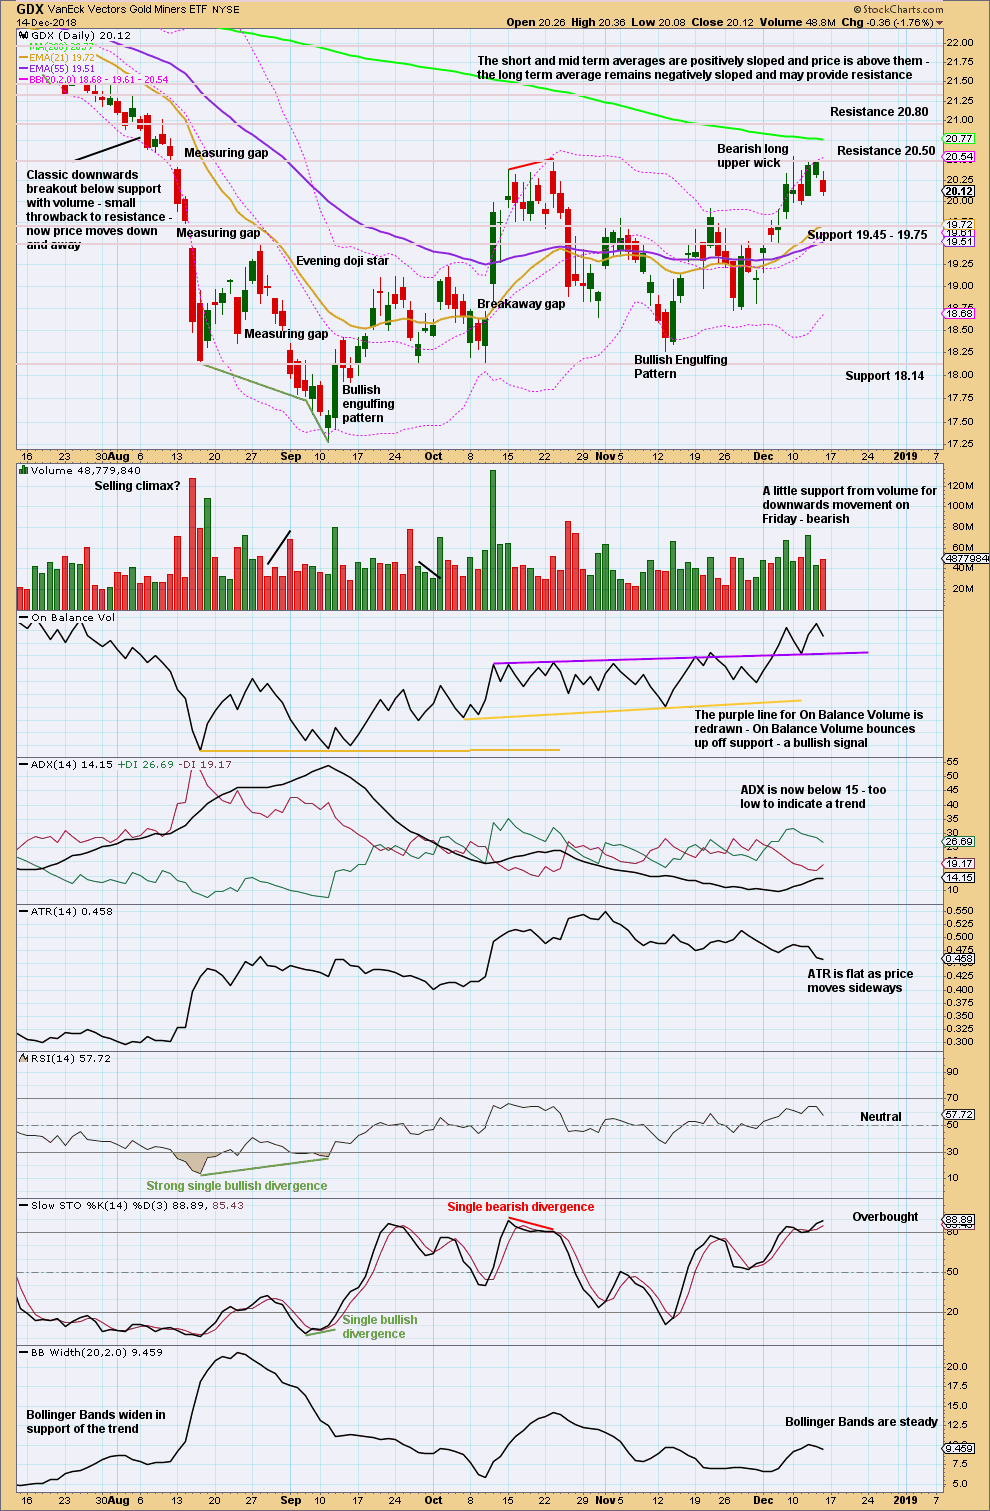
Click chart to enlarge. Chart courtesy of StockCharts.com.
Strong resistance still remains above about 20.50 and 20.80. It again looks like a high may be in place for GDX.
US OIL
A correction for a second wave on the Elliott wave count was expected to have begun. So far this is starting out with some sideways movement, which still fits the overall expectation.
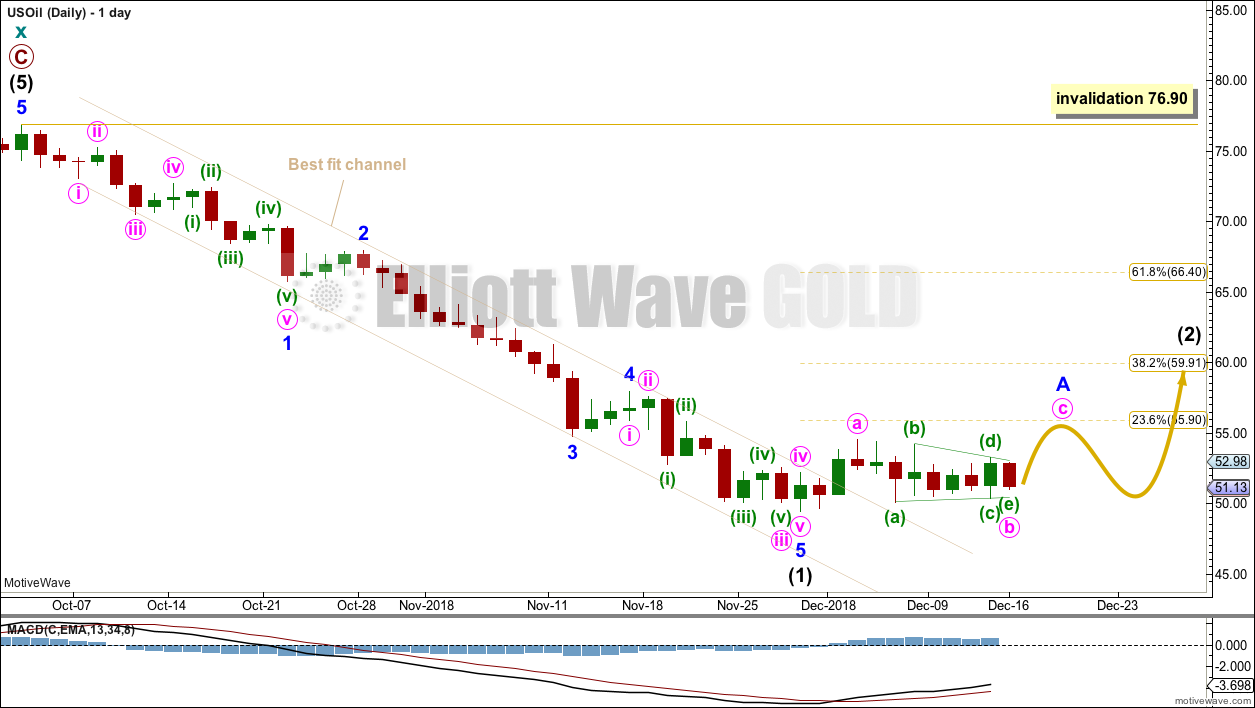
Summary: Intermediate wave (2) may last about 5 to 13 weeks and may be very deep indeed. The first target will be the 0.618 Fibonacci ratio at 66.40, but this may not be high enough.
It is also possible that intermediate wave (2) could be a relatively shallow sideways consolidation. The labelling within it on the daily chart may change as it unfolds. Focus will be on identifying when it could be complete. This week it is only in its early stages; a complete structure cannot yet be seen.
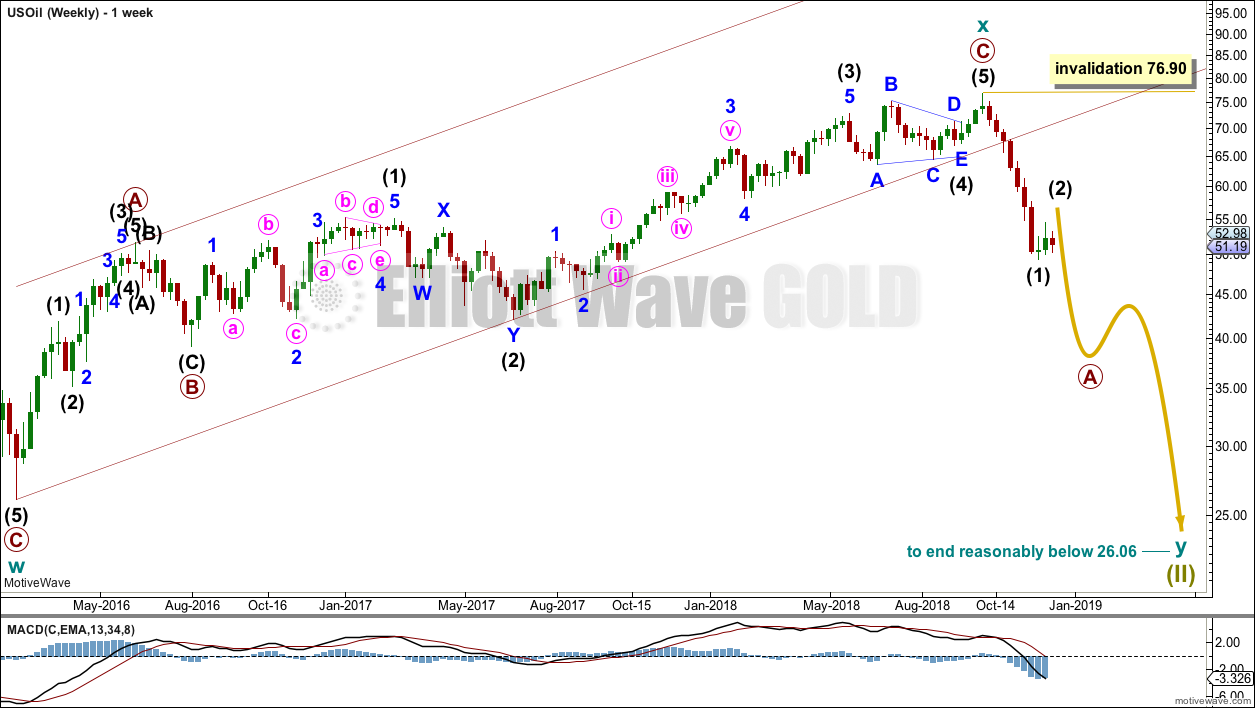
The larger picture still sees Oil in a new downwards trend to end reasonably below 26.06.
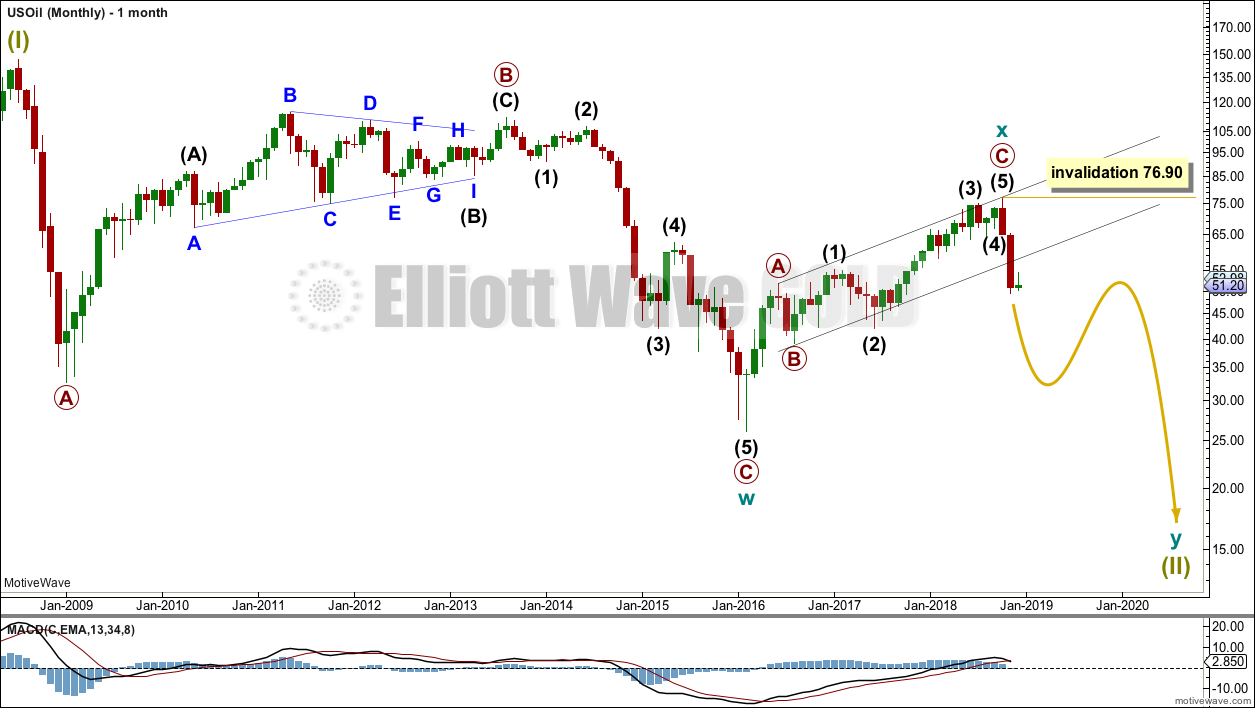
MAIN ELLIOTT WAVE COUNT
MONTHLY CHART
Click chart to enlarge.
Classic technical analysis favours a bearish wave count for Oil at this time.
The large fall in price from the high in June 2008 to February 2016 is seen as a complete three wave structure. This large zigzag may have been only the first zigzag in a deeper double zigzag.
The first zigzag down is labelled cycle wave w. The double is joined by a now complete three in the opposite direction, a zigzag labelled cycle wave x.
The purpose of a second zigzag in a double is to deepen the correction when the first zigzag does not move price deep enough. Cycle wave y would be expected to move reasonably below the end of cycle wave w to deepen the correction. Were cycle wave y to reach equality with cycle wave w that takes Oil into negative price territory, which is not possible. Cycle wave y would reach 0.618 the length of cycle wave w at $2.33.
A better target calculation would be using the Fibonacci ratios between primary waves A and C within cycle wave y. This cannot be done until both primary waves A and B are complete.
Within cycle wave y, no second wave correction nor B wave may move beyond its start above 76.90.
WEEKLY CHART
Click chart to enlarge.
Cycle wave x is seen as a complete zigzag. Within the zigzag, primary wave C is a five wave impulse and within it intermediate wave 4 is a triangle.
A new low below 51.67 has added confidence in this bearish wave count. At that stage, the bullish alternate was invalidated.
Cycle wave y is expected to subdivide as a zigzag. A zigzag subdivides 5-3-5. Primary wave A must subdivide as a five wave structure if this wave count is correct.
Within primary wave A, intermediate wave (1) may now be complete. Intermediate wave (2) may be very deep, or it could be a sideways consolidation.
DAILY CHART
Click chart to enlarge.
The narrow best fit channel about intermediate wave (1) was clearly breached on the 4th of December. At that stage, this analysis expected that intermediate wave (1) should be over and intermediate wave (2) should be underway.
Intermediate wave (2) may subdivide as any corrective structure except a triangle. It would most likely be a zigzag (zigzags are the most common corrective structures). It is impossible to tell which structure it may be at the start, and as it unfolds labelling within it will change.
Intermediate wave (1) lasted 7 weeks. Intermediate wave (2) may be expected to have reasonable proportion to intermediate wave (1), so that the wave count has the right look. Intermediate wave (2) may last a Fibonacci 5, 8 or even 13 weeks if it is a more time consuming correction like a combination.
Intermediate wave (2) may not move beyond the start of intermediate wave (1) above 76.90.
For Oil the first large second wave correction within a new trend can be extremely deep. This does not always happen, but it is a fairly common tendency; we should be aware of this possibility here.
It is also possible that intermediate wave (2) may not be deep; it could also be a shallow sideways consolidation. At this stage, it is incomplete, and it is still impossible to tell with any confidence what structure it may be.
TECHNICAL ANALYSIS
MONTHLY CHART
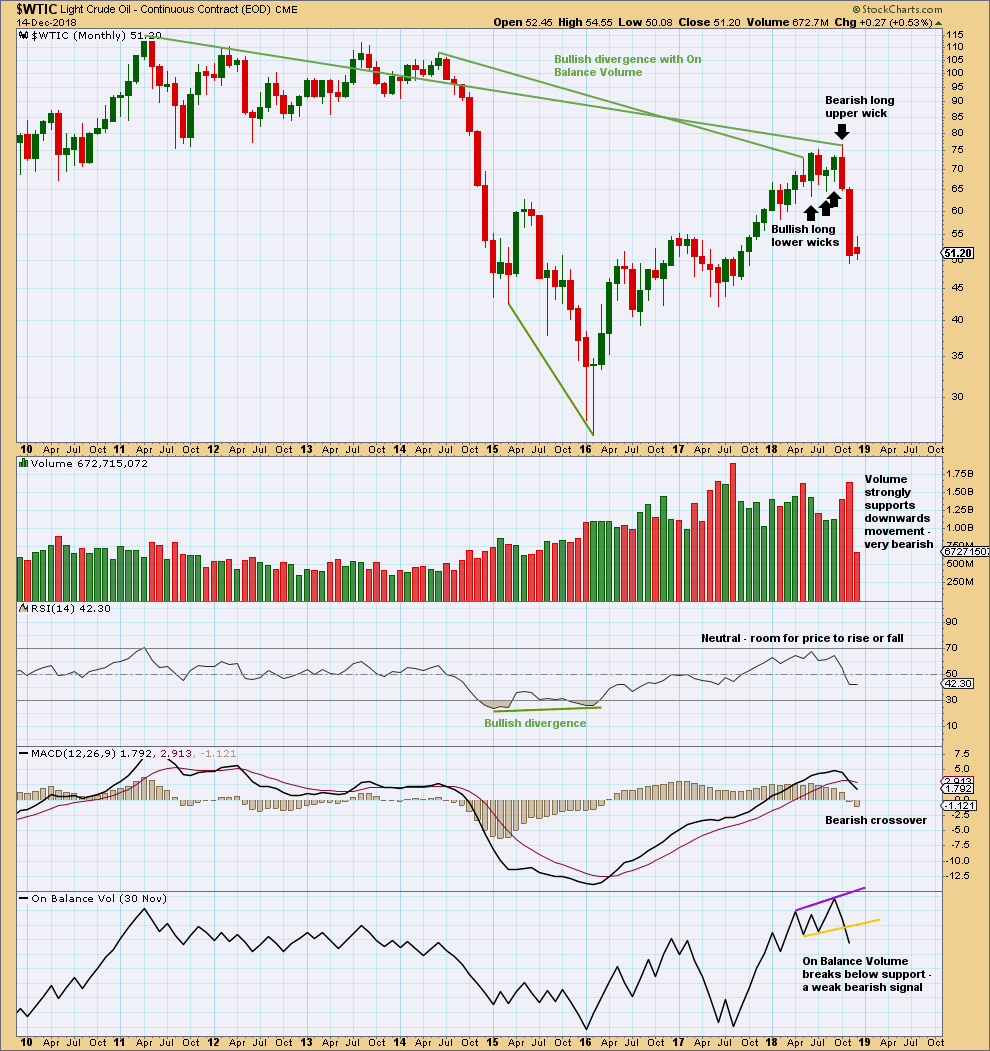
Click chart to enlarge. Chart courtesy of StockCharts.com.
The month of November has a very small lower wick. This is still fairly bearish.
The signal from On Balance Volume is weak because the trend line breached had only two anchor points and a reasonable slope. But it is still a bearish signal.
WEEKLY CHART
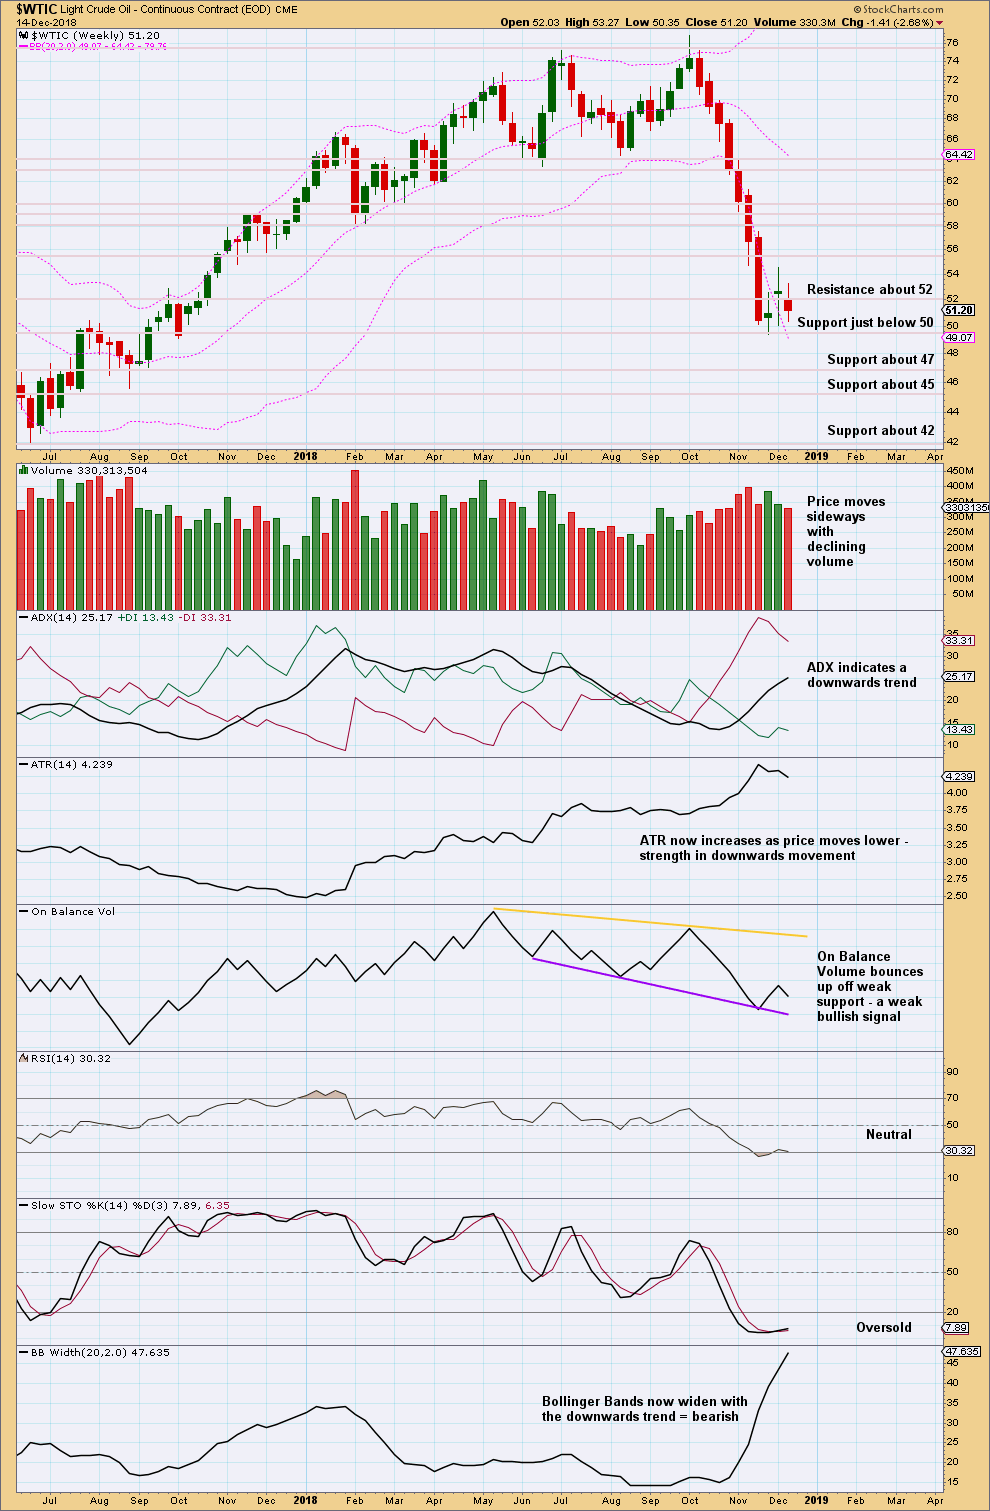
Click chart to enlarge. Chart courtesy of StockCharts.com.
The last three weekly candlesticks look like a consolidation within an ongoing downwards trend.
DAILY CHART
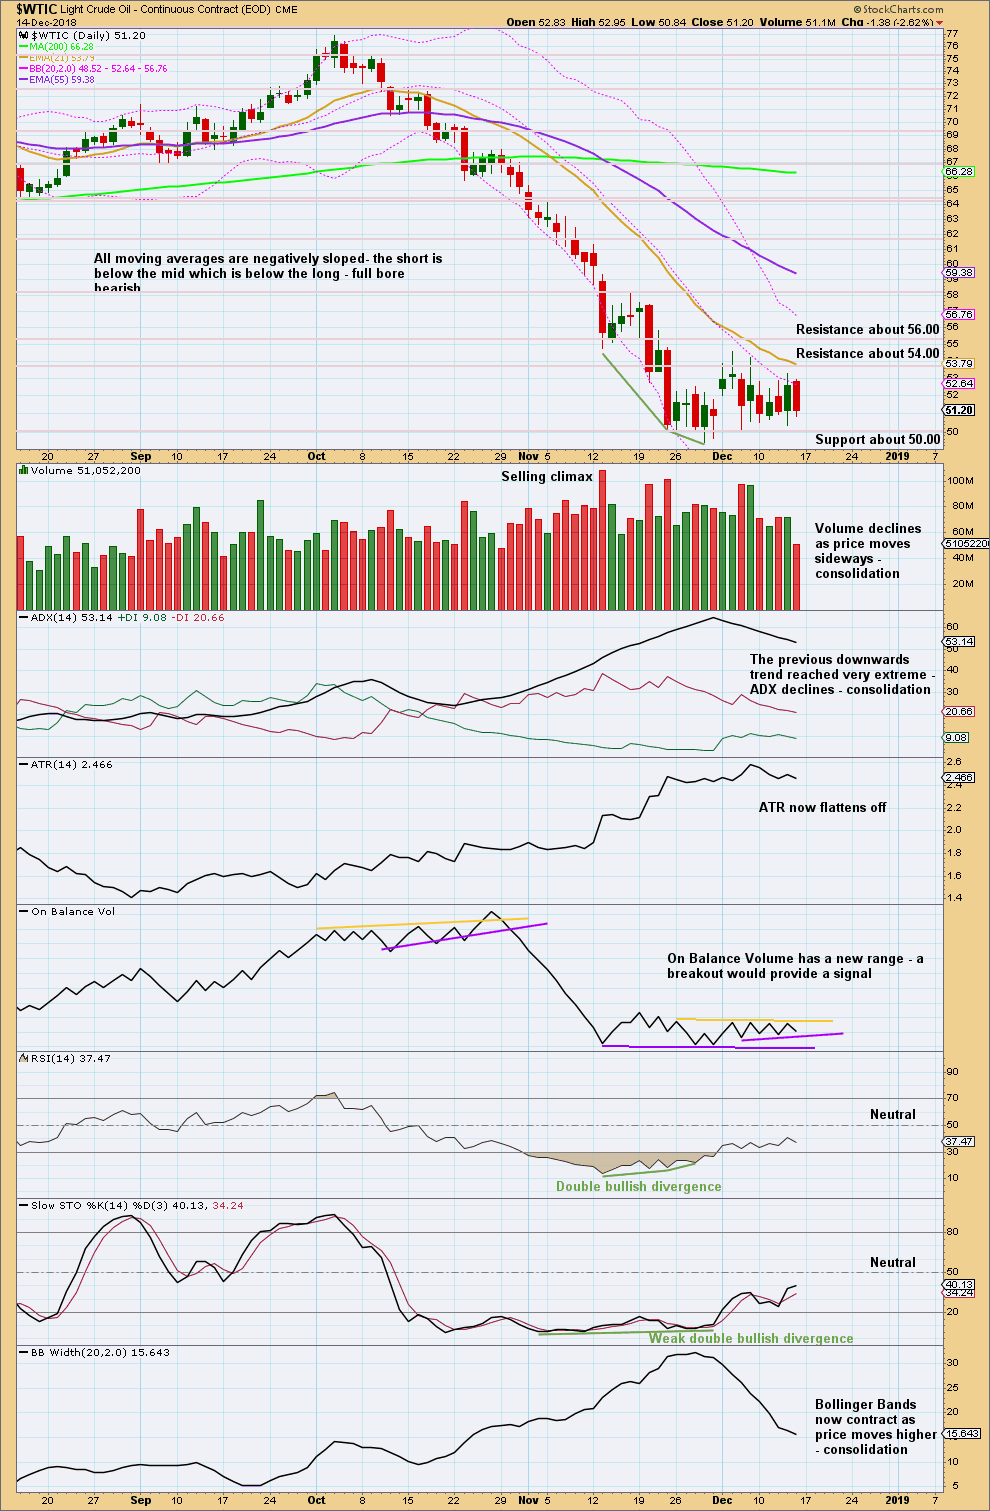
Click chart to enlarge. Chart courtesy of StockCharts.com.
This consolidation may have only just begun. At this stage, resistance may be about 56 and support about 50.
—
Always practice good risk management as the most important aspect of trading. Always trade with stops and invest only 1-5% of equity on any one trade. Failure to manage risk is the most common mistake new traders make.
Updated daily chart for the S&P500:
No Elliott wave target, but the next area of support below is about 2,400.
I’m updating the channel on the monthly and weekly charts too. But this new best fit channel is not working so well either.
The S&P can form rounded tops. When it does that it will breach a long held channel, only to then go on to make new highs, sometimes hugging the lower edge of the prior channel. Sadly it does not always work nicely with channels.
I’ve also just completed a thorough analysis of lows in the last most recent bear market from October 2007 to March 2009. That will be in the next end of week analysis for you.
My quick conclusion is that at lows there is a bullish candlestick reversal pattern and / or clear and strong divergence between price and RSI.
Lows can end with high volume. They can come quite quickly after a bearish signal from On Balance Volume.
And so I will be looking for a bullish candlestick reversal pattern, and clear and strong divergence between price and RSI before a low may be again considered.
Next support 2,400.
Update for the S&P500:
I’m now switching to the alternate wave count.
Volume strongly supports downwards movement. Bounces have been short lived and shallow.
Expect more downwards movement at least short term.
If the target is wrong it may not be low enough. When minor 4 is complete then I can calculate a target at minor degree. That may be able to be done in the next one to three sessions. At that stage the target will probably change.
At this time I can only calculate the target at intermediate degree. The next Fibonacci ratio of 1.618 would give a target which looks too low, so I’m still using the ratio of equality between intermediate waves (A) and (C).
If anyone has any questions about this please ask below.
Although there is still downwards pressure and this fall in price is not yet done, I still do not think this is a new huge bear market. Nor do Lowry’s.
This is still expected to be a big pullback within an ongoing bull market, and I expect it is the last one.
Hi Lara,
Thanks for your timely updates. they really help!
All want to be optimistic but classic Dow theory which you are referring to suggests we are in a bear market already…. moreover, take a look at the waves structure down it looks we are in 3rd wave down which looks very much like an impulse wave…. If you see it differently at short time frames on other indices pls share with us to confirm that this is just a correction which ends very soon…. we breached the teal channel and have not moved back in it…. To me stakes are very high that we are in a bear market…. If not classic Dow theory and its levels which were breached I would not be that pessimistic…. so, it is time to consider all the downside alternatives ☝️🤷🏼♂️ The Fed Reserve killed this bull market once again and all the bulls final hopes. They are always behind the market🤷🏼♂️🤷🏼♂️🤷🏼♂️
Merry Christmas and Happy New Year!! Hope it will be at least if not bullish but profitable☝️👍👏
A spattering of descending wedges starting to appear (some are more convincing than others and may not play out as wedges)
may not be zoomable – this is the SP500, SPGlobal1200, XJO,DAX,HSI,DJI
At the last all time high there was no divergence between price and Lowry’s Operating Companies Only AD line. Nor was there any expansion in supply prior to the last all time high.
“every major market top over our 93 year history of
bull and bear markets has been preceded by a sustained
uptrend in Selling Pressure”
This has not happened at the last high.
Dow Theory, on its own, is not enough for me to call for a final end to this bull market.
This last pullback of primary wave 4 may indeed be a small bear market, at 2,353.28 price would have dropped 20% of market value meeting the definition for a bear market. That is possible for primary wave 4, although that would be larger than expected.
Note also that during cycle wave IV which I have ending in February 2016, Dow Theory also signalled a bear market. Yet price did not drop 20% of market value and the bull market eventually continued.
We need to weigh up multiple pieces of evidence and take it all into account.
Thanks Lara! If you are still hoping it is a correction then look at oil and where it should drop… you can imagine it going down to abyss and SP going to new highs? You are waiting for oil multi-week correction up and then collapse and SP going to new highs? Maybe it is time to make kind of cross-analysis to get better understanding what is going on with the markets? Otherwise, we can get to a new bottom for the market after each new one😩😩😩…. right now SP is going down straight without any corrections which reminds 3rd wave impulse very much…. and the whole movement from the top looks more like big impulse wave…. it is getting hard to imagine we can get new highs especially in short period of time…. so, probably other bearish wave count is in place?? Moreover, look at gold – why should it go down? Only one reason for it – the rise of dxy☝️☝️ If it goes higher gold will collapse as in triangle…. do you think that markets will rally with rising DXY??? No… the markets will be in panic mode pushing overbought DXY even higher… and we are not there yet…. So, probably, big panic will be ahead for the markets…. it bodes well for your oil wave count… so, many reason to forsee pretty bearish scenario for the market and no new highs especially in nearest cuture….. oil and gold does not leave any hope for SP🤷🏼♂️🤷🏼♂️🤷🏼♂️
Your comment assumes a relationship between Oil and the S&P500, and between Gold and the S&P500.
I do hope by now that you may anticipate my answer to that assumption.
I don’t like to make assumptions. I like to base my analysis on solid data. Which luckily, we have in abundance.
The correlation co-efficient shows that neither Oil nor Gold have any reliable relationship whatsoever to the S&P500.
There are a great many unacknowledged assumptions and myths floating about in market analysis. I aim to try and step back from the noise and focus on data.
Next time you consider a relationship between markets, look first at the correlation co-efficient. StockCharts have this tool. Under “indicators” on your chart, choose “correlation” then choose the market you want to see the co-efficient for.
Lara, my point is that these markets do not live on its own and some periods of time they correlate positively or negatively and move together and tell something about each other…. your oil wave count is utterly bearish …. it can not stop falling… you are wating for a couple of weeks correction … me too, but within a month or so…. I also do not expect any corrections in SP until 3rd down finishes somewhere at 2250-2300 then there will be 4th up pretty short and after SP will go down and collapse to 2100 region with oil gold and everything else and market panic against USD/dxy…. only after that there will be a relief B wave against falling DXY….unfortunately it is getting more and more obvious with the speed of the decline that we are not in 4th wave anymore….glad if it is not the case but other markets like gold and oil fortell the biggest drop in SP is still ahead☝️🤷🏼♂️ Or you will be hoping for new highs in SP with oil and gold crashing down???… not anymore…. look at 2008…oil and gold and SP went together down against Usd….miracles happen of course but not this time…..🤷🏼♂️🤷🏼♂️🤷🏼♂️ Or there is something wrong with oil and gold wave counts…. Which I think now your are right about….☝️🤷🏼♂️ But if gdx takes 22 region and goes up and gold higher through 1370 from here then probably your SP main wave count is right and we will see new highs for SP….but, the way stock market crashes does not leave any hopes for new highs…..🤷🏼♂️🤷🏼♂️🤷🏼♂️😩😩😩
Hi Laura, no sign of a wave 4 rally & just a drop to 2461 SPX so far. Any updated thoughts?
Hi Laura, Todays SPX low appears to have the potential for an ABC low where A=C. If not, this could still be wave 3 down where wave 5 could move down towards 2400 or lower (depending on where w3 & w4 end up of course).
Your thoughts?
New chart above.
Hi Lara,
This correction for the S&P 500 looks now again like August 2007 but at a slightly bigger scale…. See attached…
We might see a snap back really soon if it is the case….
For Today’s selloff , it looked complete for the wave that started yesterday…
It might be the bottom…
Merry Christmas, Lara… All the best to you and your family.
Mathieu (From Canada)
Merry Christmas to you too Mathieu.
I don’t think the low is in quite yet. It may be close, but not yet.
There is no bullish signal anymore, and volume is pushing price lower.
I’m waiting now for a bullish candlestick reversal pattern or a clear strong instance of divergence between price and RSI. Preferably both.
Next support 2,400.
Hello Lara,
Just thinking aloud here… From a psychological point of view, I would say that the entire year 2018 “felt” like in correction mode (fear, volatility etc.). I know that what I am proposing could be too out there, but would it be too crazy to think that maybe all of 2018 has been nothing but a giant WXY correcting the entire Trump rally? As I said, just a late-night thought… 🙂
Thanks for your comments.
Fady
At first glance that’s a very interesting wave count.
But… Elliott wave is fractal.
If we are currently seeing a W-X-Y correction after a completed five up, then I could move the degree of labelling within cycle V all down one degree, then I’d have to label your W-X-Y as a second wave.
And a second wave is followed by… a third wave. Up.
Possible. In the sense that anything is possible. But, highly unlikely.
I will chart it, and I will keep it as an outside idea, because I am open to all possibilities and need to follow many.
A quick update for Gold:
I’m discarding the weekly flat wave count now based upon an exceptionally low probability.
Here is the preferred wave count, the triangle. Daily chart. A slight adjustment to how I’m labelling minor wave 3, I’ve increased the degree of the last wave up. The invalidation point is moved to the high of minute i within minor 3. Minor 3 is an impulse, within it minute iv may not move into minute i price territory.
The reason for this update is to warn you that it is possible (not certain) that minute v may end with strength. Commodities typically have swift strong fifth waves, and this tendency is especially prevalent for their fifth waves which end a third wave impulse one degree higher.
So look out for a possible small blow off top, possibly a Christmas gift.
Update for US Oil:
Despite the channel breach, price has turned and moved lower. This last session is now closed and volume data shows it has good support.
This trend remains very extreme, bullish divergence between price and RSI remains. It will end and there will be a multi week bounce, but not quite yet.
A new target is calculated.
However, the best way to use this chart is with the channel. Assume the downwards trend remains intact, until the channel is breached by upwards (not sideways) movement. Be alert to a multi week bounce, but only have confidence it’s begun when the channel is breached.
This channel is not quite as steep as the last one, it’s longer held and so has slightly better technical significance.
Lara, Thanks for this USOIL analysis, and thanks for your continuing hard work. Merry Christmas and Happy New Year!
Thank you very much William. A very Merry Christmas to you too!
Thank you Lara where would I be without you I have learned so much thanks to you. God bless and thank you for the oil update.
Thanks mytradeca. It gives me confidence in my work to know I’m teaching you Elliott wave. That’s one of my big goals for members.
Updated daily count for US Oil:
At this stage it would look better for intermediate (2) if it lasted longer. That would have better proportion with the wave it is correcting, intermediate (1).
Intermediate (2) may be unfolding as an expanded flat correction. Expanded flats have B waves which are 1.05 X their A waves.
However, there should be something rather weak about B waves. So far StockCharts shows a little support from volume for the last completed downwards day. There is also a weak bearish signal from On Balance Volume.
I would want to see a candlestick reversal pattern, or at least a long lower wick, and weaker volume, before I expected minor B could be complete.
There is no Elliott wave rule stating a limit to B waves within flats, but there is a convention that states when the potential B wave is longer than twice the length of the A wave the idea of a flat should be discarded based upon a very low probability. For this count that price point would be at 44.25.
With the larger trend downwards there is a danger here that intermediate (2) could be more brief and shallow than expected. But to see it as over already, would give an extremely strange Elliott wave count.
I’ll take a look at StockCharts data for the next session when it’s complete.
Notice to all Lara’s Weekly members:
I’ve just sent an email but I’ll leave this here as there are always a few people who don’t get my emails.
I’ve decided to not take a full holiday this year. I don’t feel okay leaving you all without analysis for two weeks, especially as I’m hoping Gold may complete a cycle degree B wave during that time and the S&P is currently at an important juncture.
I’ll check markets each day after the New York session closes and update any of the three markets followed here with a chart in the comments section if the situation changes.
If the main wave count changes or I otherwise deem it necessary, I’ll update any one or more of Gold, S&P500, US Oil or Silver with a new post which you’ll have access to.
I’ll do your usual end of week video this weekend, and next video will be an update on Sunday 6th January 2019 in preparation for that new week.
I will have a reduced workload and so can have some rest. This will allow me a partial holiday which is good enough for me.
Thank you all.
Laura, Thanks for all your hard work during these hectic times!
You’re most welcome Richard.
I’m really looking forward to an end to this B wave for Gold. It’s so close!
Dear Lara,
I feel I would be speaking for many of us if I said how much your gesture is appreciated, especially knowing how high your workload must be at this time!!! When I got your mail I felt like screaming “no, don’t leave us now!” 🙂 even though I could understand. Anyhow, thanks so much Lara, also for being so professional and staying so close!
Fady
Two thumbs up!!!!!
You’re all very welcome.
Approaching the holiday period I’m looking at my charts, and I just can’t leave you all hanging with what the markets are doing right now.
It just felt all kinds of wrong.
As long as I can get lots of waves, I’ll be relaxed and happy. I’m planning on getting up to Ahipara, NZ’s longest left hand point break.
Lara
I assume its safe to say the main Elliott wave count has been invalidated
Rich
For the S&P? Yes. I’m going to use the second alternate as a main count today.
Is there an invalidation value at this point for this wave count?
Rich
Yes. 2,111.05, which is too low to be of much use.
Primary 4 may not move into primary 1 price territory.
Hi Lara,
Today’s price action for USOIL moved below the recent low at the end of Intermediate (1). Taking this at face value it invalidates the present count for Intermediate (2). Your thoughts on this are appreciated.
Not at all. Intermediate (2) has started out with what looks very much like a three wave movement, and so this may be an expanded flat correction.
Expanded flats are very common.
I will update US Oil with a chart later today, right now I’m onto the S&P then Gold. Please check comments later this evening EST.
Members are asking for a bearish count for the S&P.
The biggest reason why I do not have one is Lowry’s. I have explained this in the text above and in the video under the AD line.
From an Elliott wave POV a bearish wave count at this time has a really big problem of proportion. For a high to be in place both intermediate (4) and primary 4 would have to be over. The problem is where to see intermediate (4). This is the best place I can see for it, and it would last only 4 weeks. That is grossly disproportionate to intermediate (2).
This is what a bearish wave count would look like. And there would be less than 1 month bearish divergence between price and the AD line at the end of the bull market. That would be the first time in almost 100 years. I do not like those odds.
Now, I am not saying this is not possible. Of course it is. But many things are possible, however unlikely.
I am not prepared to publish this within my analysis due to giving it a judgement of an exceptionally low probability. I only provide it here to show you what it would look like, and so that you all know I am keeping it in mind and have considered it carefully.
Lara hi
Where is blue 4 and 5 for you first alternative for SP? I see only 123 on your chart with target of the whole wave to 2478??? If its impulse it should go much lower then? Can not find 4 and 5 there?
I have set Motive Wave to show only the end of the current wave label.
If I set it to show all unmet labels then the chart is filled with lots of floating labels between current price and the last label.
You’ve asked questions like this before, and my answer is essentially the same. Just because all the labels aren’t shown on the chart does not mean I think there won’t be a normal Elliott wave unfolding.
Sorry,
But you mentioned that GDX topped? Any candles proving that? You think that gold is going higher, many big gold stocks are very bullish on their charts …at what levels will you change from bearish to bullish in GDX??? It is really weird to expect gdx to go down( and to go short) from here if gold is going up in impulse to 1300 or even higher….🤷🏼♂️🤷🏼♂️🤷🏼♂️
I would tend to agree if Gold is headed up towards 1300. If that happens, my GDX target is $22.
Draw $XAU:$SPX on a long term basis…. The trend line is strongly downward…
Gold stocks are about to get smacked….
This is another head fake like the other 100s that we got in the past 7 years…
I believe that Lara is correct here… Go to iGold on youtube… He is bearish as well…
Good luck… I am not there until that downtrend is broken….
Here is a chart of the $XAU:$SPX showing a potential breakout today.
Hey Richard,
I am drawing it from 2011… Here it is…
Basically, tomorrow’s news with the Fed will decide this…. 🙂
I forgot to say as well…. It is extremely important that this breakout in Gold is with a ton,… I mean a ton of volume….
If Gold is going to break to the upside, it needs a massive volume spike to confirm the breakout…
This is why I believe it won’t happen… I am expecting a massive reversal for the S&P 500 to the upside and Gold stocks to go down….
I am just following the long term trend….
Gold around 1250 and Gdx is 21,5 already…. maybe, 22 is too low target??? Anyway, it broke all the resistances which Lara mentioned to open shorts from…..🤷🏼♂️🤷🏼♂️🤷🏼♂️ Lara, any new wave counts and analysis fro gdx? Is it bullish finally? I do not think so actually but it was great to see new levels up where it may go …it looks like we are back in the channel that gdx broke in the summer thanks!!!
” Any candles proving that?”
Of course not.
You’re asking me for proof? No one can prove a high or low in any market until well after the fact.
My reasoning is on the chart.
And you are assuming that GDX and Gold have a positive correlation. The recent history of the correlation coefficient between these two markets shows they absolutely do not always have a positive correlation.
Any two markets which have a correlation coefficient which spends time between 0.5 and -0.5 are not two reliably correlated markets.
I have added the correlation coefficient to the bottom of this chart. Please look at that and then read this article in which I have explained how to use it.
Lara hi,
What about SP drawing head and shoulders pattern with the target to 2100-2200 next year? Why you mention March and October for SP tops? They are very far from each other… What is going to be in between??? Hardly going up..?🤷🏼♂️ … it looks more likely that a top has been in for SP? Death cross is not 100% indicator but very powerful one and market behaves too much volatile…. Many of the indices are already in bear market…even transport that you mentioned…. any wave count alternatives for bear market??
Hi Laura, I also have concerns that the current primary wave 4 is far too short in terms of time and price. The primary wave 4 in 2015 to 2016 took about a year and the wave 4 from the wave 3 top in Feb 2018 took several months before it completed. Your original time projection was much longer so is it still possible that we bounce into a lower high followed by a drop down to the 2200 level on the SPX before Wave 4 completes sometime in the Spring of 2019?
To Richard: The size and duration of primary wave 4 at now 12 weeks and today 357 points is very much in proportion to primary wave 2 which lasted 10 weeks and moved 119 points.
It is in fact already greater in price and time.
What you are comparing to here is cycle wave IV. That’s one degree higher.
Take another look at the weekly chart and fit that into the monthly chart. I think you’re confusing the primary and cycle degrees here. I link back to monthly charts at the top of every analysis.
To Alex: You appear to be insisting that the S&P is in a bear market and you are pointing out bearish pieces of analysis to support your view.
I am trying to take all pieces of analysis into consideration.
I am finding your comments extremely difficult to reply to. You have multiple questions in one comment, and multiple comments. The tone is coming across as somewhat aggressive to me. I do not appreciate this.
My reasoning is given in the analysis, in the charts, and in the video.
Finally, you refer to a H&S pattern on the S&P. It is a comments policy that reference to patterns which normally appear on charts, needs a chart to back up the comment. In future, please provide a chart with your analysis not just text.
Lara,
Have you ever read any of Constance Brown books? I’ve been intrigued with her composite index indicator. After taking the plunge into a few of her books I’m overwhelmed 🙂 I put Glenn Neely’s book down just for this same reason.
Friday’s downward movement reached about 90% of Monday’s low (December 10th). Maybe some backing and filling going into fed on Wednesday. Studying Constance Brown RSI lows in the 40 range is a good thing. Less see if we can get some divergence off that.
I was referring to s&p cash
No I’ve not read any of her books.
If you’re referring to Neely’s “Neo Wave” I put that down too. The best use I found for it was as a rest for my coffee cup.
I really don’t like texts that are unnecessarily complicated.
Hi Laura, the pattern out of Gold’s August low seems to have two possibilities. Currently, it looks like a Bear Flag but it is also possibly a “Horn Bottom” or “Sloping Bottom” which are bullish (see attached chart from a Tweet). Any thoughts or comments?
The best flag patterns are those that complete in 15 days or less. This one is now in it’s 16th week. This is just way way too long lasting to be considered a flag pattern.
Flags are short term continuation patterns.
I’ve not come across a “horn” pattern in the books.