

S&P 500
Two Elliott wave counts are published now for members. The main Elliott wave count has slightly more support from classic technical analysis.
Summary: A low may now be in place. Confidence in this view may be had if price makes a new high above 2,631.09. It it does, then at that stage the target would be 3,045 with a limit at 3,477.39.
The alternate wave count expects one more low before cycle wave IV is complete. Targets are either 2,269 or 2,242, although when intermediate wave (4) may be complete the target would be recalculated.
The biggest picture, Grand Super Cycle analysis, is here.
The monthly chart was last published here.
MAIN ELLIOTT WAVE COUNT
WEEKLY CHART
Click chart to enlarge.
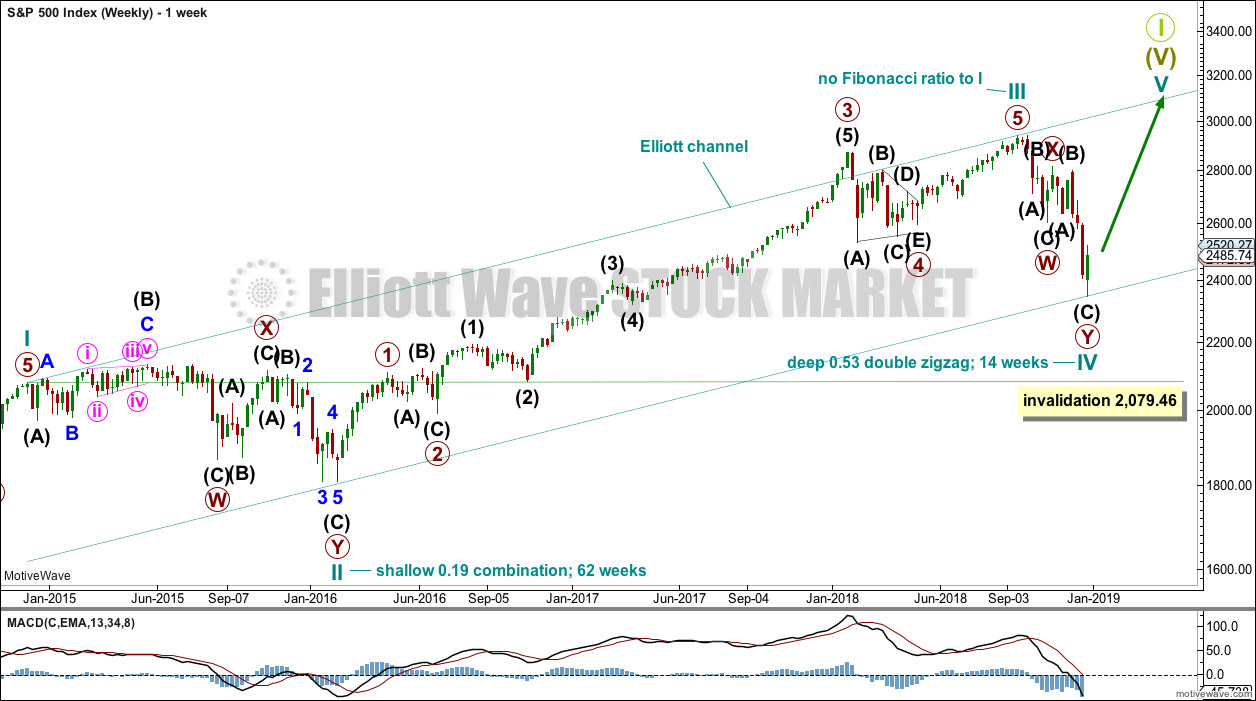
This weekly chart shows all of cycle waves II, III and IV so far.
Cycle wave II fits as a time consuming double combination: flat – X – zigzag. Combinations tend to be more time consuming corrective structures than zigzags. If cycle wave IV completes as a single or multiple zigzag, then it should be expected to be more brief than cycle wave II.
Cycle wave IV may have ended at the lower edge of the Elliott channel. Fourth waves are not always contained within Elliott channels. If the alternate daily wave count below is correct, then cycle wave IV may breach this channel.
Cycle wave IV may not move into cycle wave I price territory below 2,079.46.
Although both cycle waves II and IV are labelled W-X-Y, they are different corrective structures. There are two broad groups of Elliott wave corrective structures: the zigzag family, which are sharp corrections, and all the rest, which are sideways corrections. Multiple zigzags belong to the zigzag family and combinations belong to the sideways family. There is perfect alternation between the possible double zigzag of cycle wave IV and the combination of cycle wave II.
Draw the Elliott channel about Super Cycle wave (V) as shown. Cycle wave V may find resistance about the upper edge.
DAILY CHART
Click chart to enlarge.
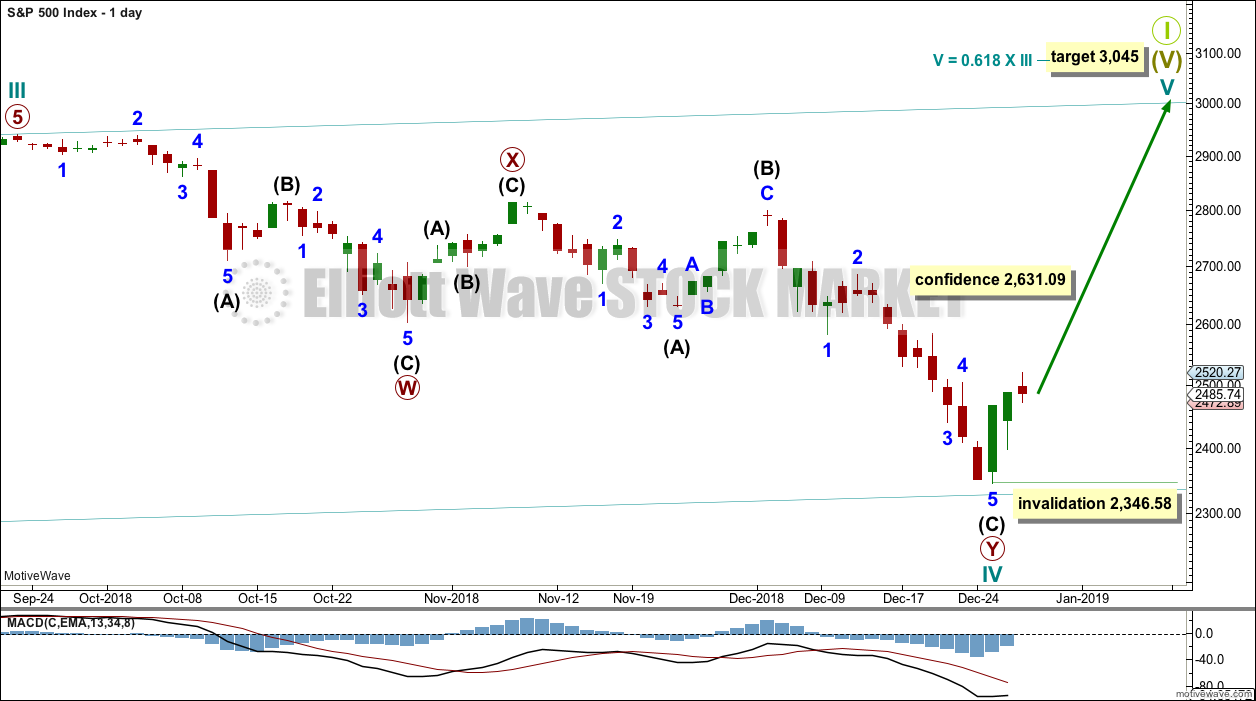
The daily chart will focus on the structure of cycle wave IV.
Cycle wave IV may be a complete double zigzag. This would provide perfect alternation with the combination of cycle wave II. Double zigzags are fairly common corrective structures.
Within Super Cycle wave (V), cycle wave III may not be the shortest actionary wave. Because cycle wave III is shorter than cycle wave I, this limits cycle wave V to no longer than equality in length with cycle wave III at 3,477.39. A target is calculated for cycle wave V to end prior to this point.
Within cycle wave V, no second wave correction may move beyond the start of its first wave below 2,346.58.
At this stage, a new high by any amount at any time frame above 2,631.09 would invalidate the alternate wave count below and provide confidence in this main wave count.
ALTERNATE DAILY CHART
Click chart to enlarge.
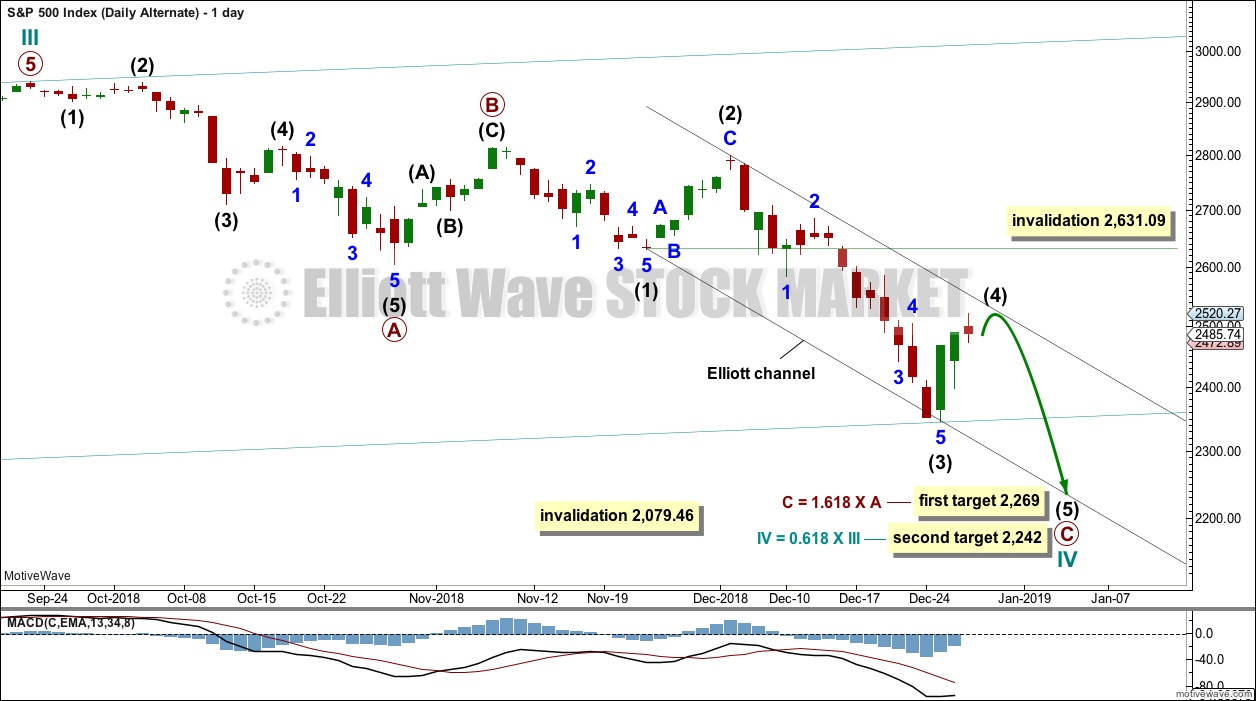
Cycle wave IV may be a an incomplete single zigzag. This would provide perfect alternation with the combination of cycle wave II. Zigzags are the most common corrective structures.
Within this zigzag, primary wave C may be completing as a five wave impulse.
A target is calculated for intermediate wave (3) to end using the most common Fibonacci ratio to intermediate wave (1).
Intermediate wave (2) shows up on the weekly and daily charts. Intermediate wave (4) now also shows on weekly and daily charts. This wave count has the right look.
Intermediate wave (4) may not move into intermediate wave (1) price territory above 2,631.09.
Targets are calculated for cycle wave IV to end. If price gets to the first target and the structure is incomplete, or if price falls through the first target, then the second target may be used.
When intermediate wave (4) may be complete, then the target may be calculated also at intermediate wave degree. The target may change at that stage.
Draw a channel about primary wave C. Draw the first trend line from the low of intermediate wave (1) to the low of intermediate wave (3), then place a parallel copy on the high of intermediate wave (2). Intermediate wave (4) may find resistance about the upper edge of the channel.
TECHNICAL ANALYSIS
WEEKLY CHART
Click chart to enlarge. Chart courtesy of StockCharts.com.
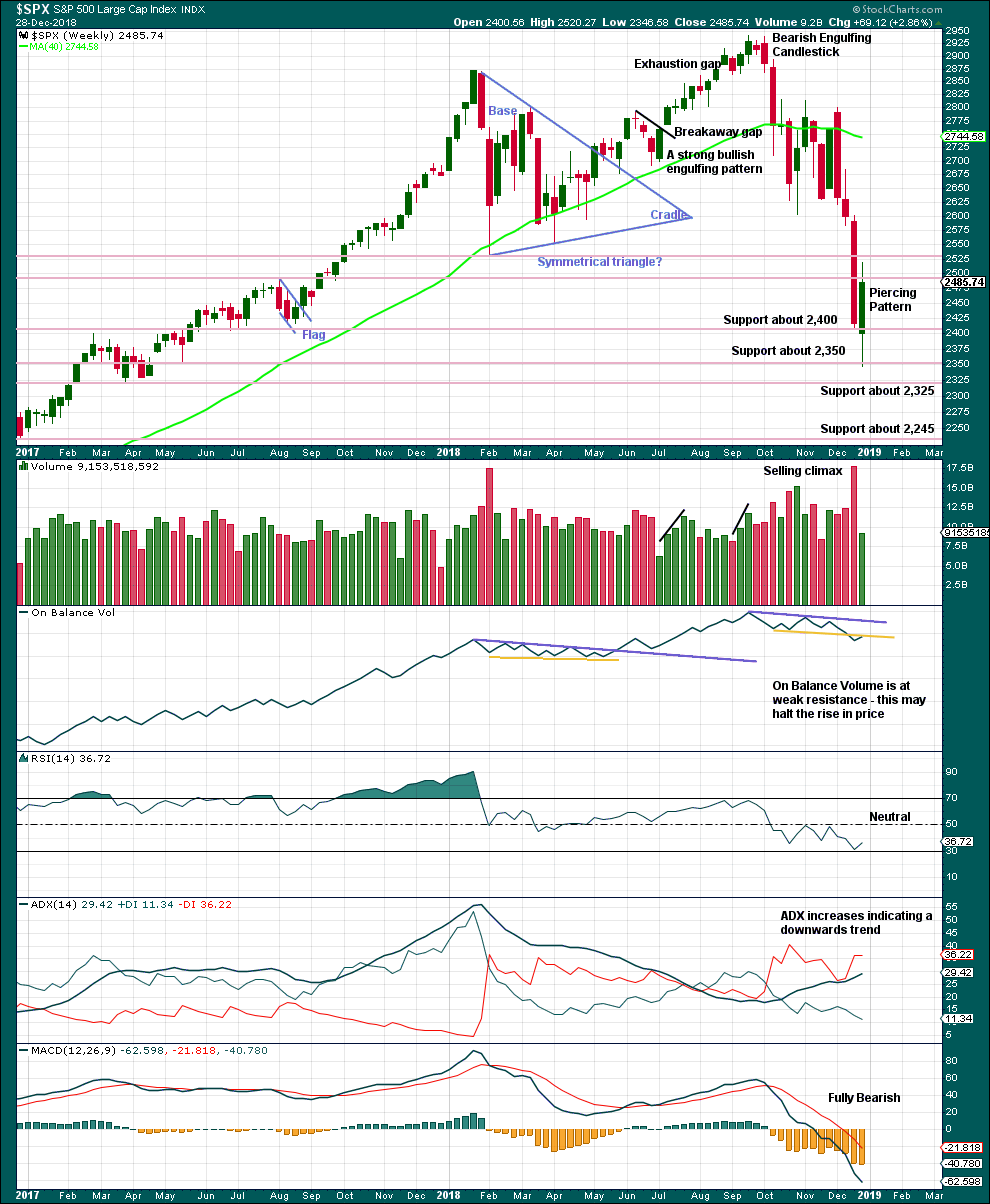
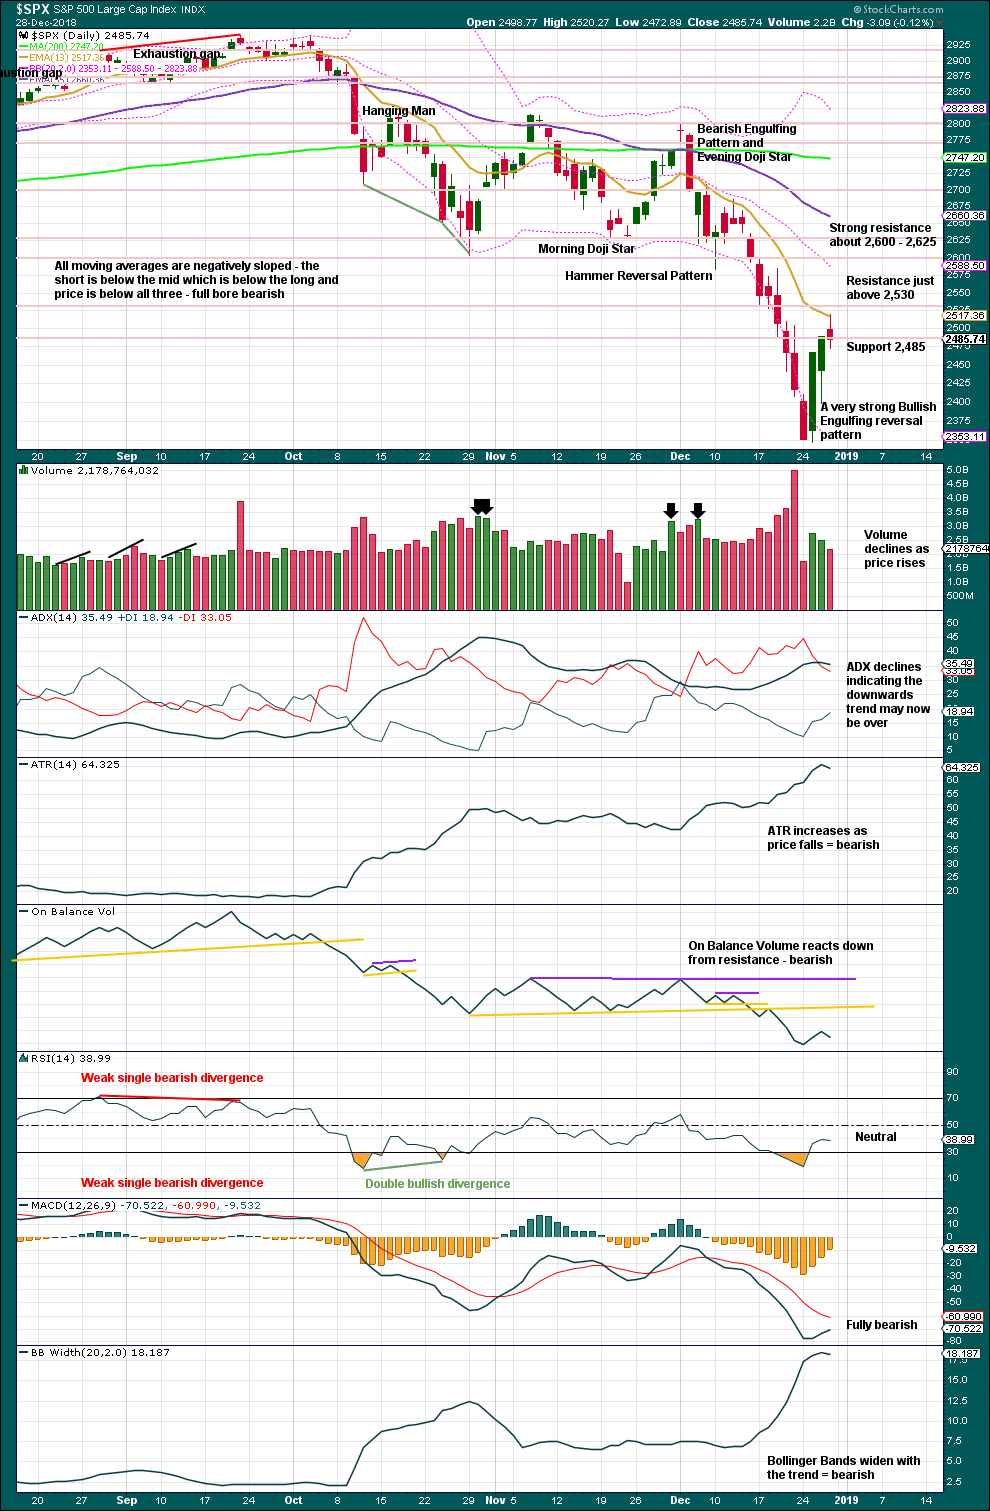
From the all time high to the low of this week, price moved lower by 20.2% of market value meeting the definition for a bear market.
It should be noted that the large fall in price from May 2011 to October 2011 also met this definition of a bear market, yet it was only a very large pullback within a bull market, which so far has lasted nearly 10 years.
This weekly candlestick completes a bullish reversal pattern. The long lower wick is also bullish.
The yellow resistance line on On Balance Volume may be too weak for reasonable technical significance.
DAILY CHART
Click chart to enlarge. Chart courtesy of StockCharts.com.
There is a strong bullish candlestick reversal pattern at the low. The 26th of December completed a 90% upwards day; this is a signal to look for at a low. This supports the main Elliott wave count.
There is some slight concern over weak volume for the last two sessions, but this may be again a feature of this ageing bull market. The short-term volume profile would support the alternate Elliott wave count.
BREADTH – AD LINE
WEEKLY CHART
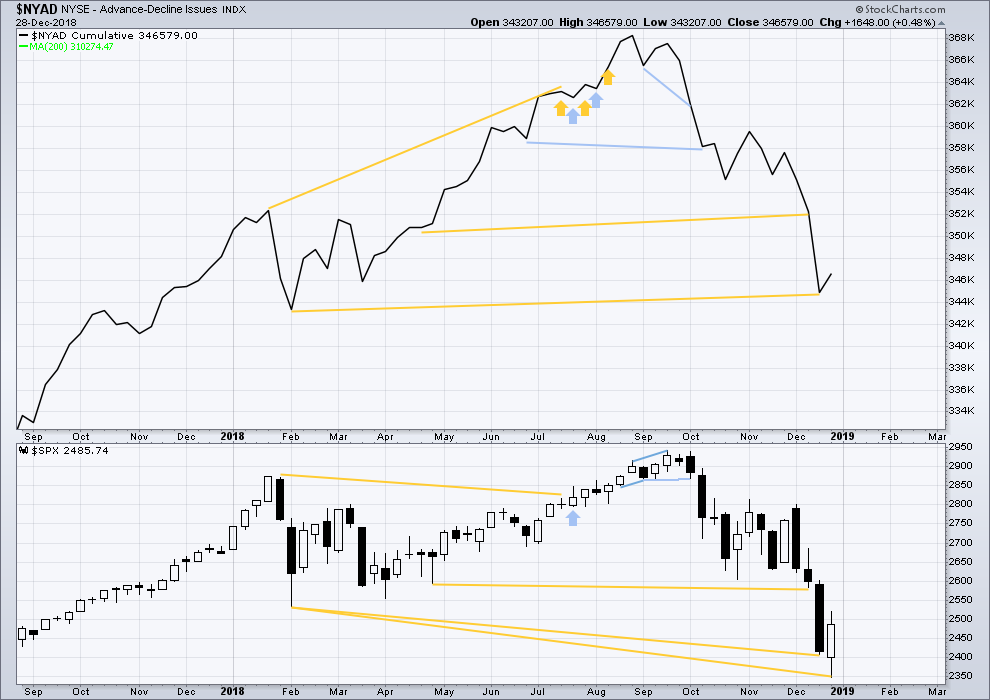
Click chart to enlarge. Chart courtesy of StockCharts.com. So that colour blind members are included, bearish signals
will be noted with blue and bullish signals with yellow.
While price is falling fast, the AD line is not making corresponding new lows. There remains mid-term bullish divergence between price and market breadth.
DAILY CHART
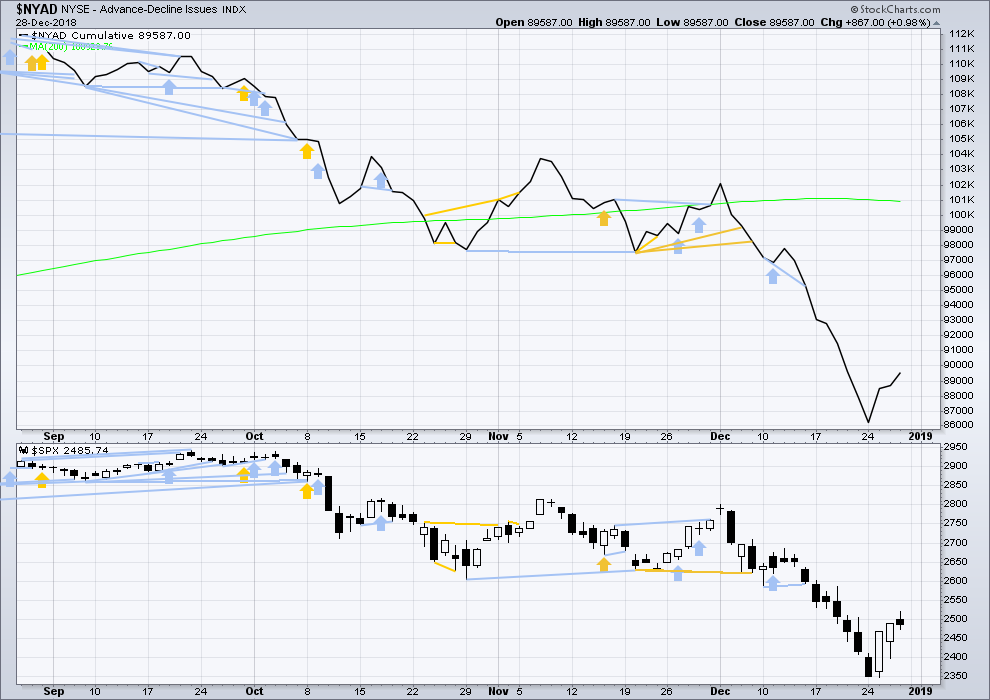
Click chart to enlarge. Chart courtesy of StockCharts.com. So that colour blind members are included, bearish signals
will be noted with blue and bullish signals with yellow.
Breadth should be read as a leading indicator.
For the short term, there is no divergence between price and the AD line.
VOLATILITY – INVERTED VIX CHART
WEEKLY CHART
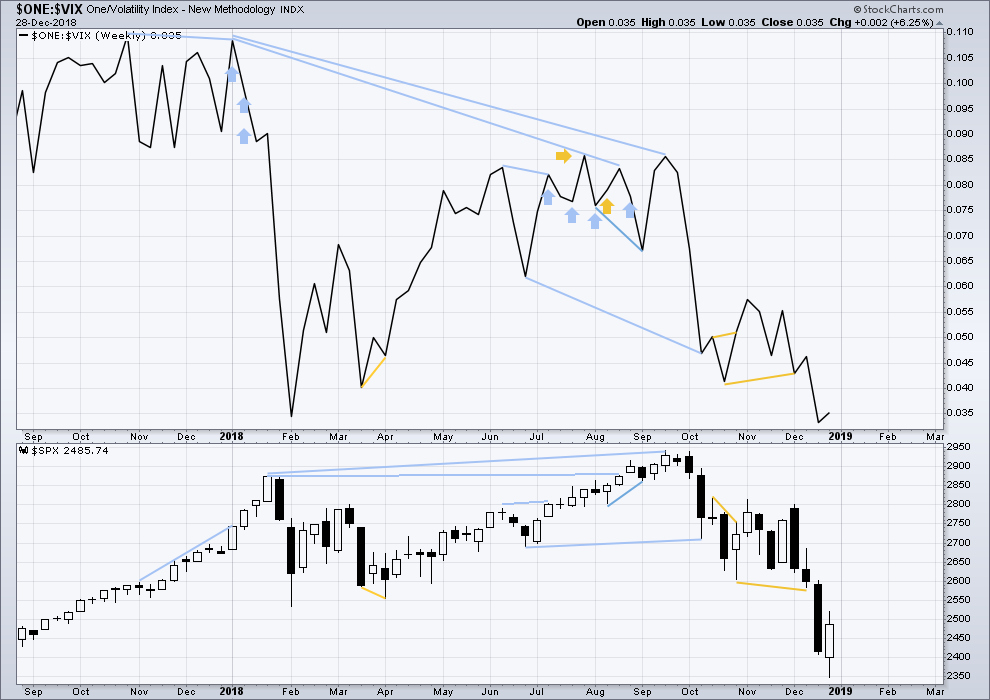
Click chart to enlarge. Chart courtesy of StockCharts.com. So that colour blind members are included, bearish signals
will be noted with blue and bullish signals with yellow.
There is no divergence as both inverted VIX and price make new lows.
DAILY CHART
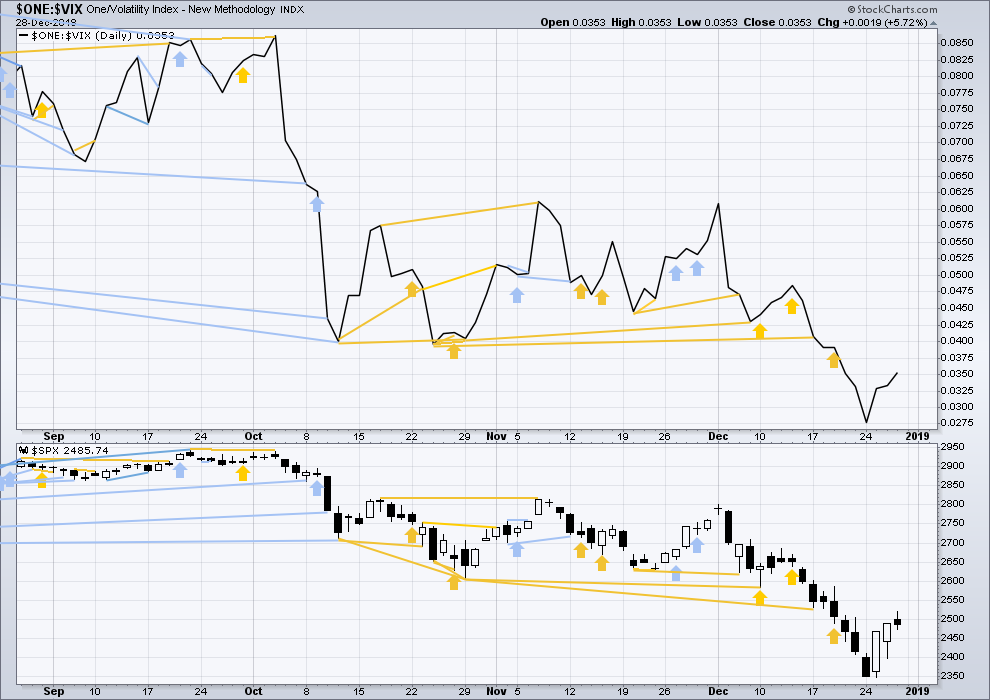
Click chart to enlarge. Chart courtesy of StockCharts.com. So that colour blind members are included, bearish signals
will be noted with blue and bullish signals with yellow.
Both price and inverted VIX have made new lows. There is no divergence.
DOW THEORY
Dow Theory confirms a bear market. This does not necessarily mean a bear market at Grand Super Cycle degree though; Dow Theory makes no comment on Elliott wave counts. On the 25th of August 2015 Dow Theory also confirmed a bear market. The Elliott wave count sees that as part of cycle wave II. After Dow Theory confirmation of a bear market in August 2015, price went on to make new all time highs and the bull market continued.
DJIA: 23,344.52 – a close on the 19th of December at 23,284.97 confirms a bear market.
DJT: 9,806.79 – price has closed below this point on the 13th of December.
S&P500: 2,532.69 – a close on the 19th of December at 2,506.96 provides support to a bear market conclusion.
Nasdaq: 6,630.67 – a close on the 19th of December at 6,618.86 provides support to a bear market conclusion.
GOLD
Updates to analysis throughout the week have expected a continuation of upwards movement towards the target. This is exactly what has happened.
Summary: The next target is 1,295. Look out for a possible further increase in upwards momentum towards this target. A relatively small blow off top may occur in coming days.
The final target for this bounce to end is about 1,305 – 1,310.
Grand SuperCycle analysis is here.
Last historic analysis with monthly charts is here.
Only three remaining wave counts have a reasonable probability and are published below: a triangle (the preferred wave count), a double zigzag, and a combination.
MAIN ELLIOTT WAVE COUNT
WEEKLY CHART – TRIANGLE
Click chart to enlarge.
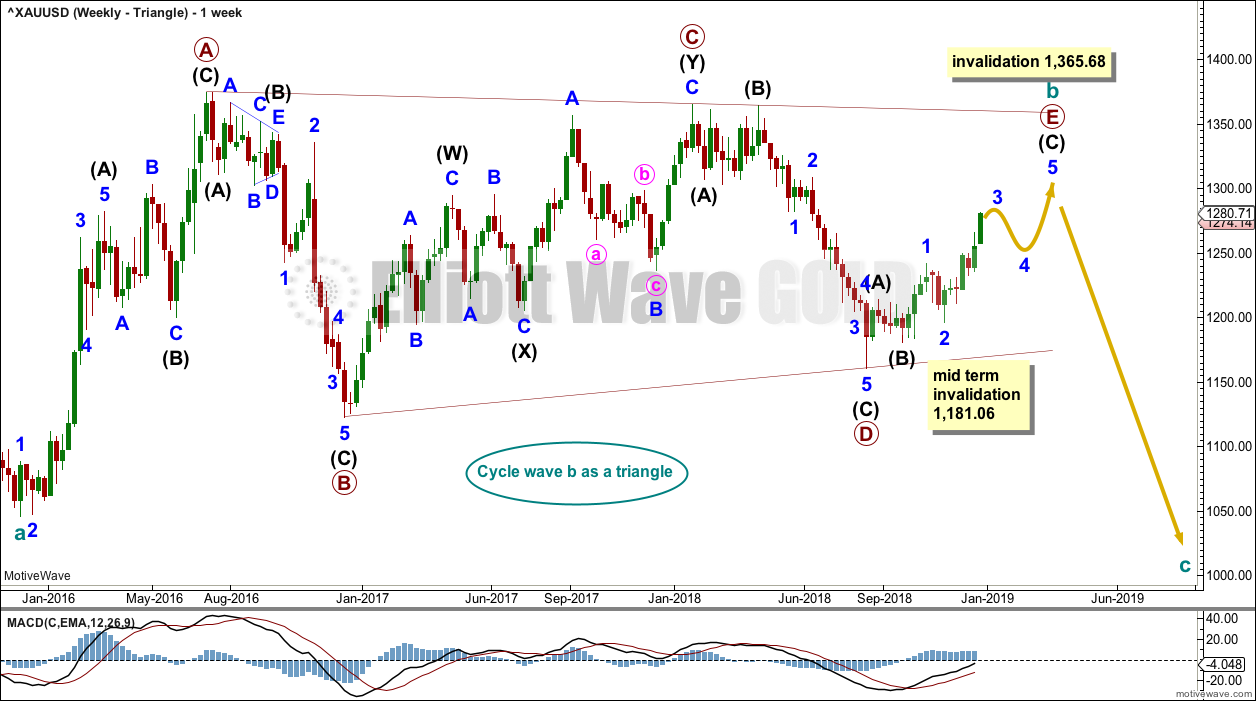
Cycle wave b may be an incomplete regular contracting triangle. Primary wave E may not move beyond the end of primary wave C above 1,365.68.
Within primary wave E, intermediate waves (A) and (B) may be complete. Intermediate wave (C) must subdivide as a five wave structure. Within intermediate wave (C), minor wave 2 may not move beyond the start of minor wave 1 below 1,181.06.
Four of the five sub-waves of a triangle must be zigzags, with only one sub-wave allowed to be a multiple zigzag. Wave C is the most common sub-wave to subdivide as a multiple, and this is how primary wave C for this example fits best. Primary wave E would most likely be a single zigzag. It is also possible that it may subdivide as a triangle to create a rare nine wave triangle.
There are no problems in terms of subdivisions or rare structures for this wave count. It has an excellent fit and so far a typical look.
When primary wave E is a complete three wave structure, then this wave count would expect a cycle degree trend change. Cycle wave c would most likely make new lows below the end of cycle wave a at 1,046.27 to avoid a truncation.
It is possible now that primary wave E may end early in January 2019. Some reasonable weakness should be expected at its end. Triangles often end with declining ATR, weak momentum and weak volume.
DAILY CHART – TRIANGLE
Click chart to enlarge.
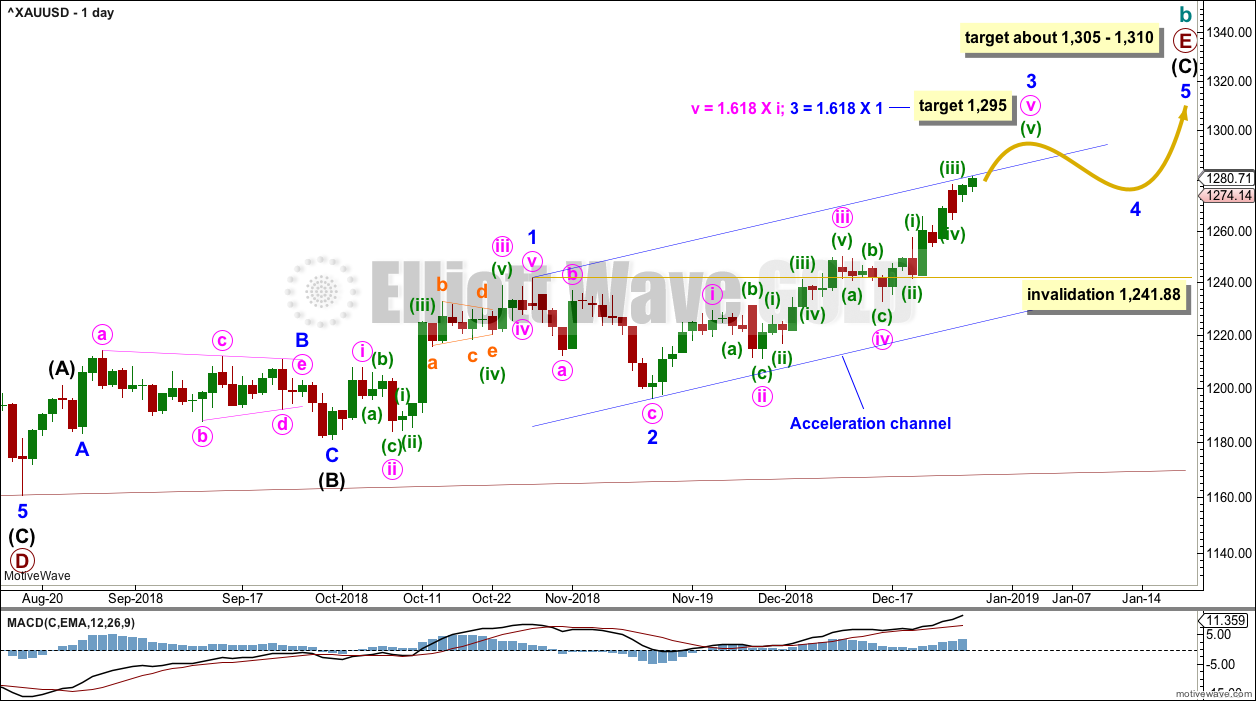
Primary wave E may now be nearing its final stages for this wave count.
Primary wave E should subdivide as a zigzag. Intermediate waves (A) and (B) may now be complete. Intermediate wave (C) may be underway.
Within intermediate wave (C), minor wave 1 fits perfectly as a five wave impulse. Minor wave 2 is a deep zigzag.
Minor wave 3 may be an almost complete impulse, now within the final fifth wave. The target is now calculated at two degrees and so has a higher probability.
Gold often exhibits swift strong fifth waves. This tendency is especially prevalent in fifth waves to end third wave impulses. Look out for a possible blow off top to end minute wave v of minor wave 3.
Although the triangle for cycle wave b is expected to end with weakness, it is still possible that a smaller blow off top may occur at the end of minor wave 3 just ahead.
When minor wave 3 is complete, then minor wave 4 may unfold over about two to four weeks. Minor wave 4 may not move into minor wave 1 price territory below 1,241.88.
A target for primary wave E is the strong zone of resistance about 1,305 to 1,310. Primary wave E is most likely to subdivide as a zigzag (although it may also subdivide as a triangle to create a rare nine wave triangle). It may last a total Fibonacci 21 or 34 weeks. So far it has lasted 19 weeks. Primary wave E may not move beyond the end of primary wave C above 1,365.68.
WEEKLY CHART – DOUBLE ZIGZAG
Click chart to enlarge.
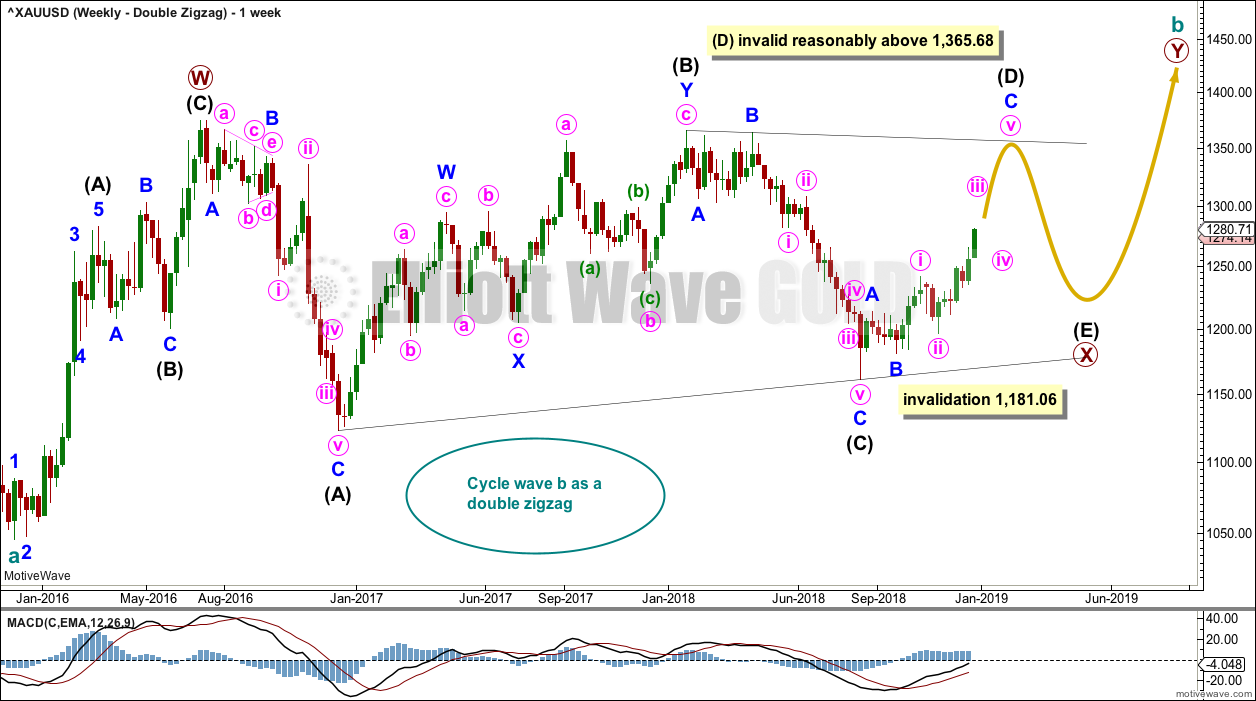
It is possible that cycle wave b may be a double zigzag or a double combination.
The first zigzag in the double is labelled primary wave W. This has a good fit.
The double may be joined by a corrective structure in the opposite direction, a triangle labelled primary wave X. The triangle would be about three quarters complete.
Within the triangle of primary wave X, intermediate wave (C) should be complete. Within intermediate wave (D), minor waves A and B may be complete. Minor wave C must subdivide as a five wave structure. Within minor wave C, minute wave ii may not move beyond the start of minute wave i below 1,181.06.
Intermediate wave (D) would most likely subdivide as a single zigzag.
This wave count may now expect choppy overlapping movement in an ever decreasing range for several more months.
Primary wave Y would most likely be a zigzag because primary wave X would be shallow; double zigzags normally have relatively shallow X waves.
Primary wave Y may also be a flat correction if cycle wave b is a double combination, but combinations normally have deep X waves. This would be less likely.
This wave count has good proportions and no problems in terms of subdivisions.
WEEKLY CHART – COMBINATION
Click chart to enlarge.
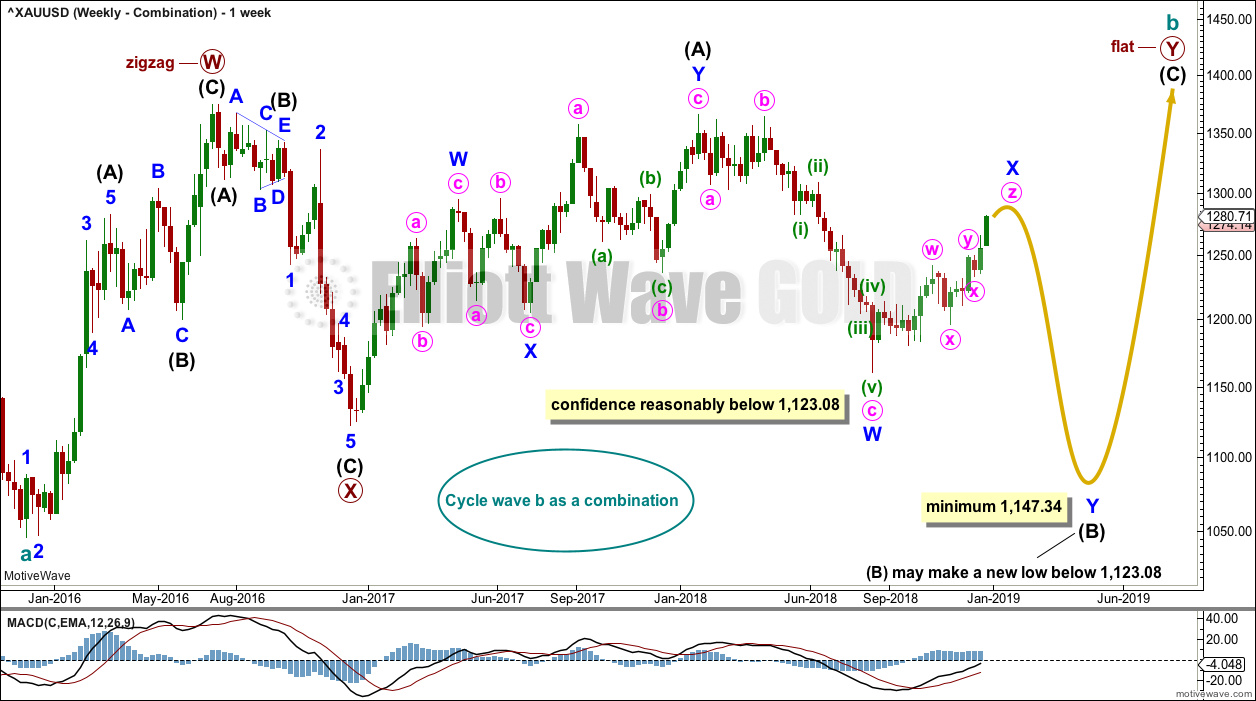
If cycle wave b is a combination, then the first structure in a double may be a complete zigzag labelled primary wave W.
The double may be joined by a three in the opposite direction, a zigzag labelled primary wave X.
The second structure in the double may be a flat correction labelled primary wave Y. My research on Gold so far has found that the most common two structures in a double combination are one zigzag and one flat correction. I have found only one instance where a triangle unfolded for wave Y. The most likely structure for wave Y would be a flat correction by a very wide margin, so that is what this wave count shall expect.
Within a flat correction for primary wave Y, the current downwards wave of intermediate wave (B) may be a double zigzag. Intermediate wave (B) must retrace a minimum 0.9 length of intermediate wave (A) at 1,147.34. Intermediate wave (B) may move beyond the start of intermediate wave (A) as in an expanded flat.
No upper invalidation point is given on this chart. Minor wave X may still continue higher. There is no Elliott wave rule stating a minimum nor maximum length for X waves within multiples.
Because the minimum requirement for intermediate wave (B) is not yet met, this wave count requires that intermediate wave (B) continues lower. This is the most immediately bearish of all weekly wave counts.
When intermediate wave (B) is complete, then intermediate wave (C) would be expected to make at least a slight new high above the end of intermediate wave (A) at 1,365.68 to avoid a truncation. Primary wave Y would be most likely to end about the same level as primary wave W at 1,374.91, so that the whole structure takes up time and moves price sideways, as that is the purpose of double combinations.
While double combinations are very common, triples are extremely rare. I have found no examples of triple combinations for Gold at daily chart time frames or higher back to 1976. When the second structure in a double is complete, then it is extremely likely (almost certain) that the whole correction is over.
Minor wave X now only fits as a possible triple zigzag which could possibly be complete.
While double zigzags are fairly common, triples are reasonably rare. I have found four examples at the daily chart level or higher for Gold back to 1976.
However, X waves within multiple zigzags (which is the structure seen here for intermediate wave (B) ) are very rarely themselves multiples.
The probability of this wave count is substantially reduced. It no longer warrants a daily chart.
TECHNICAL ANALYSIS
WEEKLY CHART
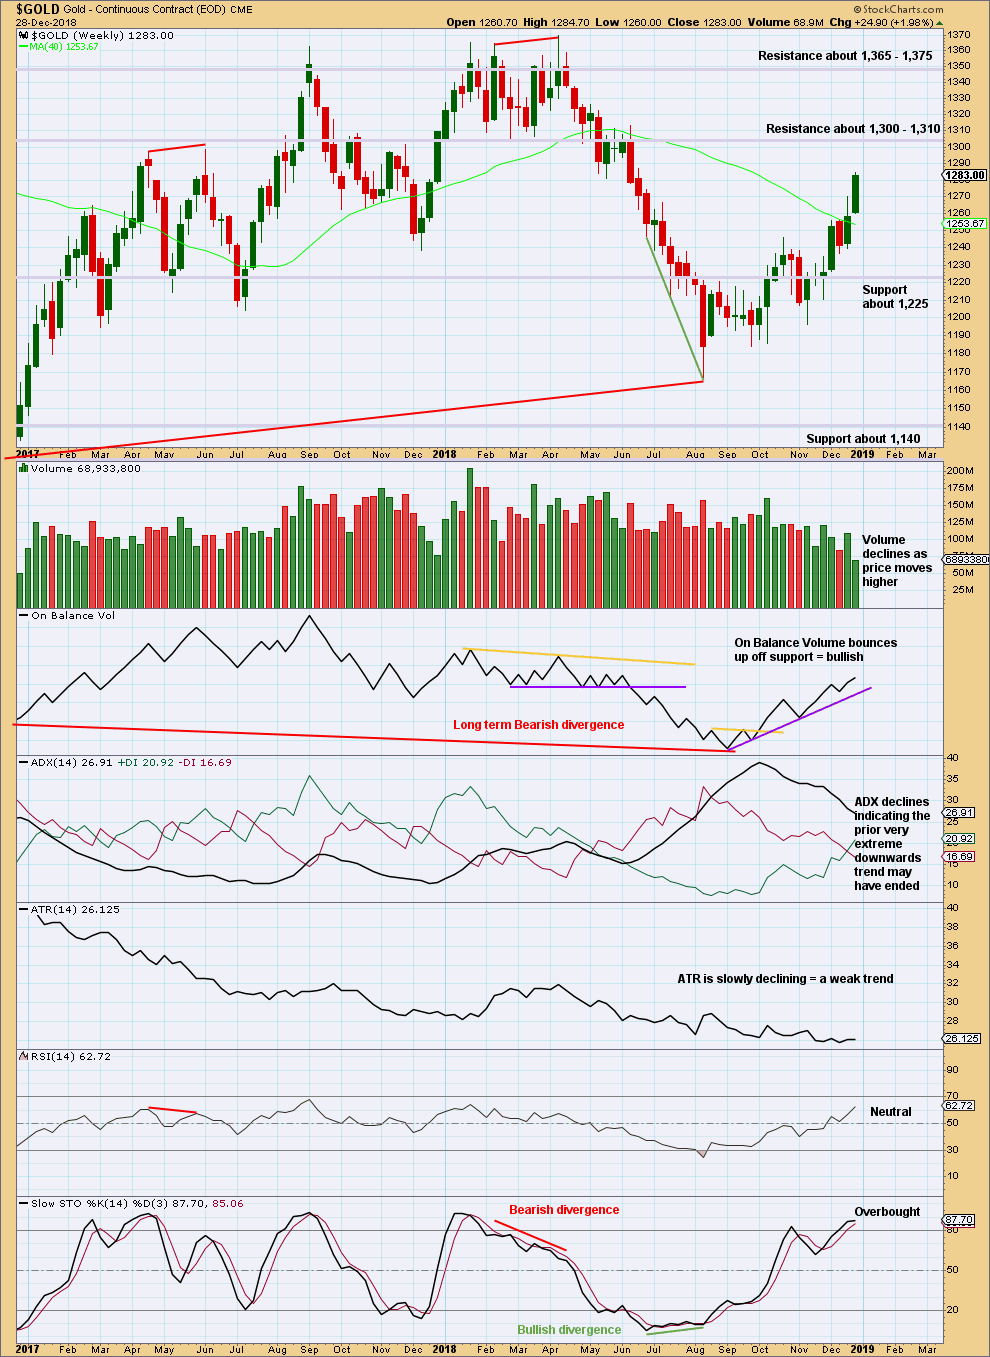
Click chart to enlarge. Chart courtesy of StockCharts.com.
On Balance Volume has made a lower low than its prior low at the end of November 2015. This divergence is extremely bearish but does not rule out a consolidation unfolding here; the divergence does strongly support the Triangle wave count, which expects a consolidation or bounce up to test resistance now and then a continuation of a major bear market. It could also support the flat wave count that allows for a new low below 1,046.27 in coming months.
Although volume has declined for this week, it was not a full trading week. To judge the short-term volume profile it is necessary to look inside the week at daily volume patterns.
Next resistance ahead is strong about 1,305 – 1,310.
DAILY CHART
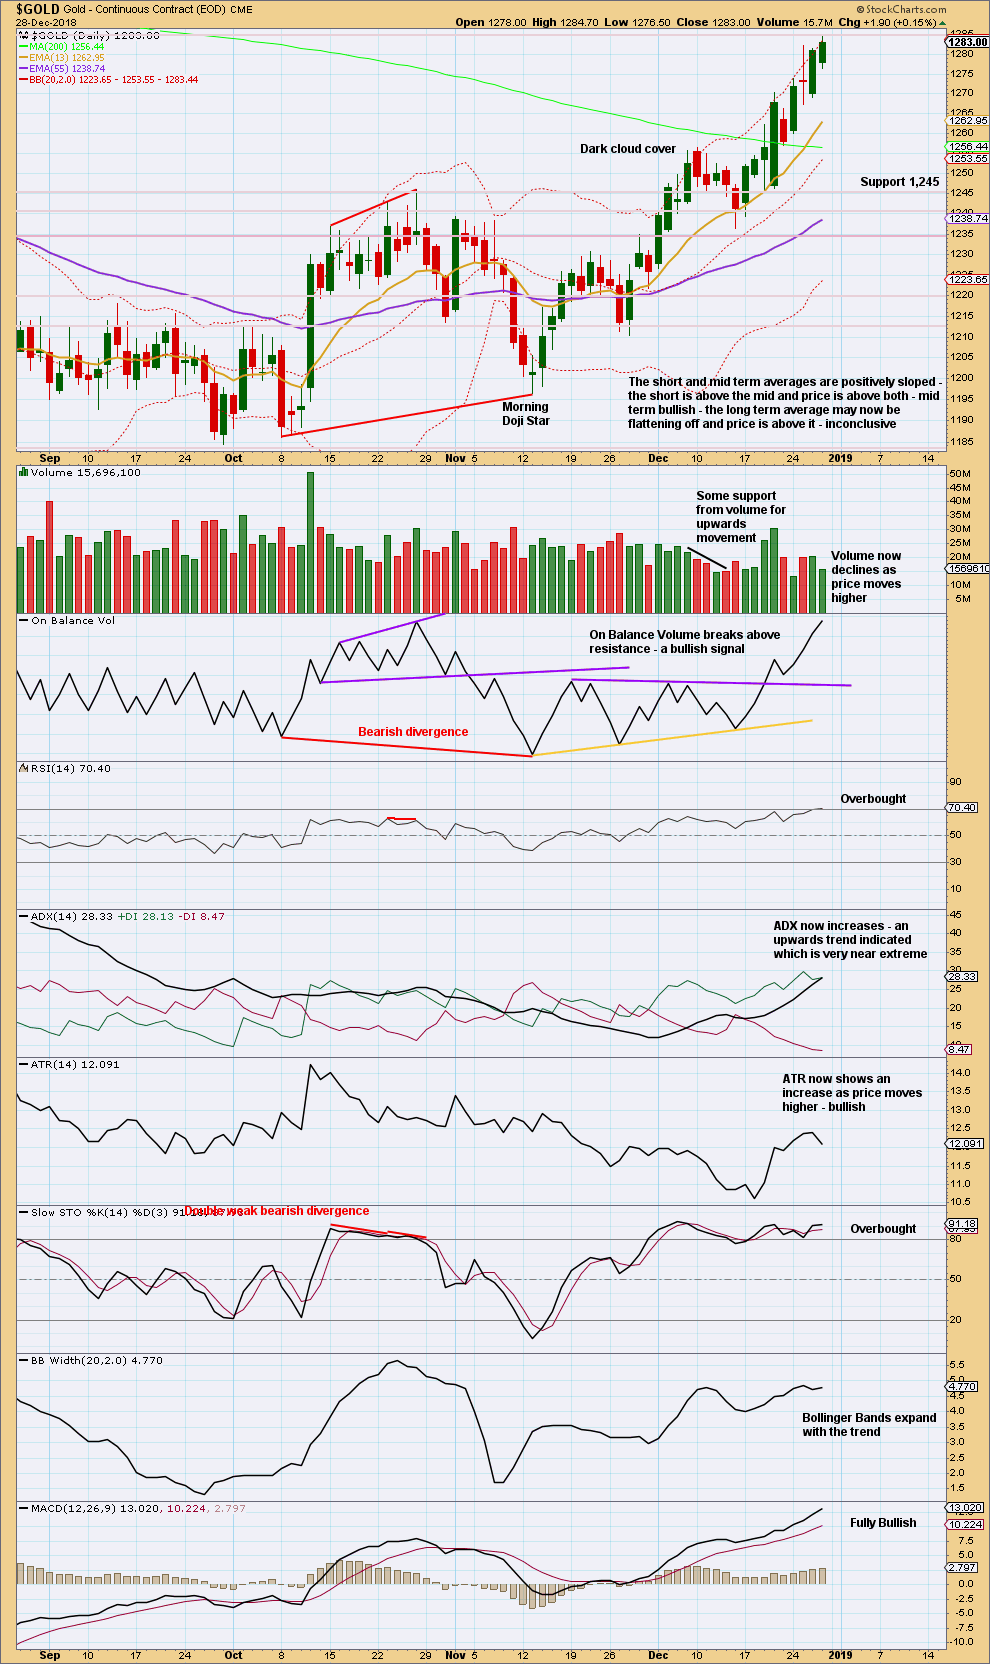
Click chart to enlarge. Chart courtesy of StockCharts.com.
Look out for an end to this upwards trend coming soon: ADX is almost extreme, the short-term volume profile is slightly bearish, and RSI has just reached overbought. That does not mean upwards movement must end here, only that it might end quite soon.
Look for a candlestick reversal pattern to possibly signal the end of this upwards wave and either a trend change or an interruption to the trend by a consolidation.
GDX WEEKLY CHART
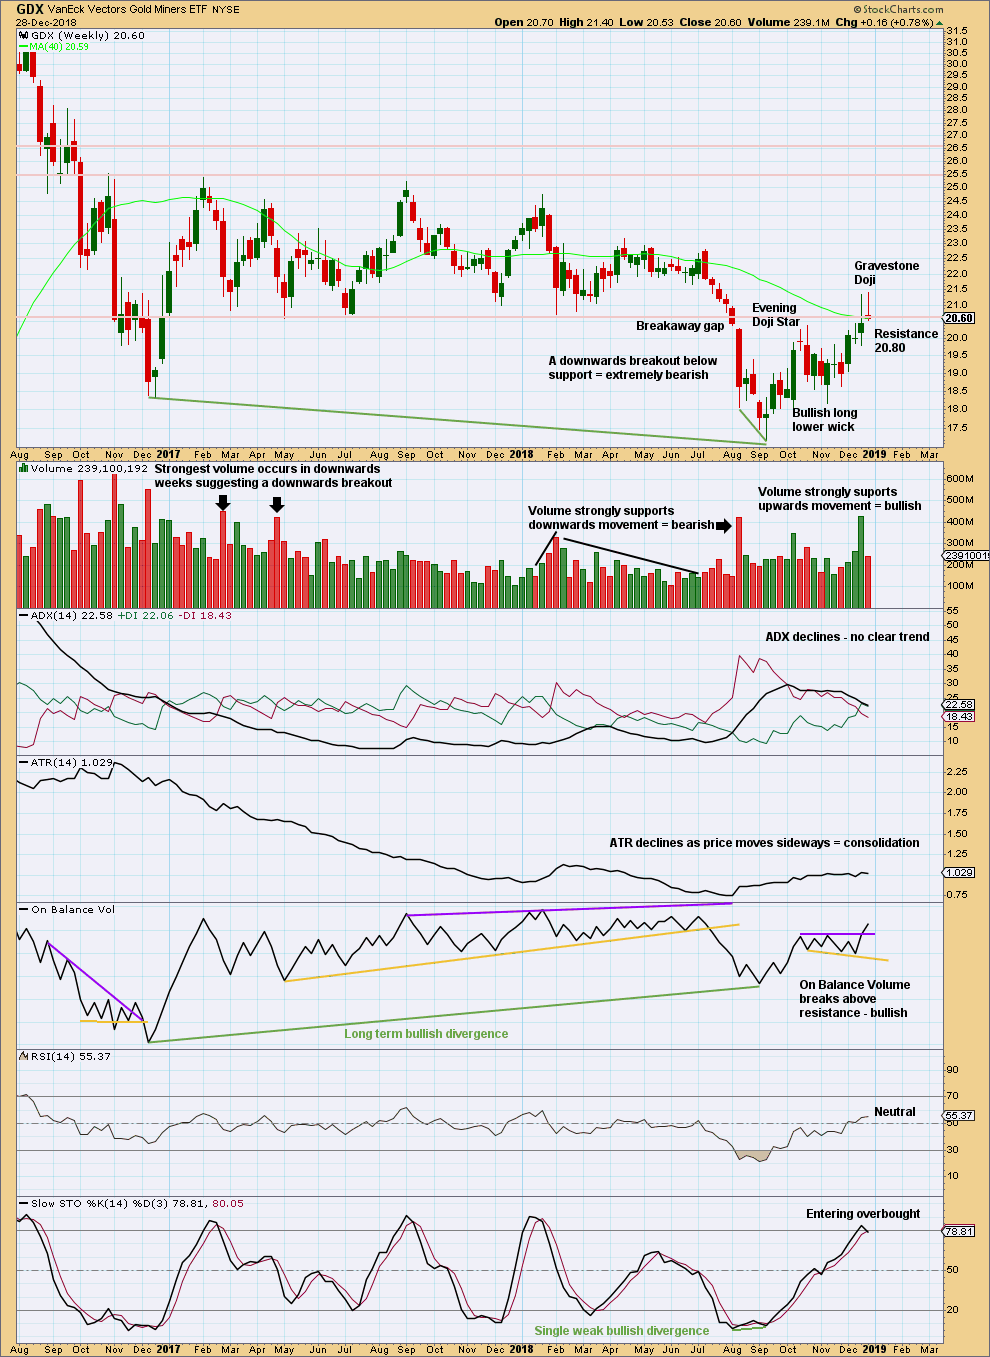
Click chart to enlarge. Chart courtesy of StockCharts.com.
The Gravestone doji’s forte is in calling market tops. This weekly candlestick is a bearish reversal pattern.
GDX DAILY CHART
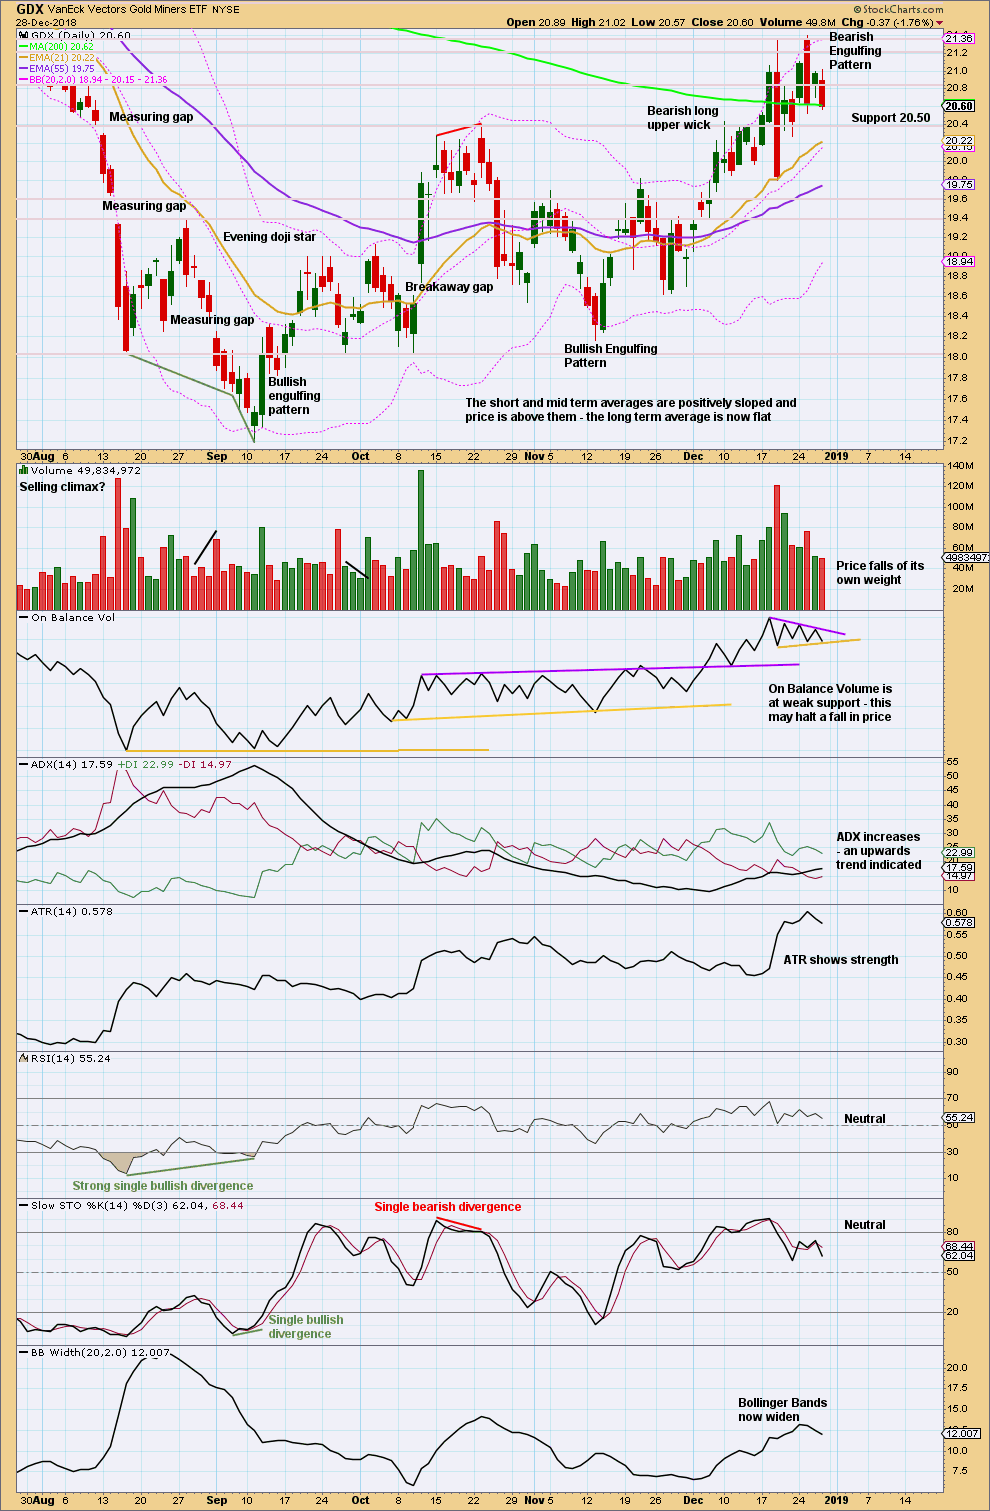
Click chart to enlarge. Chart courtesy of StockCharts.com.
Price has been very strongly rejected just above 20.80.
The very strong Bearish Engulfing reversal pattern indicates the upwards trend is now over. Expect GDX to go on to make new lows below 17.28.
US OIL
Last end of week analysis for US Oil expected more downwards movement towards a target at 42.10. Downwards movement continued to 42.37, just 0.27 short of the Elliott wave target.
Summary: A bounce or sideways consolidation for a few weeks is now expected. The target is about 63.71.
A breach of the best fit channel on the daily chart would add confidence to this view.
The larger picture still sees Oil in a new downwards trend to end reasonably below 26.06.
MAIN ELLIOTT WAVE COUNT
MONTHLY CHART
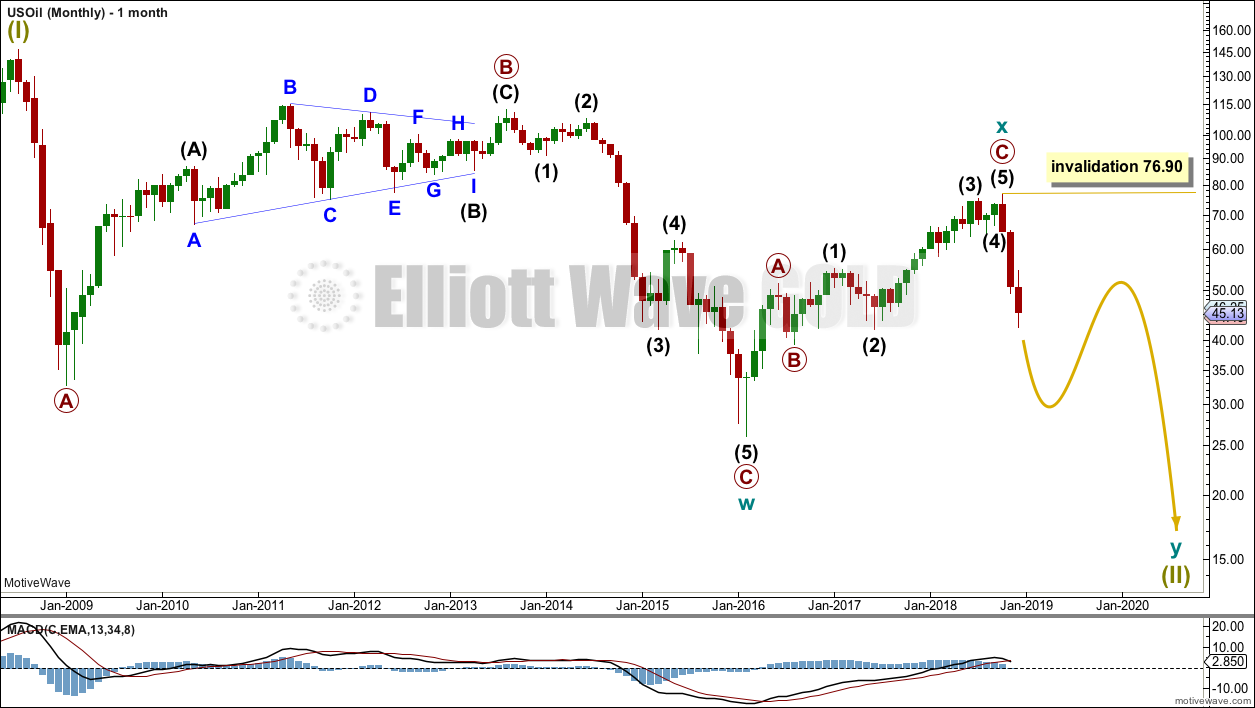
Click chart to enlarge.
Classic technical analysis favours a bearish wave count for Oil at this time.
The large fall in price from the high in June 2008 to February 2016 is seen as a complete three wave structure. This large zigzag may have been only the first zigzag in a deeper double zigzag.
The first zigzag down is labelled cycle wave w. The double is joined by a now complete three in the opposite direction, a zigzag labelled cycle wave x.
The purpose of a second zigzag in a double is to deepen the correction when the first zigzag does not move price deep enough. Cycle wave y would be expected to move reasonably below the end of cycle wave w to deepen the correction. Were cycle wave y to reach equality with cycle wave w that takes Oil into negative price territory, which is not possible. Cycle wave y would reach 0.618 the length of cycle wave w at $2.33.
A better target calculation would be using the Fibonacci ratios between primary waves A and C within cycle wave y. This cannot be done until both primary waves A and B are complete.
Within cycle wave y, no second wave correction nor B wave may move beyond its start above 76.90.
WEEKLY CHART
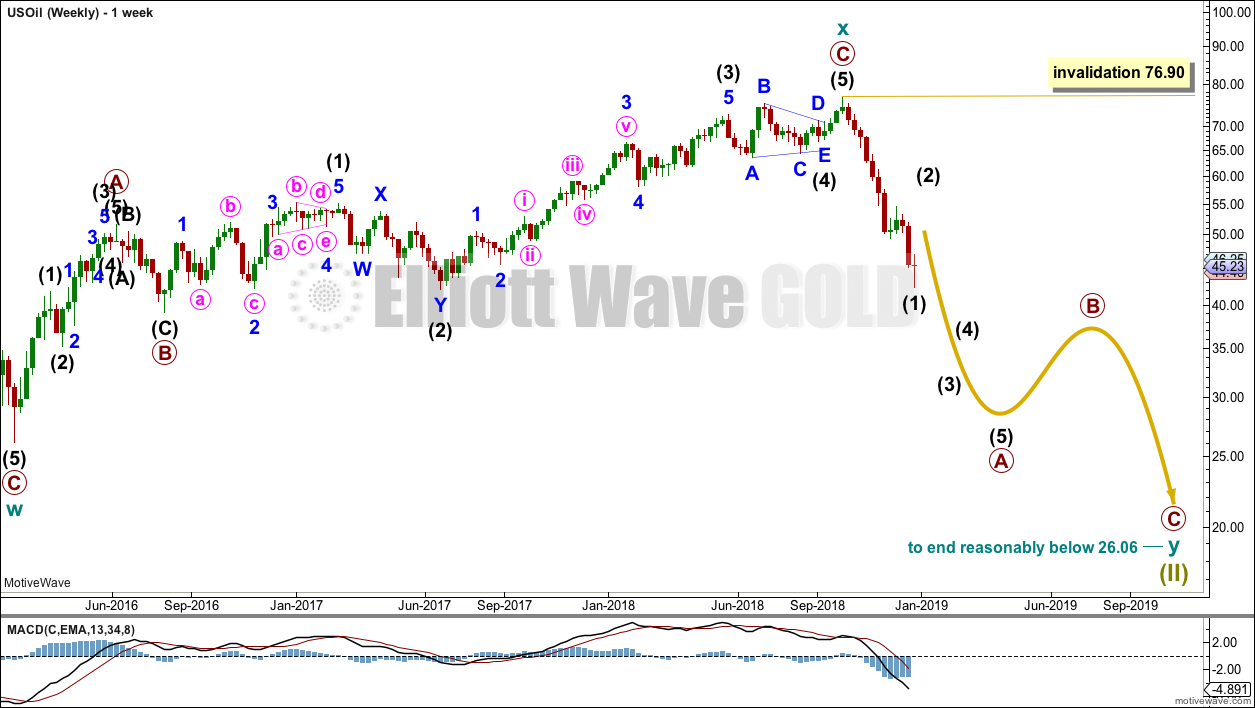
Click chart to enlarge.
Cycle wave x is seen as a complete zigzag. Within the zigzag, primary wave C is a five wave impulse and within it intermediate wave 4 is a triangle.
A new low below 51.67 has added confidence in this bearish wave count. At that stage, the bullish alternate was invalidated.
Cycle wave y is expected to subdivide as a zigzag. A zigzag subdivides 5-3-5. Primary wave A must subdivide as a five wave structure if this wave count is correct.
Within primary wave A, intermediate wave (1) may now be complete. Intermediate wave (2) may unfold over a few weeks as a sideways choppy consolidation, or a deep sharp bounce.
DAILY CHART
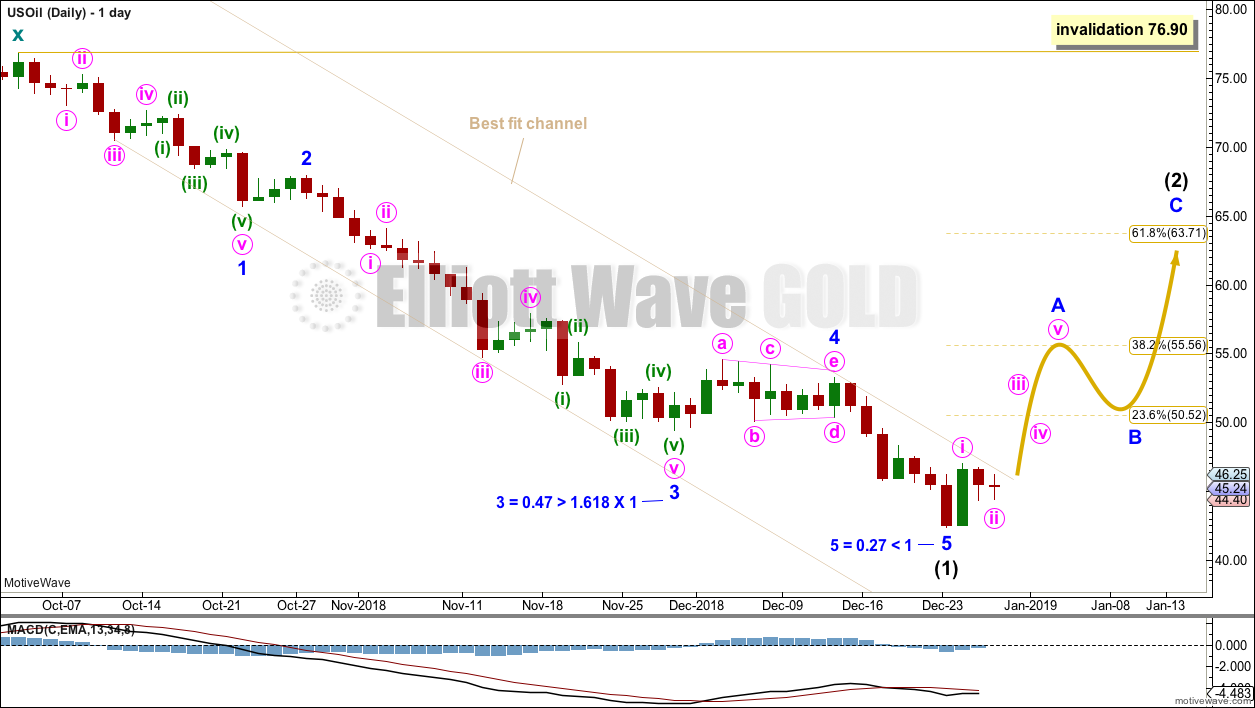
Click chart to enlarge.
A strong candlestick reversal pattern, a Bullish Engulfing candlestick for the 26th of December, indicates a low may now be in place.
The best fit channel is not yet breached. If it is breached early next week, that shall provide further confidence that a low is in place. The risk that the wave count is wrong and intermediate wave (1) may continue lower will remain reasonable while price remains within this channel.
Intermediate wave (2) may be very deep. It should last at least four weeks, so that it shows up on the monthly chart.
Intermediate wave (2) may not move beyond the start of intermediate wave (1) above 76.90.
TECHNICAL ANALYSIS
MONTHLY CHART
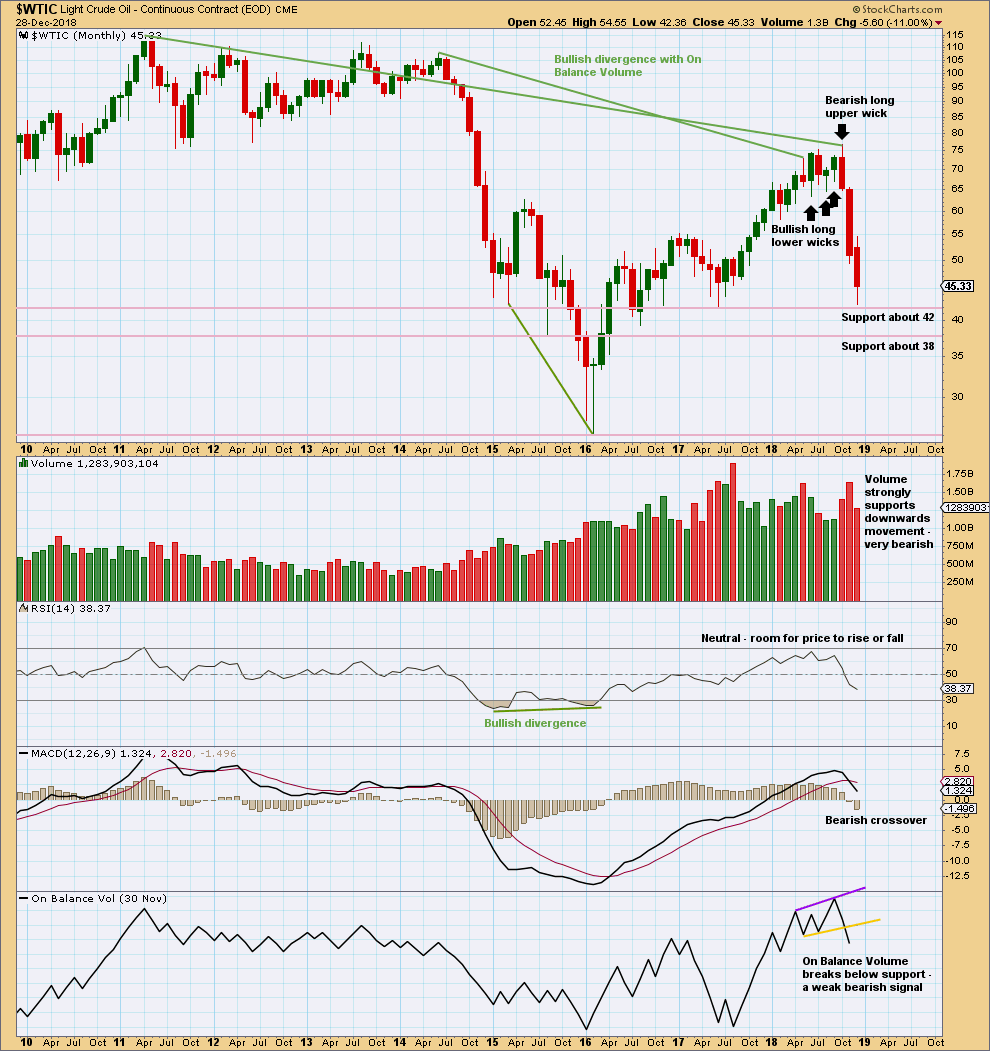
Click chart to enlarge. Chart courtesy of StockCharts.com.
The month of November has a very small lower wick. This is still fairly bearish.
The signal from On Balance Volume is weak because the trend line breached had only two anchor points and a reasonable slope. But it is still a bearish signal.
WEEKLY CHART
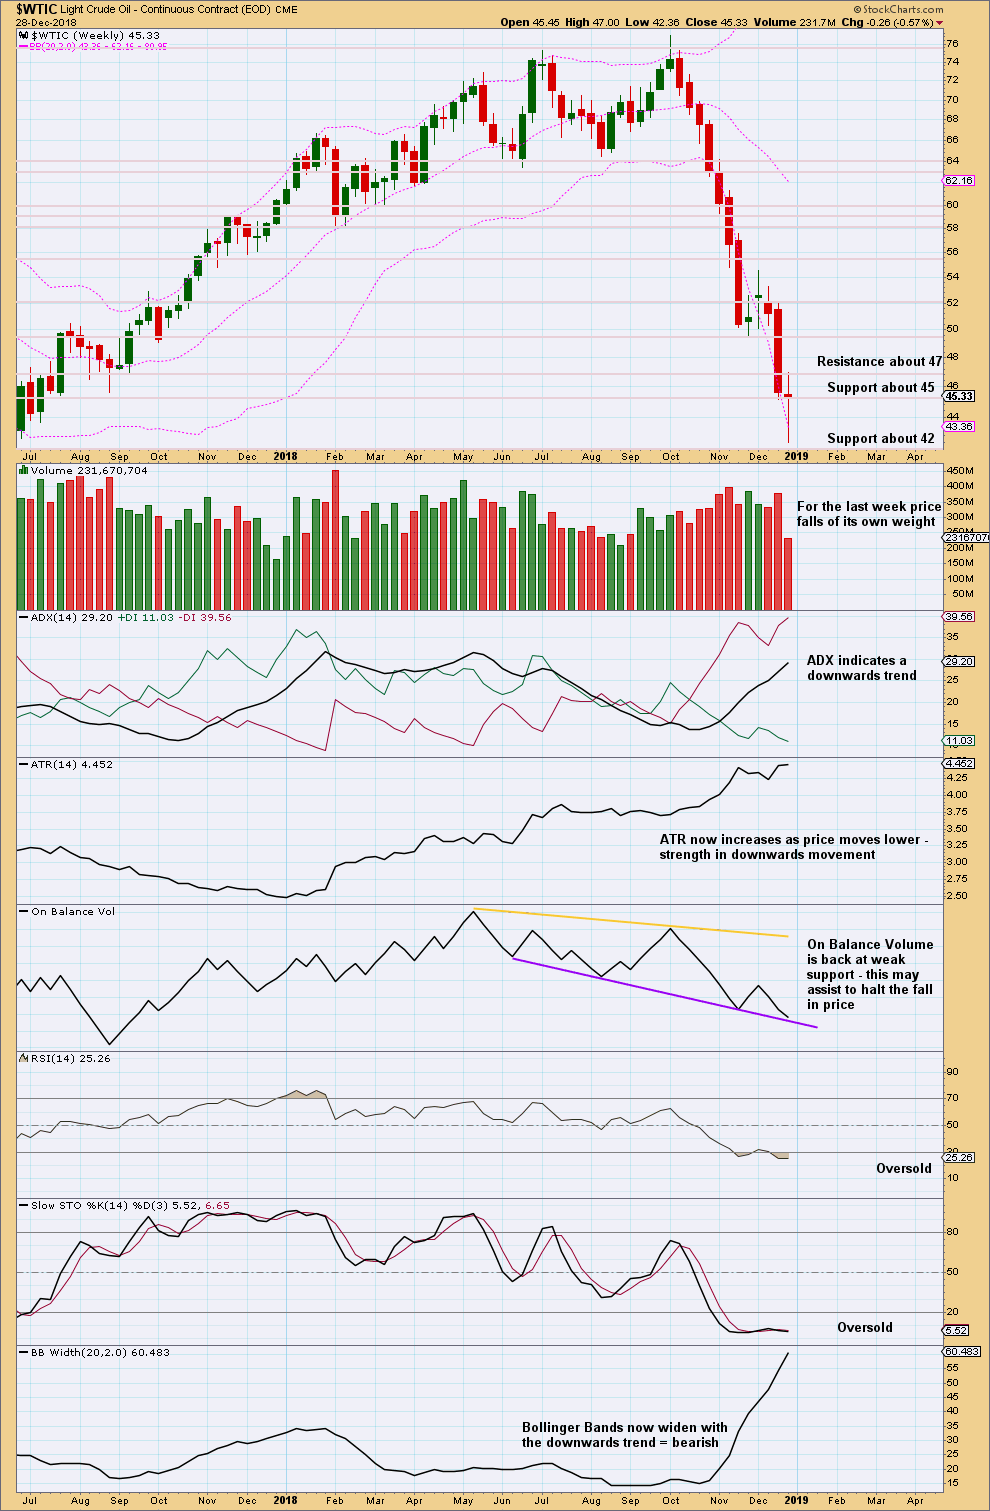
Click chart to enlarge. Chart courtesy of StockCharts.com.
The doji weekly candlestick indicates a balance of bulls and bears. This is a warning of a possible low in place, but it is not on its own a reversal pattern.
The doji candlestick, declining volume and On Balance Volume at support give a warning that a low may be in place.
DAILY CHART
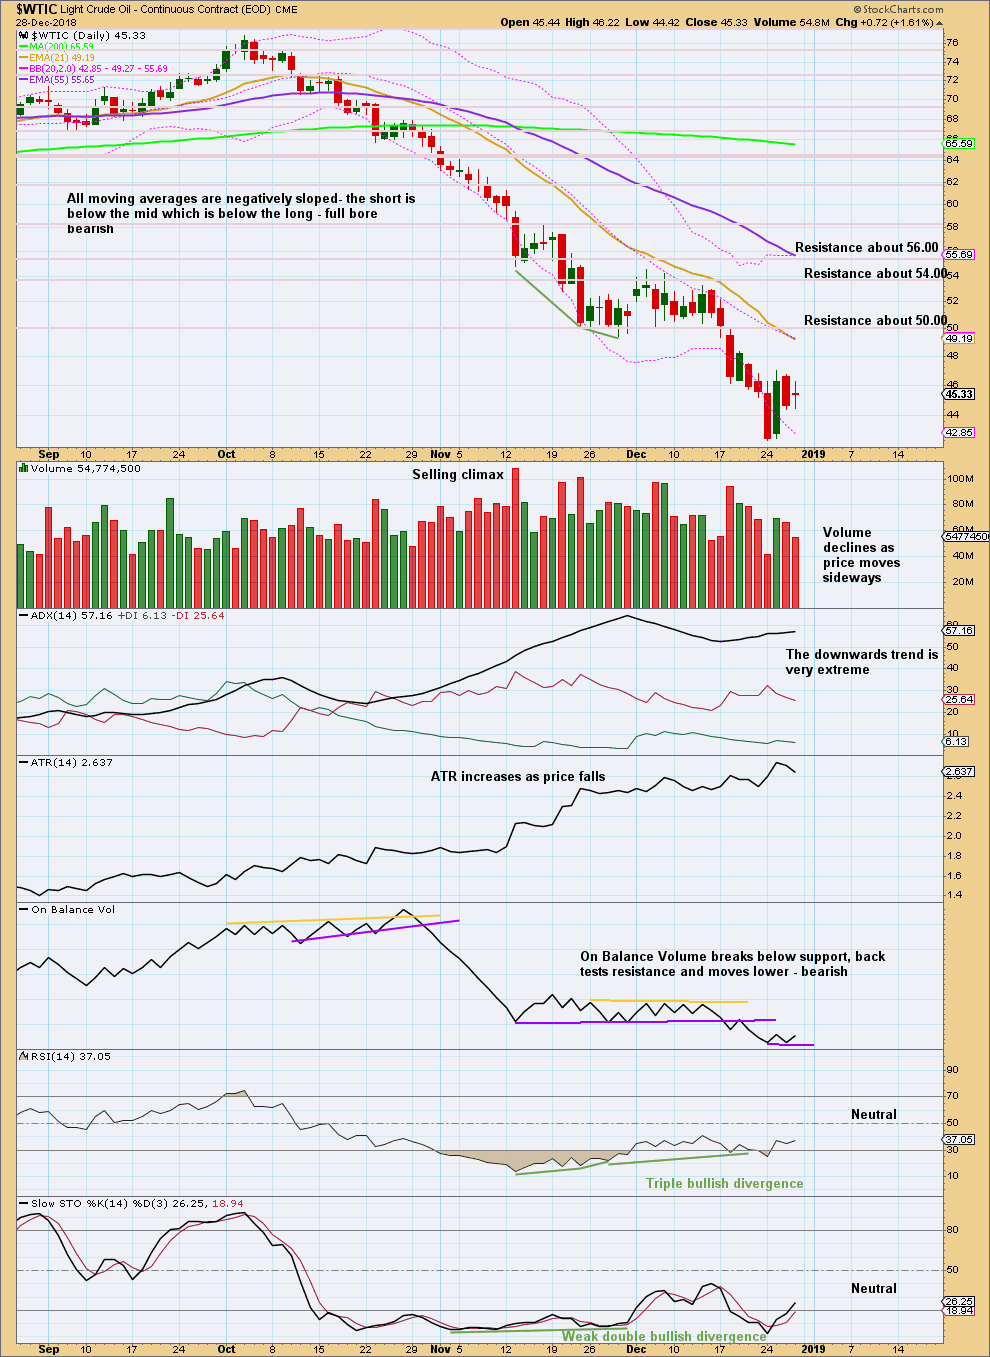
Click chart to enlarge. Chart courtesy of StockCharts.com.
The strong bullish candlestick of the 26th of December is not properly a Bullish Engulfing pattern on StockCharts data because the open is above the close of the prior session. The close of the 26th of December is very bullish though, and it has support from volume.
—
Always practice good risk management as the most important aspect of trading. Always trade with stops and invest only 1-5% of equity on any one trade. Failure to manage risk is the most common mistake new traders make.
If one looks at the start of this big downward wave in oil it miraculously almost coincided with the top of SP at the start of October… they both seem to have bottomed on Dec 26….after huge waves down…. Maybe this is just coincidence, but if oil goes down that much it is hardly probable SP will go up to new highs🤷🏼♂️🤷🏼♂️ So, the big chance is SP has not bottomed yet….☝️🤷🏼♂️ Lara, pls, do not show correlations again … I am not talking about significant overall correlation of oil and SP…. but, there are some signs and intervals/ time spans when they do correlate pretty much…. My point is the correction or bear market( call it whatever you may want) in SP is most probably not over yet with such bearish wave count in oil…. Question on oil then – Lara, why don’t you think that all of A wave is over or almost over and we will be having long correcting wave B up? Why do you think it is just 1st wave of big wave A? And how much are you sure of WXY wave count?? I am asking because you had very bullish long-term oil count before and changed it 180 degrees to bearish after oil collapsed…. maybe, there is some other more bullish wave count??? By looking at this one utterly bearish for oil it is hard to imagine strong 5th wave for SP….🤷🏼♂️🤷🏼♂️🤷🏼♂️
History shows you it’s possible. From April 2012 to Jan 2016, Brent lost 80% while the SP500 gained 47.8%
Personally I like the look at the extended First Cycle Wave on the SP500. From a fractal perspective, it makes a short and sharp Cycle 5th wave look more probable.
Seasons Greetings, Lara. Apologies if you’ve commented on this guideline and I had missed it – If Wave 1 is extended, it is often in Fib proportion to the net travel of Waves 3 to 5.
S&P500
SP500 net travel of Cycle Wave 1 equals 1440 points.
0.618 is not high enough ratio to allow the net travel of Cycle Waves 3 to 5 to approximate the travel of Wave 1.
Can we then take a ratio of equality, and apply 1440 points to the Cycle Wave 2 low of 1810. This gives a target of 3250. The reason I like this is it takes you to the top of the monthly channel (with a possible small overshoot). Something to consider?
As an aside, I have seen some Gannists are factoring in an April 23rd major top.
AlexPronin: “Do not show correlations again”
Well… then I can’t answer your question.
I’ve said this before and it bears repeating. I do not think this analysis service is what you are looking for. I have seen members behave like this, and it never ends well.
I am thinking the best thing to do would be to cancel your membership and refund your last monthly fee.
You appear to have no confidence in my analysis, indeed, not in basic math (such as the correlation co-efficient). You keep asking the same kinds of questions over and over. I am finding that my patience is pretty much worn out.
It looks like the top of the upcoming Intermediate 2 in OIL will be a very good shorting opportunity indeed. Watch for it.
Yep. That’s what I think too.
Hi Lara, regarding the oil charts, how come the monthly and weekly charts don’t show the bounce to 63?
They’re focussed on the bigger picture.
I’m trying to show the smaller movements on the daily chart, bigger picture on weekly and monthly.