

S&P 500
A short-term pullback was expected to begin on Friday, but this did not eventuate. Overall, an upwards trend was expected to be in place and this continues. The target remains the same.
Summary: For the very short term, upwards movement looks most likely to continue at the start of next week. A short-term target for a small interruption to the trend for minor wave 2 is now at 2,780.
A target for the next wave up is 2,973. About this target a multi week consolidation may begin for intermediate wave (4).
The main wave count now expects this bull market to end at the end of December 2018 at the earliest, and possibly in March 2019, at 3,090.
The last gap may provide support at 2,682.53.
The biggest picture, Grand Super Cycle analysis, is here.
Last published monthly chart is here, video is here.
MAIN ELLIOTT WAVE COUNT
WEEKLY CHART
Click chart to enlarge.
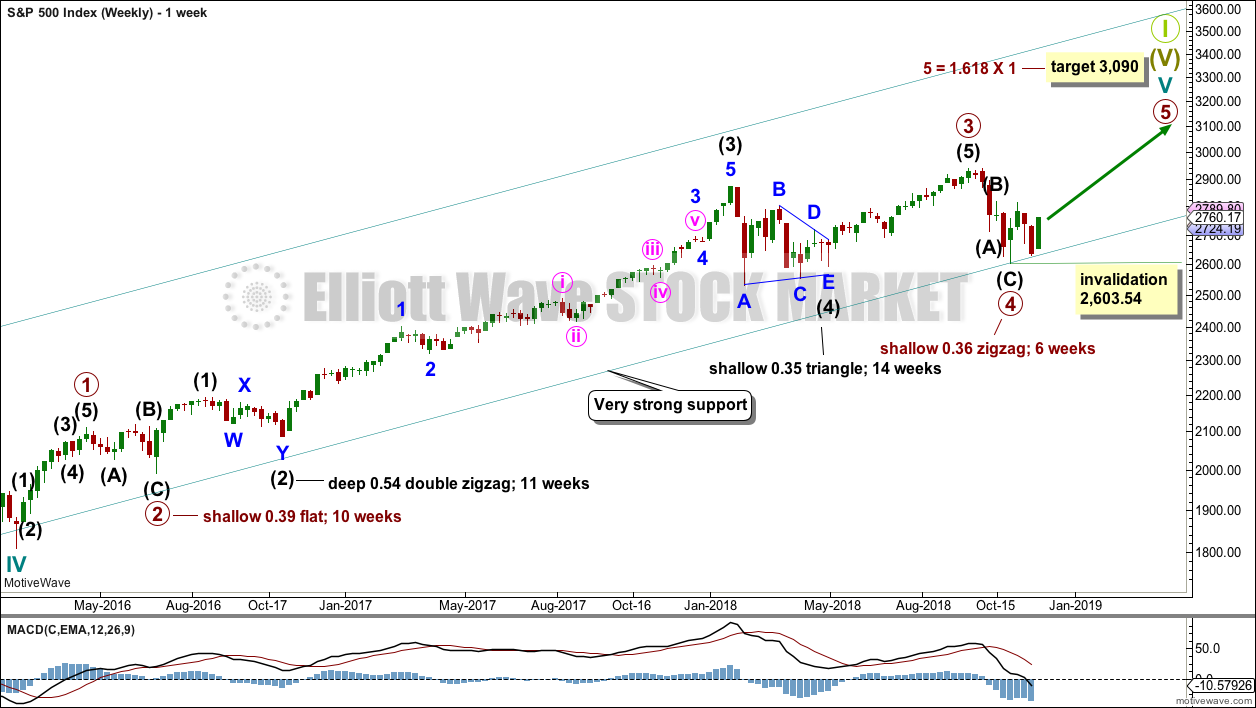
Cycle wave V must complete as a five structure, which should look clear at the weekly chart level and also at the monthly chart level. It may only be an impulse or ending diagonal. It is clear it is an impulse.
Within primary wave 3, there is perfect alternation and excellent proportion between intermediate waves (2) and (4).
Primary wave 4 may have found very strong support about the lower edge of the teal channel. This channel is copied over from the monthly chart and contains the entire bull market since its beginning in March 2009. While Super Cycle wave (V) is incomplete, this channel should not be breached at the weekly chart level.
Draw the teal channel from the high of cycle wave I at 1,343.80 on the week beginning 3rd July 2011, to the high of cycle wave III at 2,079.46 on the week beginning 30th November 2014, and place a parallel copy on the low of cycle wave II at 1,074.77 on the week beginning 2nd October 2011. Draw this chart on a semi-log scale. A small overshoot, like that seen at the end of cycle wave IV, would be entirely acceptable. If price does move below the channel, then it should reverse reasonably quickly.
The proportion between primary waves 2 and 4 is reasonable. Flat corrections tend to be longer lasting structures than zigzags. There would be perfect alternation in structure and inadequate alternation in depth. This is acceptable.
This wave count has the right look at the monthly chart level.
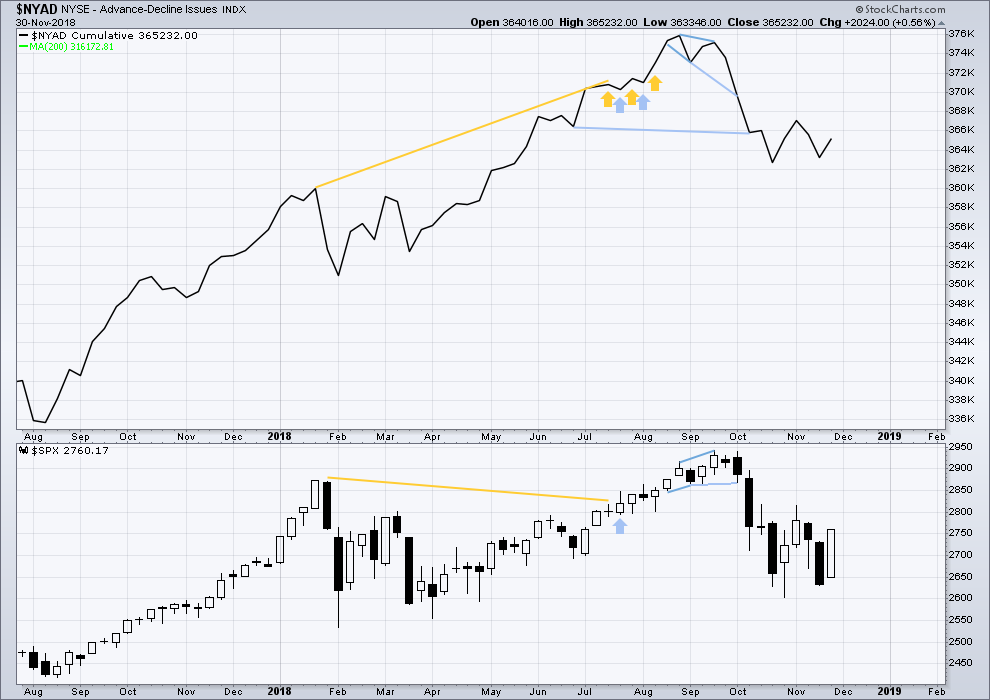
If primary wave 5 ends at or after the end of December 2018 and the AD line fails to make new all time highs, there would then be the minimum required four months of bearish divergence between price and the AD line. If this happens, then the conditions for the end of this bull market would be in place.
A target is calculated for primary wave 5 to end. If primary wave 5 were to be only equal in length with primary wave 1, then it would be truncated. A truncated primary wave 5 would be unlikely as then there could be no bearish divergence with the AD line. The next Fibonacci ratio in the sequence is used to calculate a target for primary wave 5.
Within primary wave 5, no second wave correction may move beyond the start of its first wave below 2,603.54.
DAILY CHART
Click chart to enlarge.
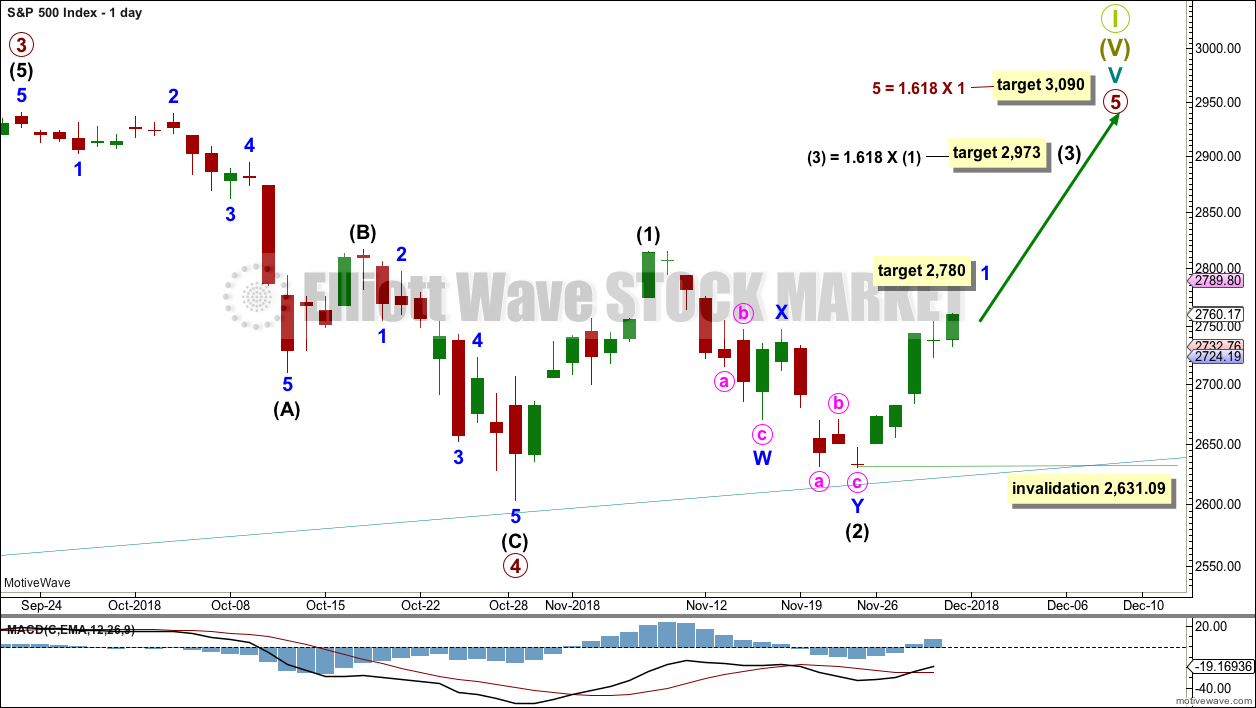
Within primary wave 5, intermediate waves (1) and (2) may be over. Within intermediate wave (3), minor wave 2 may not move beyond the start of minor wave 1 below 2,631.09.
Primary wave 5 may subdivide either as an impulse (more likely) or an ending diagonal (less likely). Intermediate wave (1) may be seen as either a five wave impulse or a three wave zigzag at lower time frames, and so at this stage primary wave 5 could be either an impulse or a diagonal.
For both an impulse and a diagonal, intermediate wave (3) must move above the end of intermediate wave (1).
Primary wave 5 at its end may be expected to exhibit reasonable weakness. At its end, it should exhibit a minimum of 4 months bearish divergence with the AD line, it may exhibit bearish divergence between price and RSI and Stochastics, and it may lack support from volume.
ALTERNATE ELLIOTT WAVE COUNT
WEEKLY CHART
Click chart to enlarge.
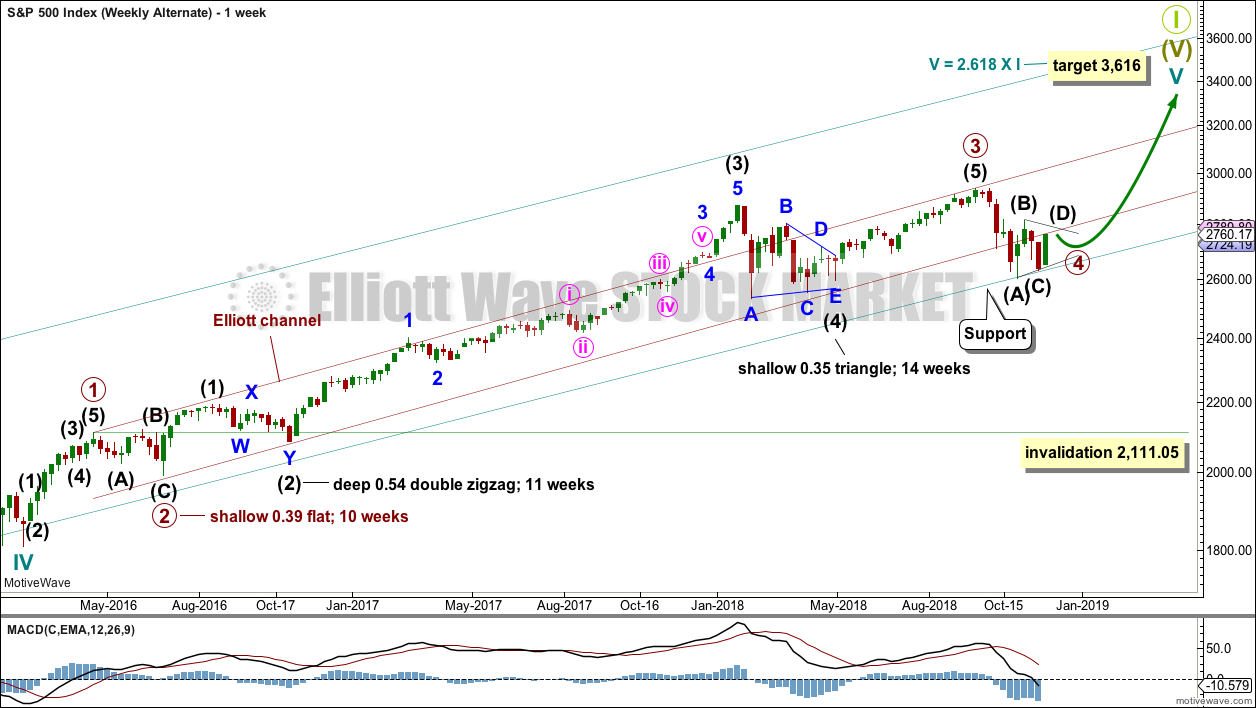
It is also still possible that primary wave 4 may be incomplete. However, at this stage, if primary wave 4 is incomplete and continues for a further several weeks, it would now be out of proportion to primary wave 2. Primary wave 2 lasted 10 weeks. If primary wave 4 is incomplete, then so far it has lasted 10 weeks.
If primary wave 4 is incomplete, then the most likely structures at this stage may be a zigzag, triangle or combination. A double zigzag and flat are discarded based upon the requirement for a large overshoot of the teal trend channel, and poor proportion.
Primary wave 4 may not move into primary wave 1 price territory below 2,111.05.
For this alternate wave count, when primary wave 4 may be complete, then the final target may be calculated at primary degree. At that stage, there may be two targets, or the target may widen to a small zone.
DAILY CHART – ZIGZAG
Click chart to enlarge.
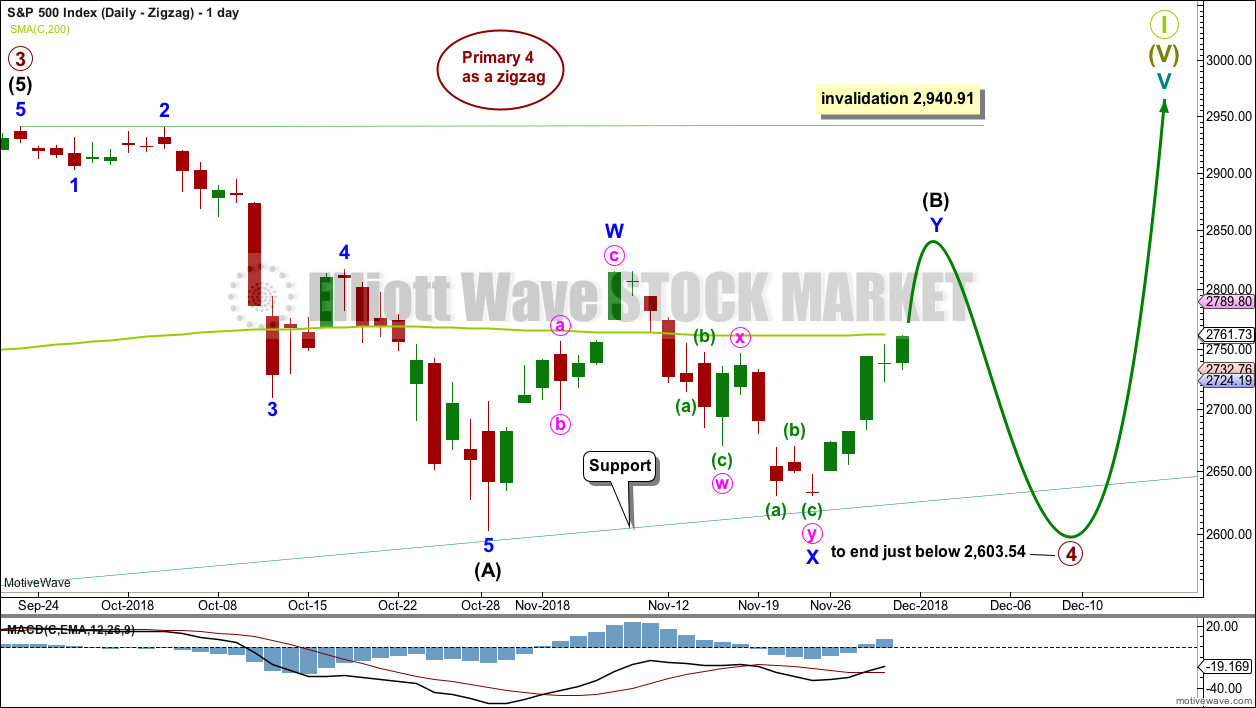
Primary wave 4 may be unfolding as a single zigzag, which is the most common type of corrective structure. This would provide perfect alternation with the flat correction of primary wave 2.
Within the zigzag, intermediate wave (B) may be continuing higher as a double zigzag. Intermediate wave (B) may not move beyond the start of intermediate wave (A) above 2,940.91.
The probability of this wave count is reduced. If intermediate wave (B) is incomplete and intermediate wave (C) has not begun, then this wave count now requires a few more weeks for the structure to complete. If it can do so in just three or four weeks, it may be acceptable.
The longer intermediate wave (B) lasts, the greater the overshoot of the teal trend line required for intermediate wave (C) to move below the end of intermediate wave (A) to avoid a truncation. The probability of this wave count is further reduced for this reason.
DAILY CHART – TRIANGLE
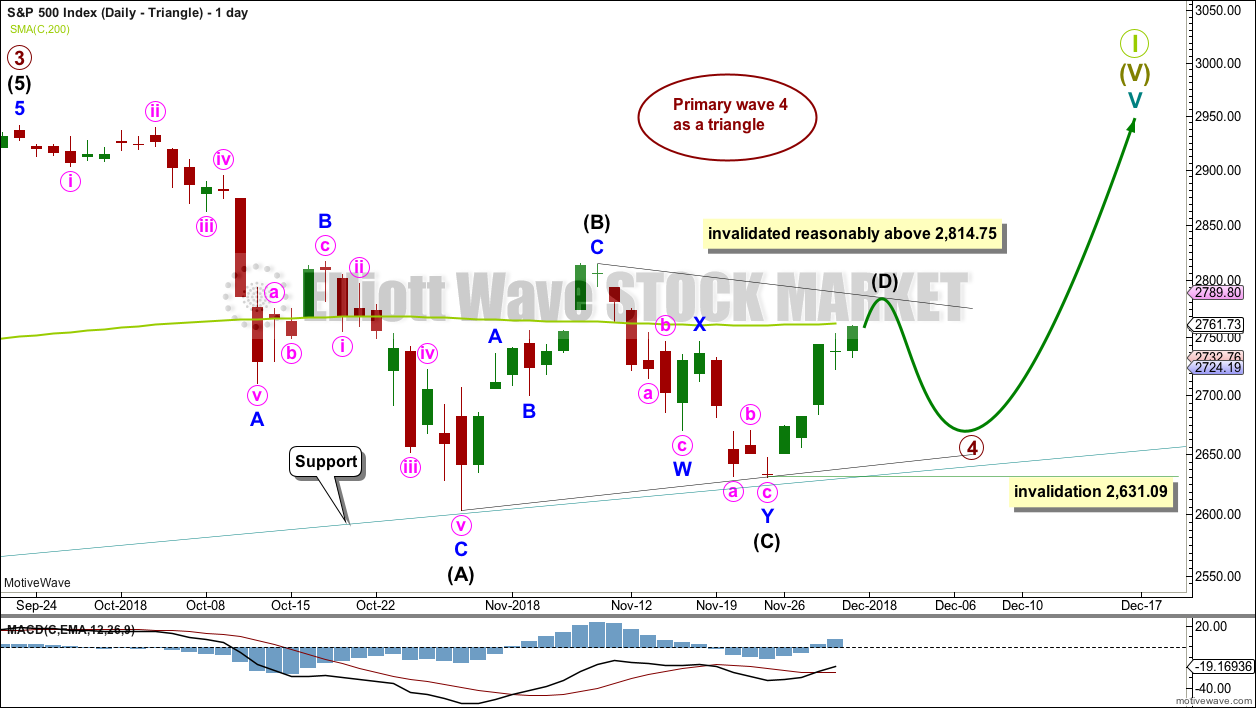
Click chart to enlarge.
If primary wave 4 unfolds as a triangle, it would have perfect alternation with the regular flat correction of primary wave 2. It would also continue to find support about the lower edge of the teal trend channel. Triangles are fairly common structures for fourth waves.
The triangle is relabelled to see intermediate waves (A), (B) and (C) now all complete. Intermediate wave (B) is shorter than B waves of triangles usually are; this gives the triangle an odd look. However, considering the duration of primary wave 4 so far, this labelling now makes more sense.
Intermediate wave (C) may have completed as a double zigzag. This is the most common triangle sub-wave to subdivide as a multiple.
Price has bounced up off the lower edge of the teal trend channel.
If the triangle is a regular contracting triangle, which is the most common type, then intermediate wave (D) may not move beyond the end of intermediate wave (B) above 2,814.75.
If the triangle is a regular barrier triangle, then intermediate wave (D) may end about the same level as intermediate wave (B). As long as the (B)-(D) trend line remains essentially flat a triangle would remain valid. This invalidation point is not exact; intermediate wave (D) can end very slightly above 2,814.75.
The final wave down for intermediate wave (E) may not move beyond the end of intermediate wave (C) below 2,631.09.
This wave count could see a triangle complete in another four to five weeks, which would see primary wave 4 last a total of 14 or so weeks. This would be reasonably in proportion to the triangle for intermediate wave (4) one degree lower, and this would be acceptable.
This wave count would also see the lower edge of the teal trend channel continue to provide support. This would give the wave count the right look at the weekly and monthly chart levels.
DAILY CHART – COMBINATION
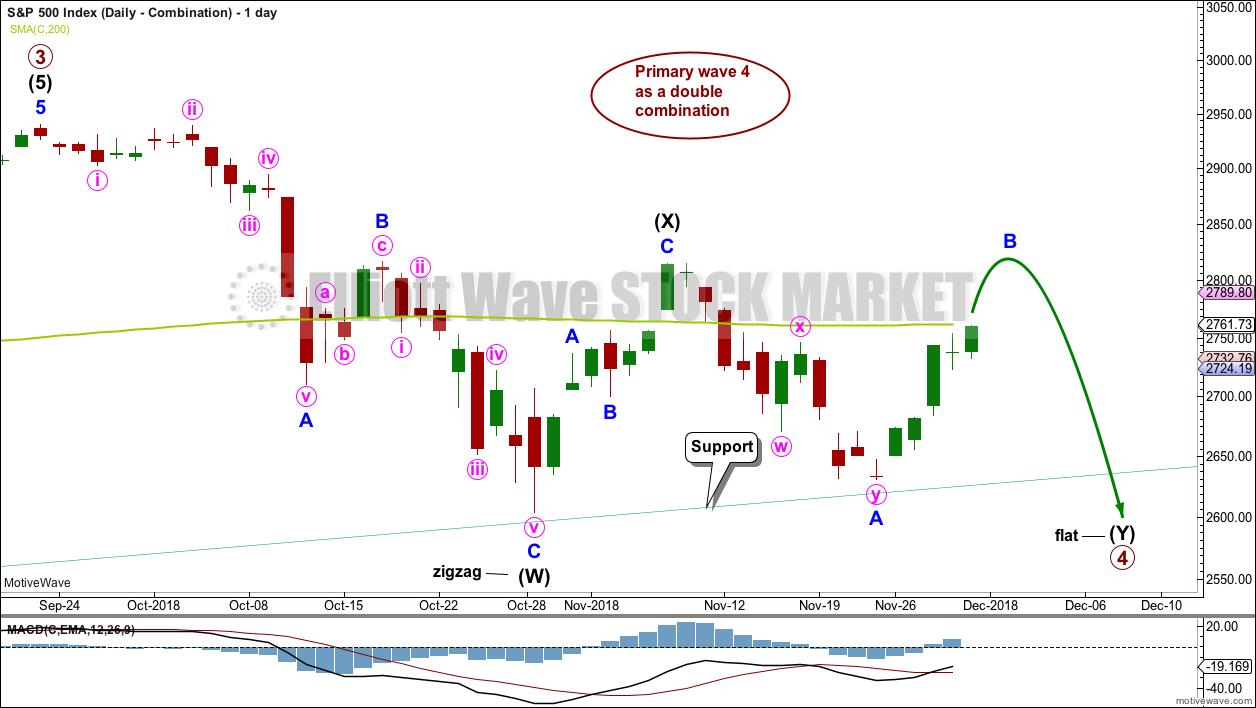
Click chart to enlarge.
This wave count is judged to have only a slightly lower probability than the triangle. If this wave count is correct, then primary wave 4 may be a few weeks longer in duration than primary wave 2. This wave count now has a problem of proportion.
Primary wave 4 may be unfolding as a double combination. The first structure in the double may be a complete zigzag labelled intermediate wave (W). The double may be joined by a three in the opposite direction labelled intermediate wave (X). Intermediate wave (X) may be complete as a single zigzag; it is deep at 0.63 the length of intermediate wave (W), which looks reasonable.
Intermediate wave (Y) would most likely be a flat correction, which should subdivide 3-3-5. At its end, it would now require a reasonable overshoot of the lower edge of the teal trend channel. This further reduces the probability of this wave count.
Within the flat correction of intermediate wave (Y), minor wave B must retrace a minimum 0.9 length of minor wave A at 2,796.74. The common range for minor wave B is from 1 to 1.38 times the length of minor wave A giving a range from 2,815.15 to 2,885.09. Minor wave B may make a new high above the start of minor wave A at 2,815.15 as in an expanded flat.
TECHNICAL ANALYSIS
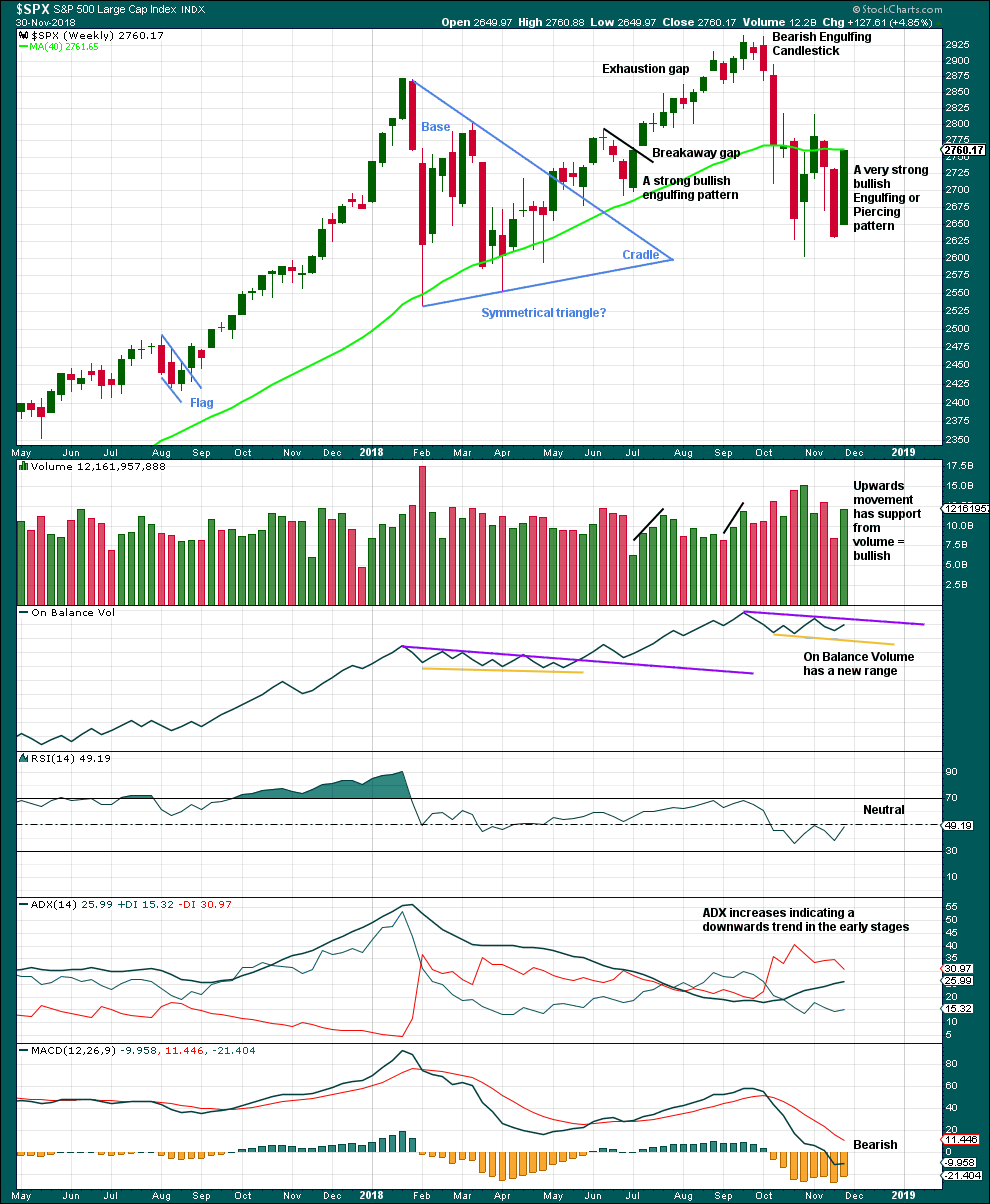
WEEKLY CHART
Click chart to enlarge. Chart courtesy of StockCharts.com.
A Bullish Engulfing candlestick pattern requires the second candlestick to open below the low of the first candlestick. This week’s candlestick opens above the low of last week’s candlestick. However, the most important aspect of an Engulfing pattern is the close of the second candlestick. Here, this week’s candlestick has closed well above the open of last week’s candlestick. This is very bullish.
This candlestick is neither correctly an engulfing nor piercing pattern, but the close is very bullish. It will be read as a bullish reversal pattern.
With support from volume, this weekly candlestick is very bullish. This supports the main Elliott wave count. This does not look like a B wave nor a D wave within a triangle.
DAILY CHART
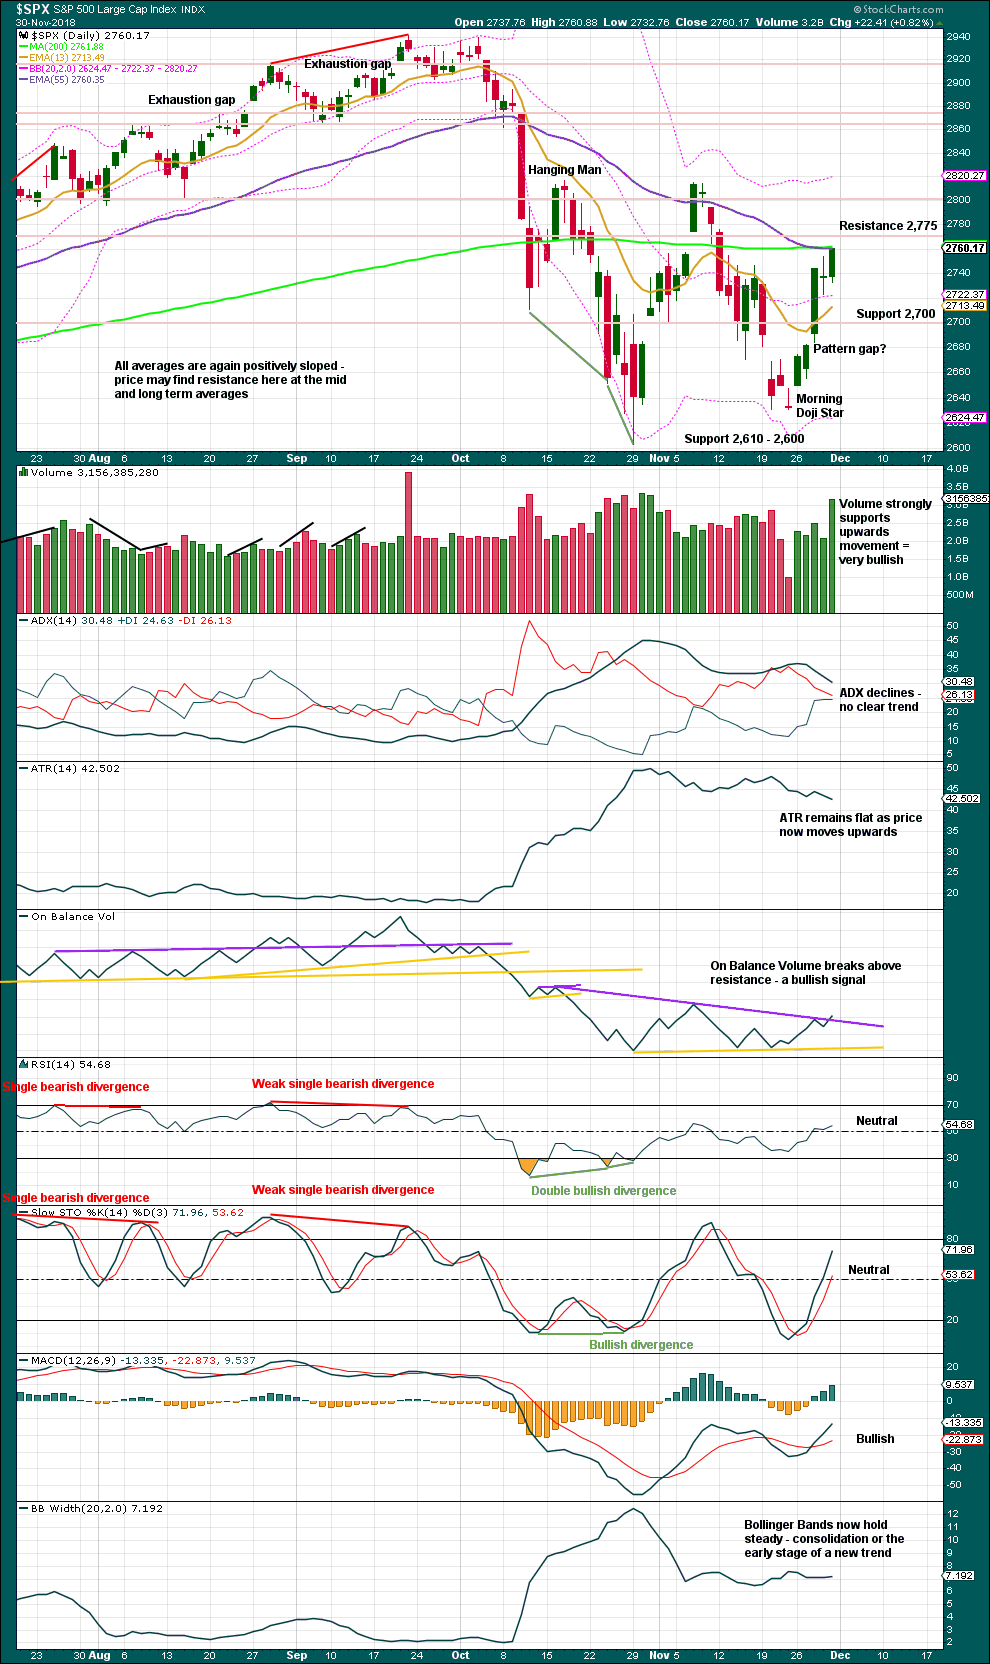
Click chart to enlarge. Chart courtesy of StockCharts.com.
The lower edge of the teal trend channel is not shown on this chart, but it should be considered as part of this technical analysis. Expect that trend line to continue to provide support, until it does not.
The strongest pieces of technical analysis on this chart are strong volume for Friday and a bullish signal from On Balance Volume. This offers reasonable support to the main Elliott wave count, and puts strong doubt on the alternate daily wave counts. This does not look at all like a B wave; B waves should exhibit clear weakness.
BREADTH – AD LINE
WEEKLY CHART
Click chart to enlarge. Chart courtesy of StockCharts.com. So that colour blind members are included, bearish signals
will be noted with blue and bullish signals with yellow.
Both price and the AD line have moved higher this week. Upwards movement has support from rising market breadth. There is no short-term divergence.
All of small, mid and large caps are moving higher. Upwards movement has broad market support.
DAILY CHART
Click chart to enlarge. Chart courtesy of StockCharts.com. So that colour blind members are included, bearish signals
will be noted with blue and bullish signals with yellow.
There is normally 4-6 months divergence between price and market breadth prior to a full fledged bear market. This has been so for all major bear markets within the last 90 odd years. With no longer-term divergence yet at this point, any decline in price should be expected to be a pullback within an ongoing bull market and not necessarily the start of a bear market. New all time highs from the AD line on the 29th of August means that the beginning of any bear market may be at the end of December 2018, but it may of course be a lot longer than that.
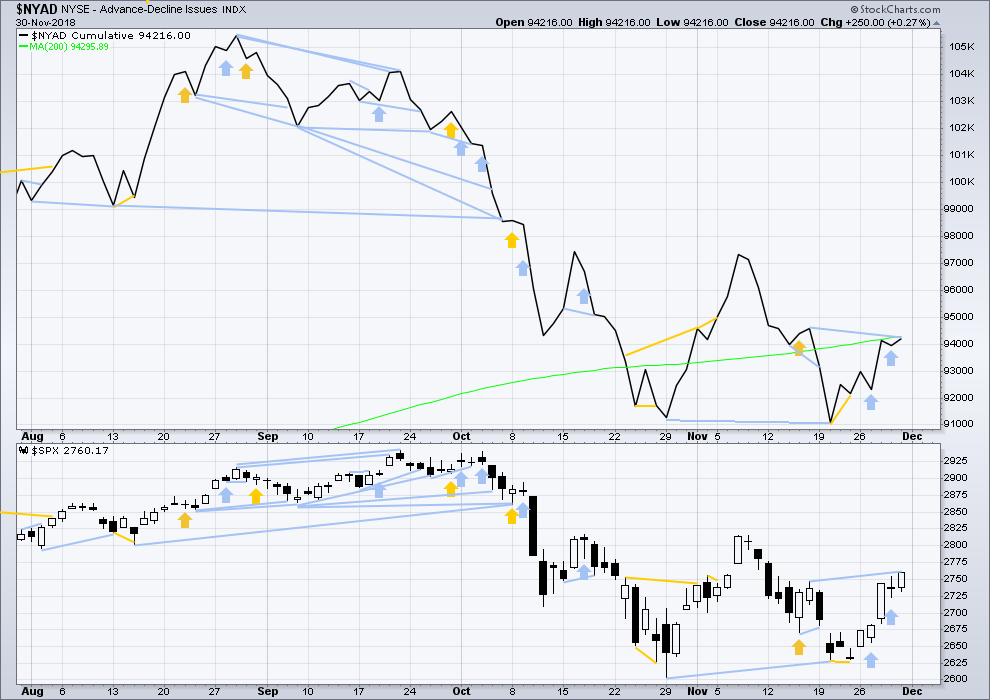
Breadth should be read as a leading indicator.
Price has made a slight new high above the prior swing high of the 16th of November, but the AD line has not. This short-term divergence is bearish.
However, in context of a fifth wave at three large degrees unfolding some bearish signals may now be expected to begin to accumulate. This divergence is bearish, but will not be read as immediately so.
VOLATILITY – INVERTED VIX CHART
WEEKLY CHART
Click chart to enlarge. Chart courtesy of StockCharts.com. So that colour blind members are included, bearish signals
will be noted with blue and bullish signals with yellow.
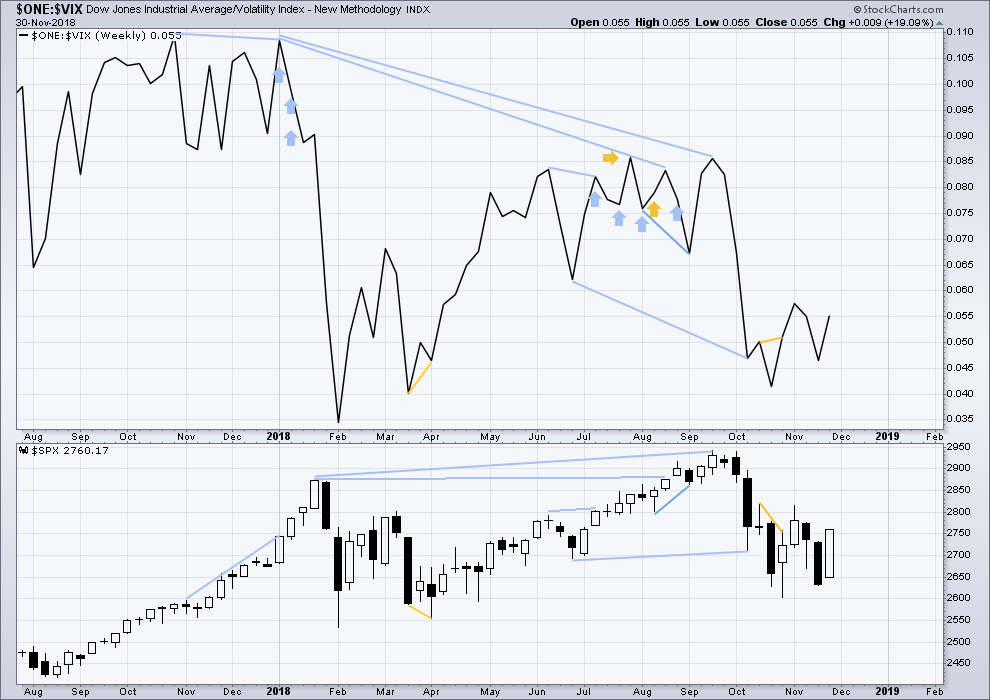
Both price and inverted VIX have moved higher this week. There is no short-term divergence.
DAILY CHART
Click chart to enlarge. Chart courtesy of StockCharts.com. So that colour blind members are included, bearish signals
will be noted with blue and bullish signals with yellow.
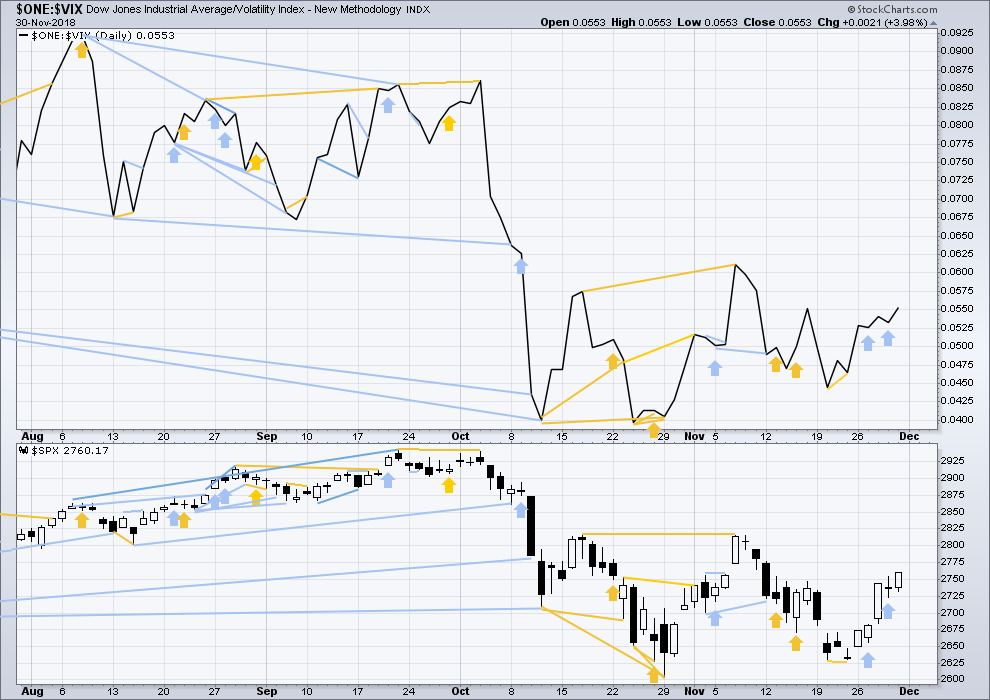
Normally, volatility should decline as price moves higher and increase as price moves lower. This means that normally inverted VIX should move in the same direction as price.
Like the AD line, inverted VIX may now begin to accumulate instances of bearish signals or divergence as a fifth wave at three large degrees comes to an end.
Both price and inverted VIX have moved higher on Friday, and both have made new short-term swing highs above the prior swing high of the 16th of November. There is no short-term divergence.
DOW THEORY
All of DJIA, DJT, Nasdaq and the S&P are moving higher this week.
The following lows need to be exceeded for Dow Theory to confirm the end of the bull market and a change to a bear market:
DJIA: 23,344.52.
DJT: 9,806.79.
S&P500: 2,532.69.
Nasdaq: 6,630.67.
GOLD
A small range week leaves all Elliott wave counts valid. The target on the preferred Elliott wave count remains the same.
Summary: The upwards trend may now resume. The target remains the same at 1,295.
The final target for this bounce to end is about 1,305 – 1,310.
Grand SuperCycle analysis is here.
Last historic analysis with monthly charts is here.
There are four remaining weekly wave counts at this time for cycle wave b: a triangle, a flat, a combination, and a double zigzag.
At this time, the Triangle wave count may again be slightly more likely.
MAIN ELLIOTT WAVE COUNT
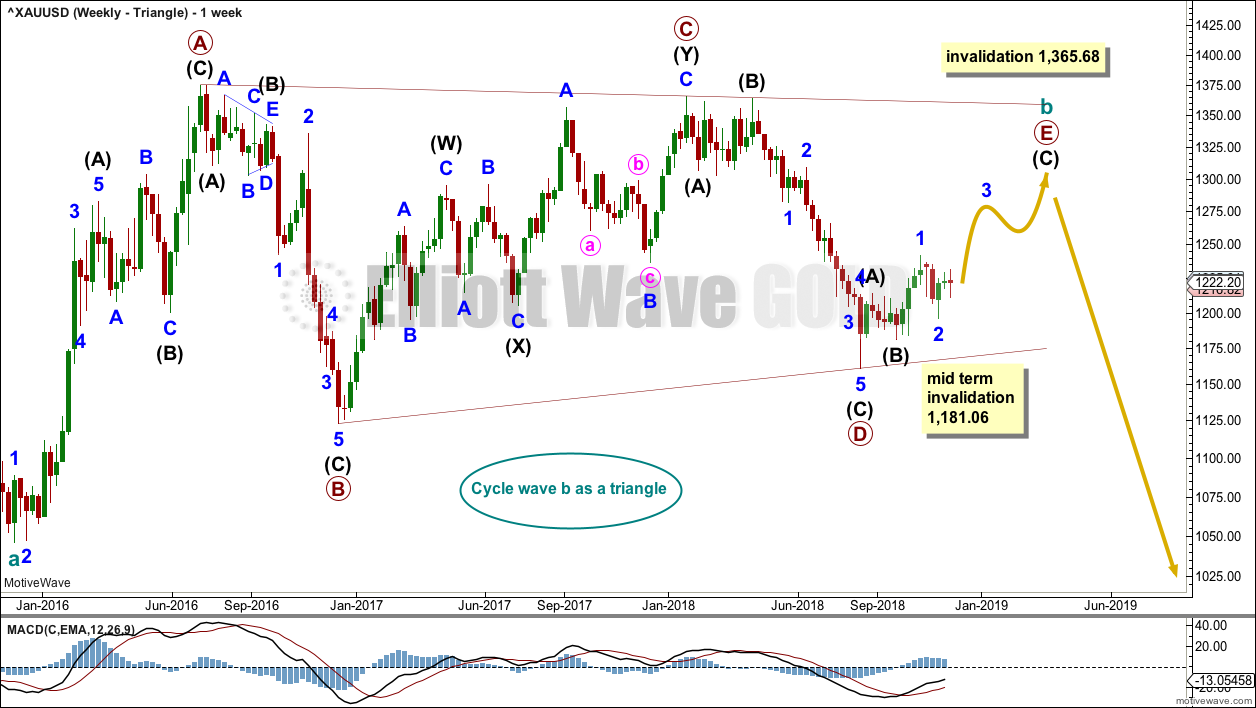
WEEKLY CHART – TRIANGLE
Click chart to enlarge.
Cycle wave b may be an incomplete regular contracting triangle. Primary wave E may not move beyond the end of primary wave C above 1,365.68.
Within primary wave E, intermediate waves (A) and (B) may be complete. Intermediate wave (C) must subdivide as a five wave structure. Within intermediate wave (C), minor wave 2 may not move beyond the start of minor wave 1 below 1,181.06.
Four of the five sub-waves of a triangle must be zigzags, with only one sub-wave allowed to be a multiple zigzag. Wave C is the most common sub-wave to subdivide as a multiple, and this is how primary wave C for this example fits best. Primary wave E would most likely be a single zigzag. It is also possible that it may subdivide as a triangle to create a rare nine wave triangle.
There are no problems in terms of subdivisions or rare structures for this wave count. It has an excellent fit and so far a typical look.
When primary wave E is a complete three wave structure, then this wave count would expect a cycle degree trend change. Cycle wave c would most likely make new lows below the end of cycle wave a at 1,046.27 to avoid a truncation.
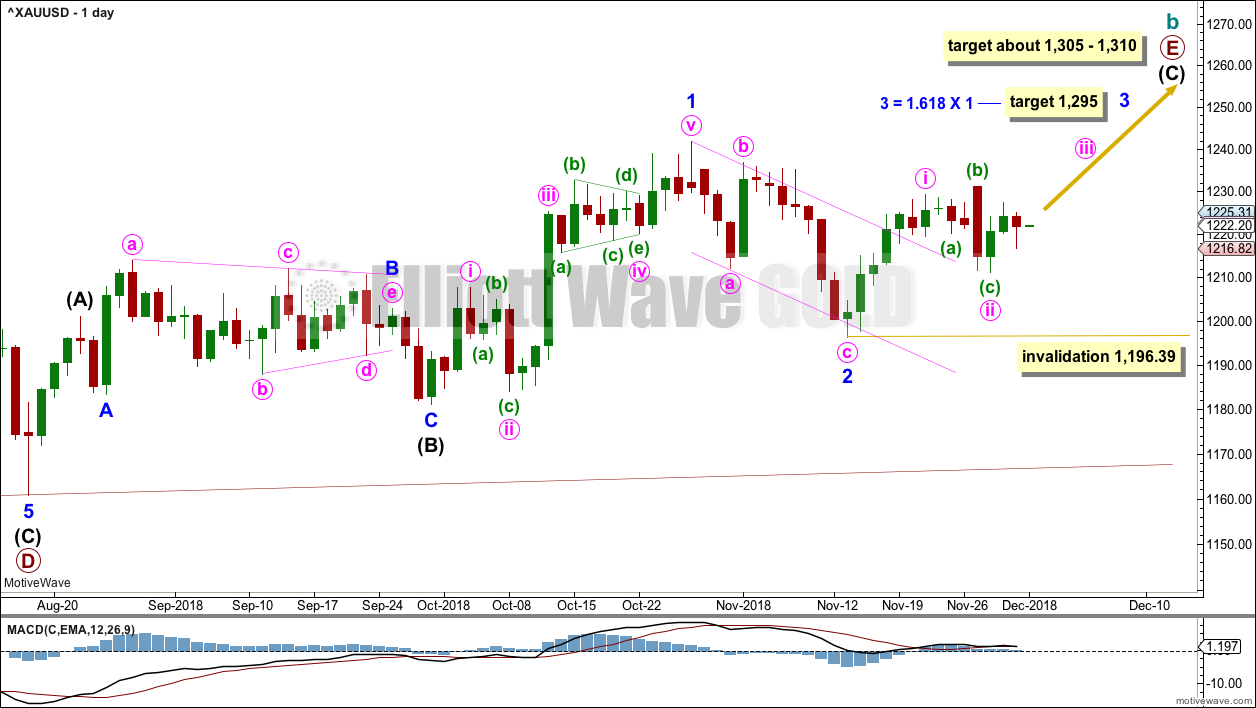
DAILY CHART – TRIANGLE
Click chart to enlarge.
Primary wave E should now be underway for this wave count.
Primary wave E should subdivide as a zigzag. Intermediate waves (A) and (B) may now be complete. Intermediate wave (C) may have begun.
Minor wave 1 fits perfectly as a five wave impulse. Minor wave 2 may now be complete as a deep zigzag. Minor wave 3 may now exhibit an increase in upwards momentum, and it should have support from volume. The target for minor wave 3 expects it to exhibit a common Fibonacci ratio to minor wave 1.
Minor wave 3 may only subdivide as an impulse. Within minor wave 3, minute wave ii may not move beyond the start of minute wave i below 1,196.39.
A target for primary wave E is the strong zone of resistance about 1,305 to 1,310. Primary wave E is most likely to subdivide as a zigzag (although it may also subdivide as a triangle to create a rare nine wave triangle). It may last a total Fibonacci 21 or 34 weeks. So far it has lasted 13 weeks. Primary wave E may not move beyond the end of primary wave C above 1,365.68.
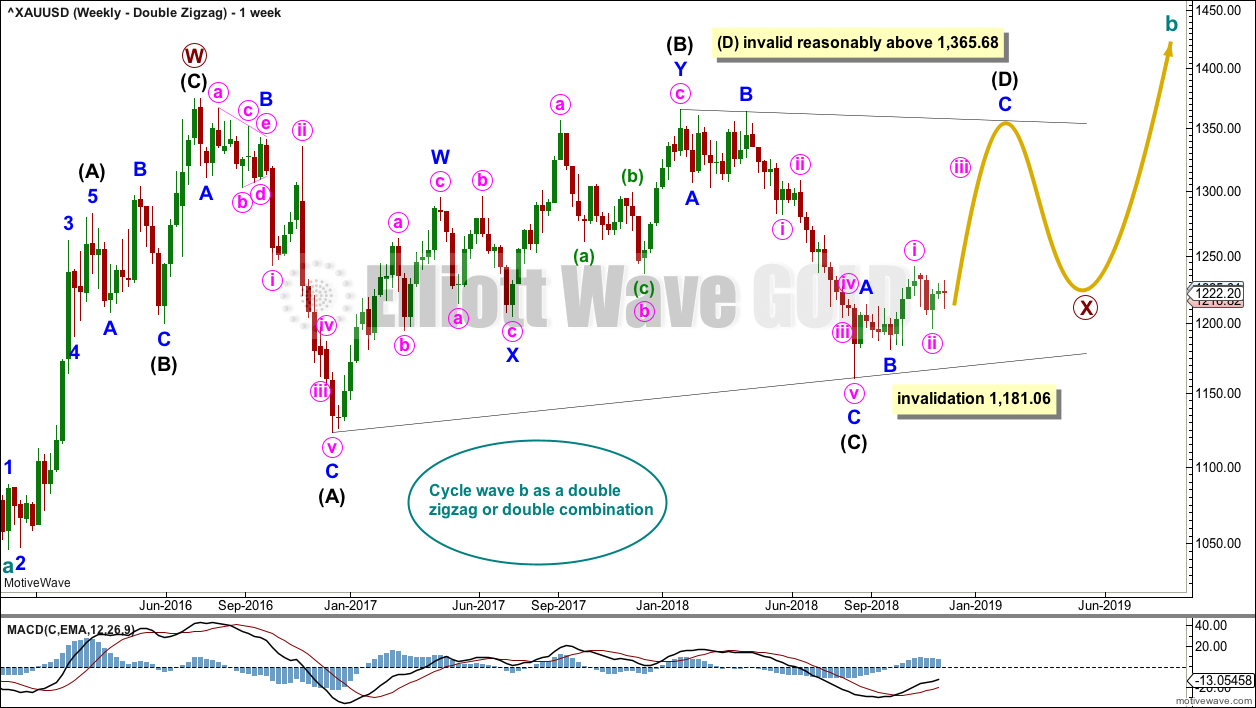
WEEKLY CHART – DOUBLE ZIGZAG
Click chart to enlarge.
It is possible that cycle wave b may be a double zigzag or a double combination.
The first zigzag in the double is labelled primary wave W. This has a good fit.
The double may be joined by a corrective structure in the opposite direction, a triangle labelled primary wave X. The triangle would be about three quarters complete.
Within the triangle of primary wave X, intermediate wave (C) should be complete. Within intermediate wave (D), minor waves A and B may be complete. Minor wave C must subdivide as a five wave structure. Within minor wave C, minute wave ii may not move beyond the start of minute wave i below 1,181.06.
Intermediate wave (D) would most likely subdivide as a single zigzag.
This wave count may now expect choppy overlapping movement in an ever decreasing range for several more months.
Primary wave Y would most likely be a zigzag because primary wave X would be shallow; double zigzags normally have relatively shallow X waves.
Primary wave Y may also be a flat correction if cycle wave b is a double combination, but combinations normally have deep X waves. This would be less likely.
This wave count has good proportions and no problems in terms of subdivisions.
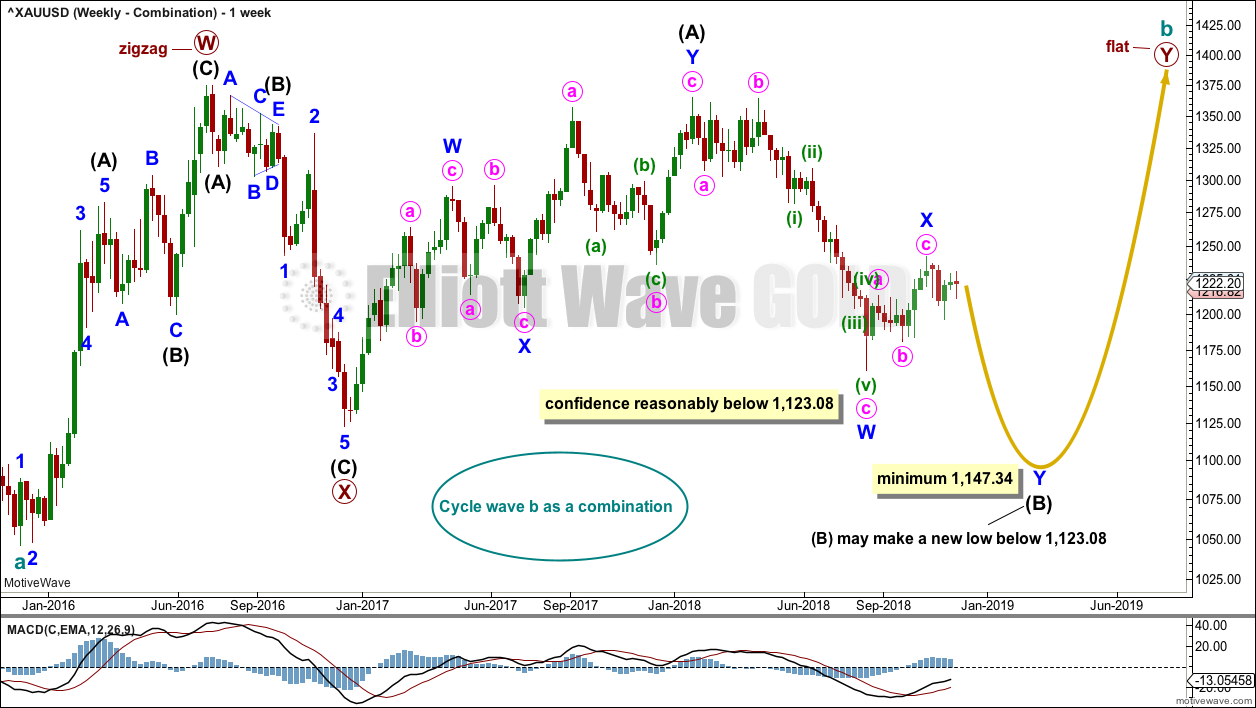
WEEKLY CHART – COMBINATION
Click chart to enlarge.
If cycle wave b is a combination, then the first structure in a double may be a complete zigzag labelled primary wave W.
The double may be joined by a three in the opposite direction, a zigzag labelled primary wave X.
The second structure in the double may be a flat correction labelled primary wave Y. My research on Gold so far has found that the most common two structures in a double combination are one zigzag and one flat correction. I have found only one instance where a triangle unfolded for wave Y. The most likely structure for wave Y would be a flat correction by a very wide margin, so that is what this wave count shall expect.
Within a flat correction for primary wave Y, the current downwards wave of intermediate wave (B) may be a double zigzag. Intermediate wave (B) must retrace a minimum 0.9 length of intermediate wave (A) at 1,147.34. Intermediate wave (B) may move beyond the start of intermediate wave (A) as in an expanded flat.
Because the minimum requirement for intermediate wave (B) is not yet met, this wave count requires that intermediate wave (B) continues lower. This is the most immediately bearish of all four weekly wave counts.
When intermediate wave (B) is complete, then intermediate wave (C) would be expected to make at least a slight new high above the end of intermediate wave (A) at 1,365.68 to avoid a truncation. Primary wave Y would be most likely to end about the same level as primary wave W at 1,374.91, so that the whole structure takes up time and moves price sideways, as that is the purpose of double combinations.
While double combinations are very common, triples are extremely rare. I have found no examples of triple combinations for Gold at daily chart time frames or higher back to 1976. When the second structure in a double is complete, then it is extremely likely (almost certain) that the whole correction is over.
DAILY CHART – COMBINATION
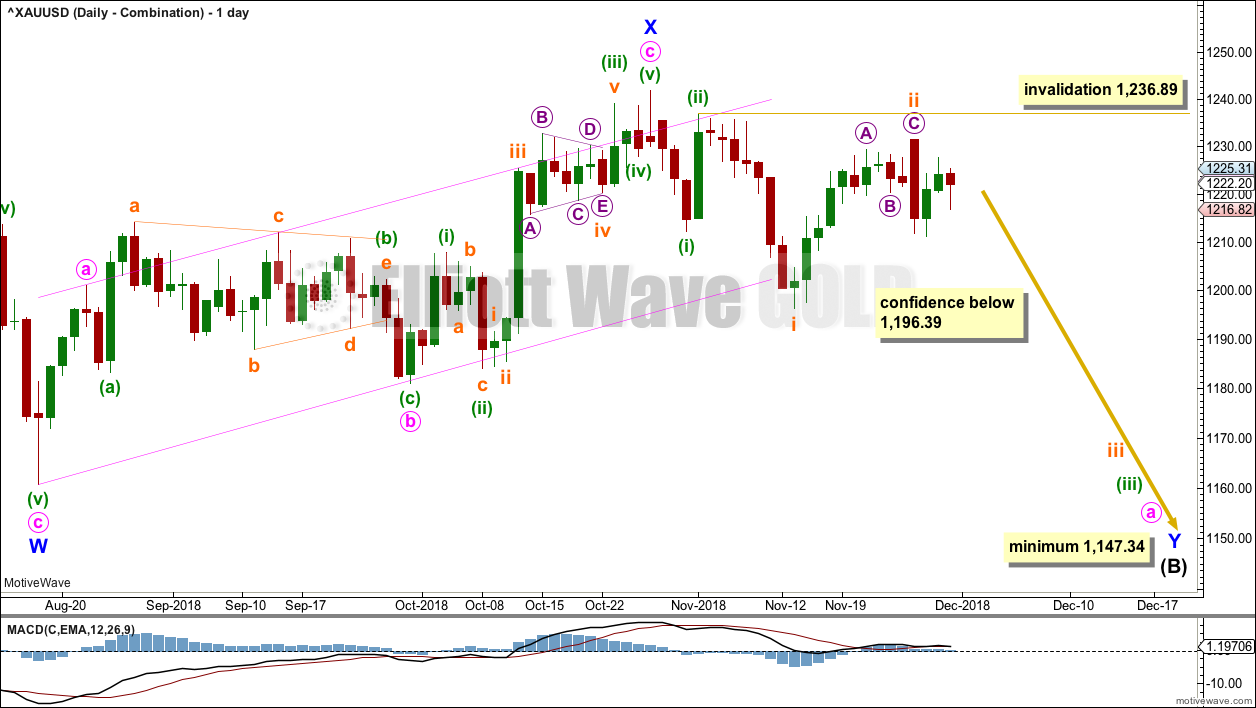
Click chart to enlarge.
Minor wave X may be complete.
Minor wave Y may be underway for this wave count to continue lower to a minimum at 1,147.34. Minor wave Y may last a few weeks.
A new low below 1,196.39 would provide confidence in this wave count.
Within minor wave Y, minute wave a would be an incomplete five wave impulse. Within minute wave a, minuette waves (i) and (ii) may be complete. Minuette wave (iii) may only subdivide as an impulse.
Within minuette wave (iii), subminuette wave i may be complete. Subminuette wave ii may not move beyond the start of subminuette wave i above 1,236.89.
WEEKLY CHART – FLAT

Click chart to enlarge.
It is possible that cycle wave b may be a flat correction. Within a flat correction, primary wave B must retrace a minimum 0.9 length of primary wave A at 1,079.13 or below. Primary wave B may make a new low below the start of primary wave A at 1,046.27 as in an expanded flat correction.
Only a new low reasonably below 1,123.08 would provide reasonable confidence in this wave count.
Intermediate wave (C) must subdivide as a five wave structure; it may be unfolding as an impulse. Within intermediate wave (C), minor waves 1 through to 4 may be complete. Within minor wave 5, no second wave correction may move beyond its start above 1,241.88.
The blue channel is drawn using Elliott’s second technique. Minor wave 5 may end at support about the lower edge of this channel.
Minor wave 2 was a double zigzag lasting nine weeks. Minor wave 4 exhibits little alternation as a single zigzag and reasonable proportion lasting ten weeks.
The start of this weekly candlestick is now overshooting the blue Elliott channel drawn about intermediate wave (C). If intermediate wave (C) is continuing lower, then this channel should not be breached by upwards movement. This wave count no longer looks right.
TECHNICAL ANALYSIS
WEEKLY CHART
Click chart to enlarge. Chart courtesy of StockCharts.com.
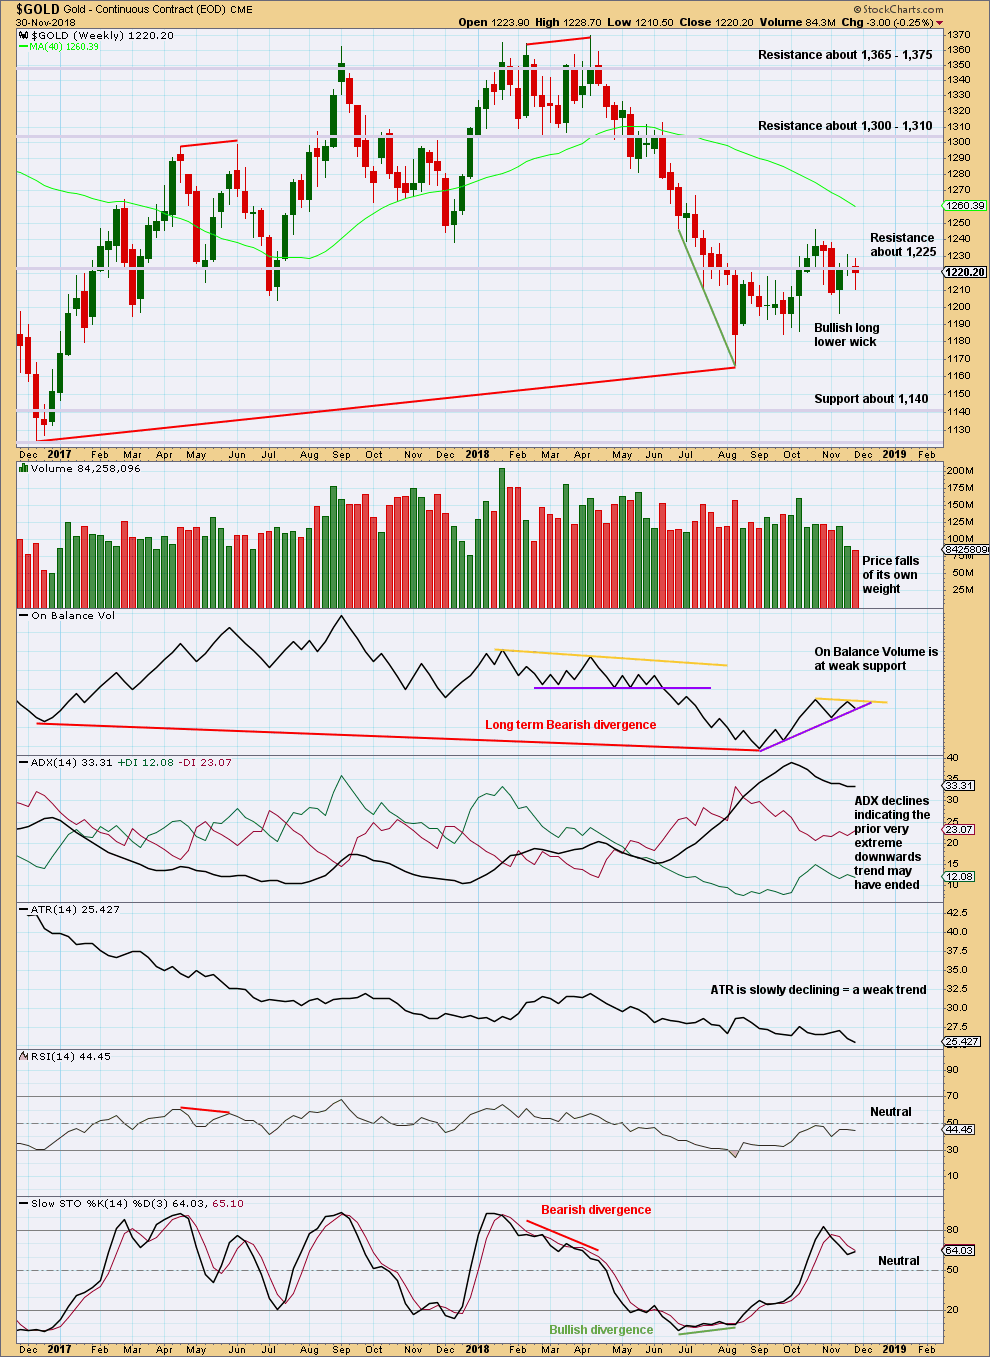
On Balance Volume has made a lower low than its prior low at the end of November 2015. This divergence is extremely bearish but does not rule out a consolidation unfolding here; the divergence does strongly support the Triangle wave count, which expects a consolidation or bounce up to test resistance now and then a continuation of a major bear market. It could also support the flat wave count that allows for a new low below 1,046.27 in coming months.
This weekly candlestick is weak, but the long lower wick suggests upwards movement next week.
The support line for On Balance Volume is weak because it has a strong slope, but it may provide support. A break below it would be only a weak bearish signal; the line may have to then be redrawn.
DAILY CHART
Click chart to enlarge. Chart courtesy of StockCharts.com.
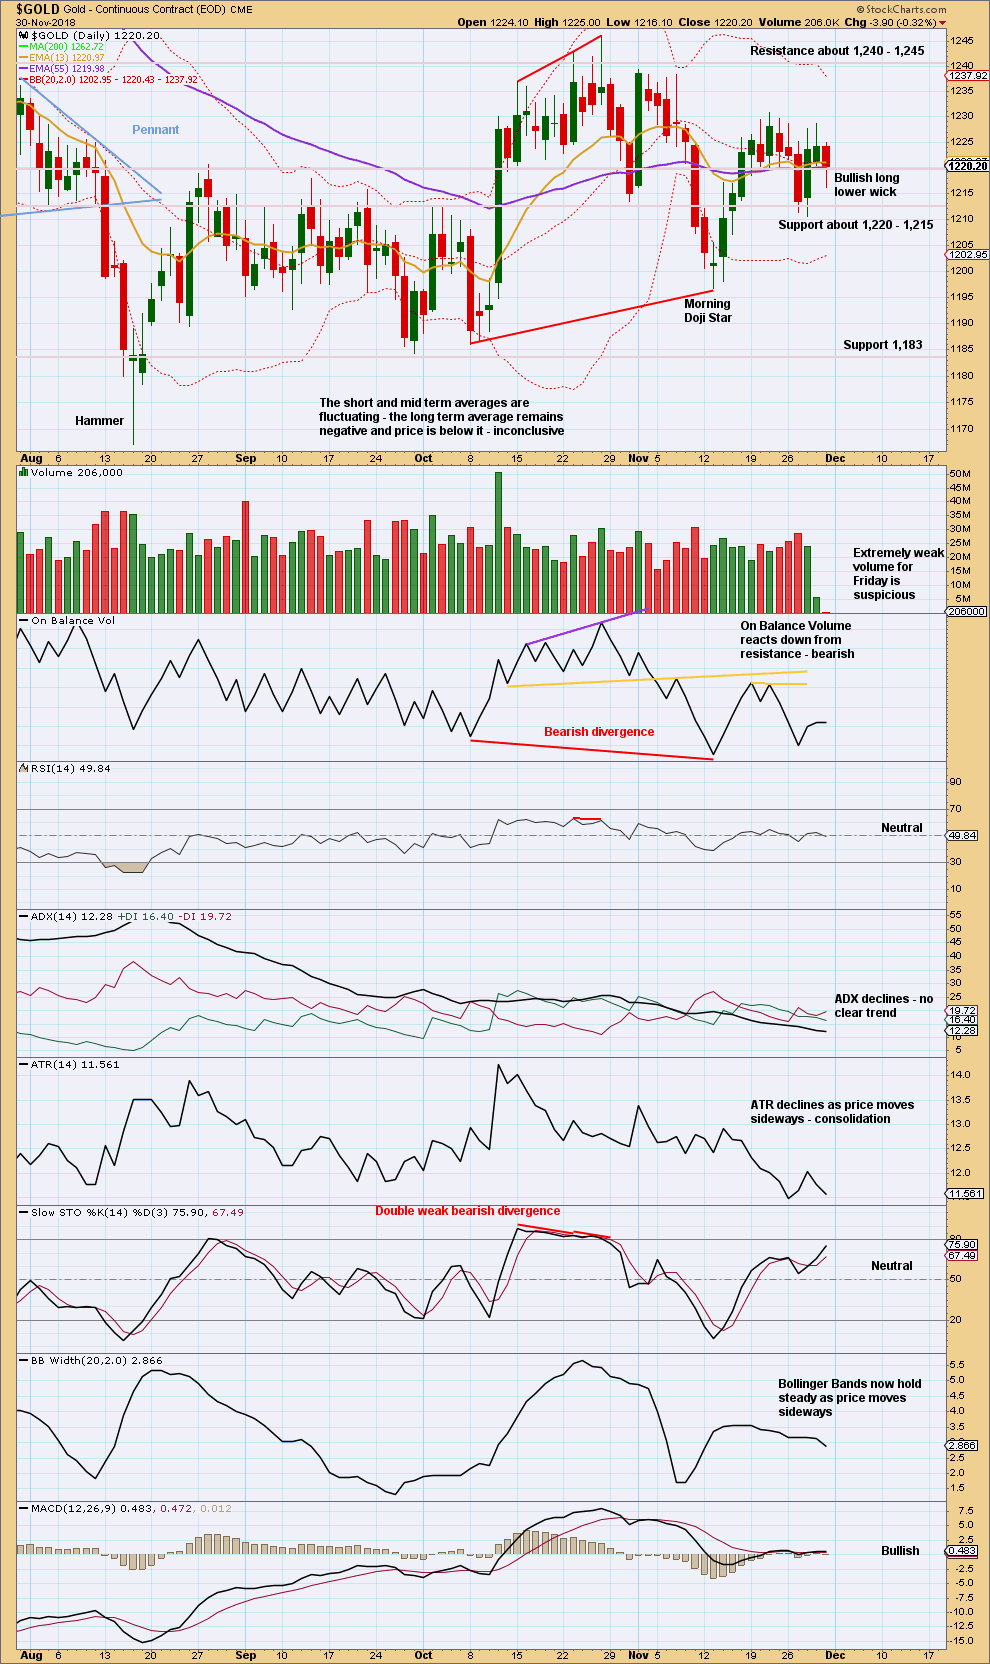
Gold may be within a larger consolidation with resistance about 1,240 – 1,245 and support about 1,195 – 1,183. Price is swinging from resistance to support and back again, with Stochastics reaching overbought when price reached resistance and oversold when price reached support.
Currently, price is bouncing up off support which was found about 1,195. Look for overall upwards movement to continue towards 1,240 – 1,245 and only stop when Stochastics reaches overbought. Do not expect price to move in a straight line.
Price is still not at resistance and Stochastics is still not overbought. It is still expected to see price overall continue higher.
GDX WEEKLY CHART
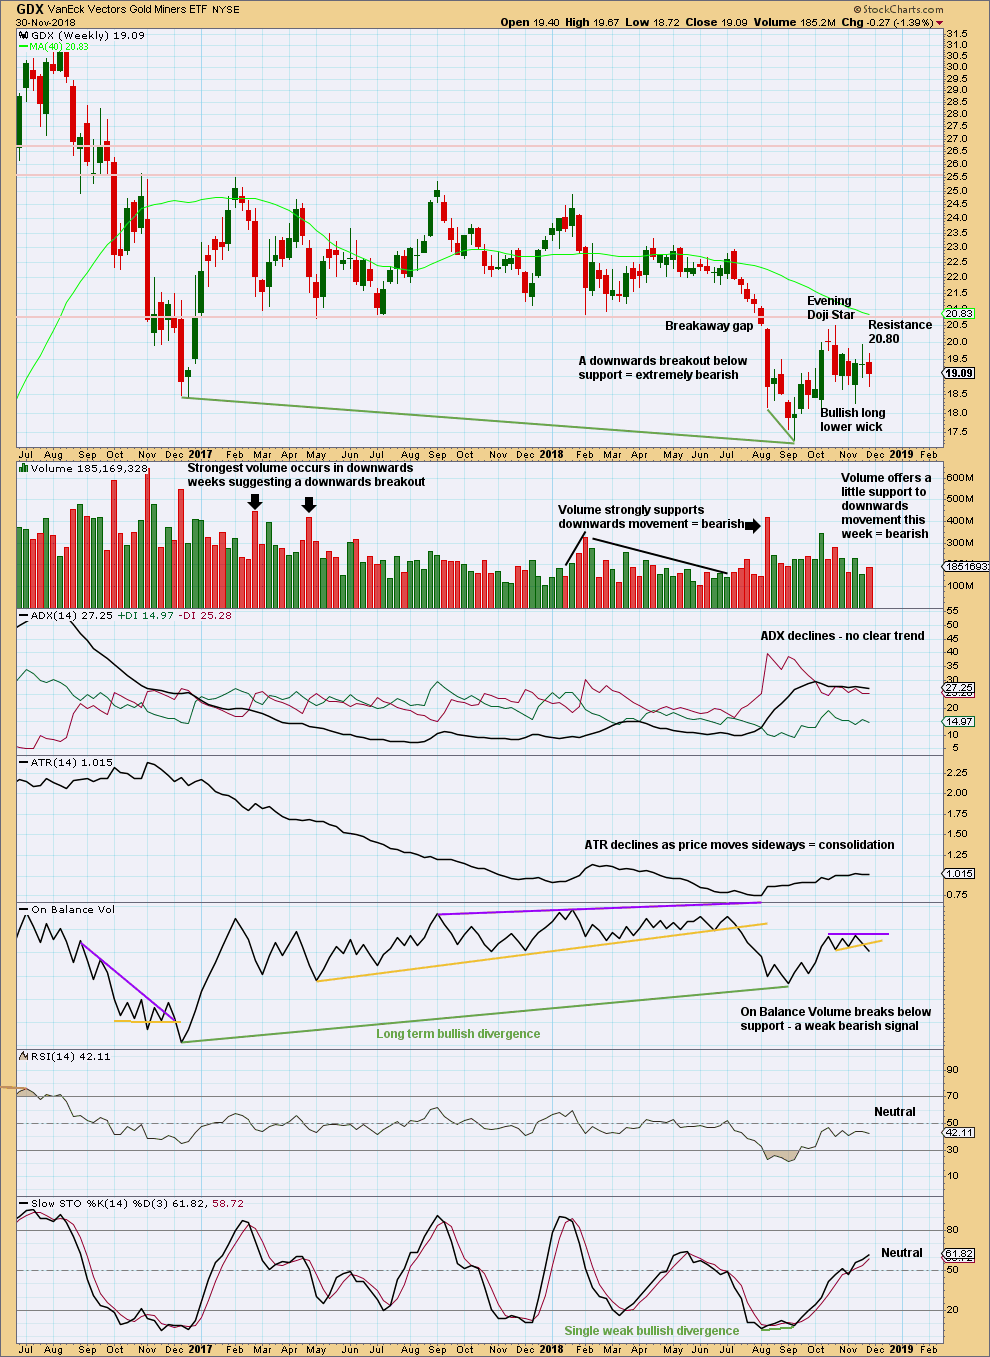
Click chart to enlarge. Chart courtesy of StockCharts.com.
GDX had a large consolidation that lasted from January 2017 to August 2018. A downwards breakout below support at 20.80 in early August 2018 is highly significant. The breakout had support from volume, which adds confidence.
The target is at 16.02.
It looks again like the bounce may be complete. GDX this week has a bearish volume profile and a bearish signal from On Balance Volume.
GDX DAILY CHART
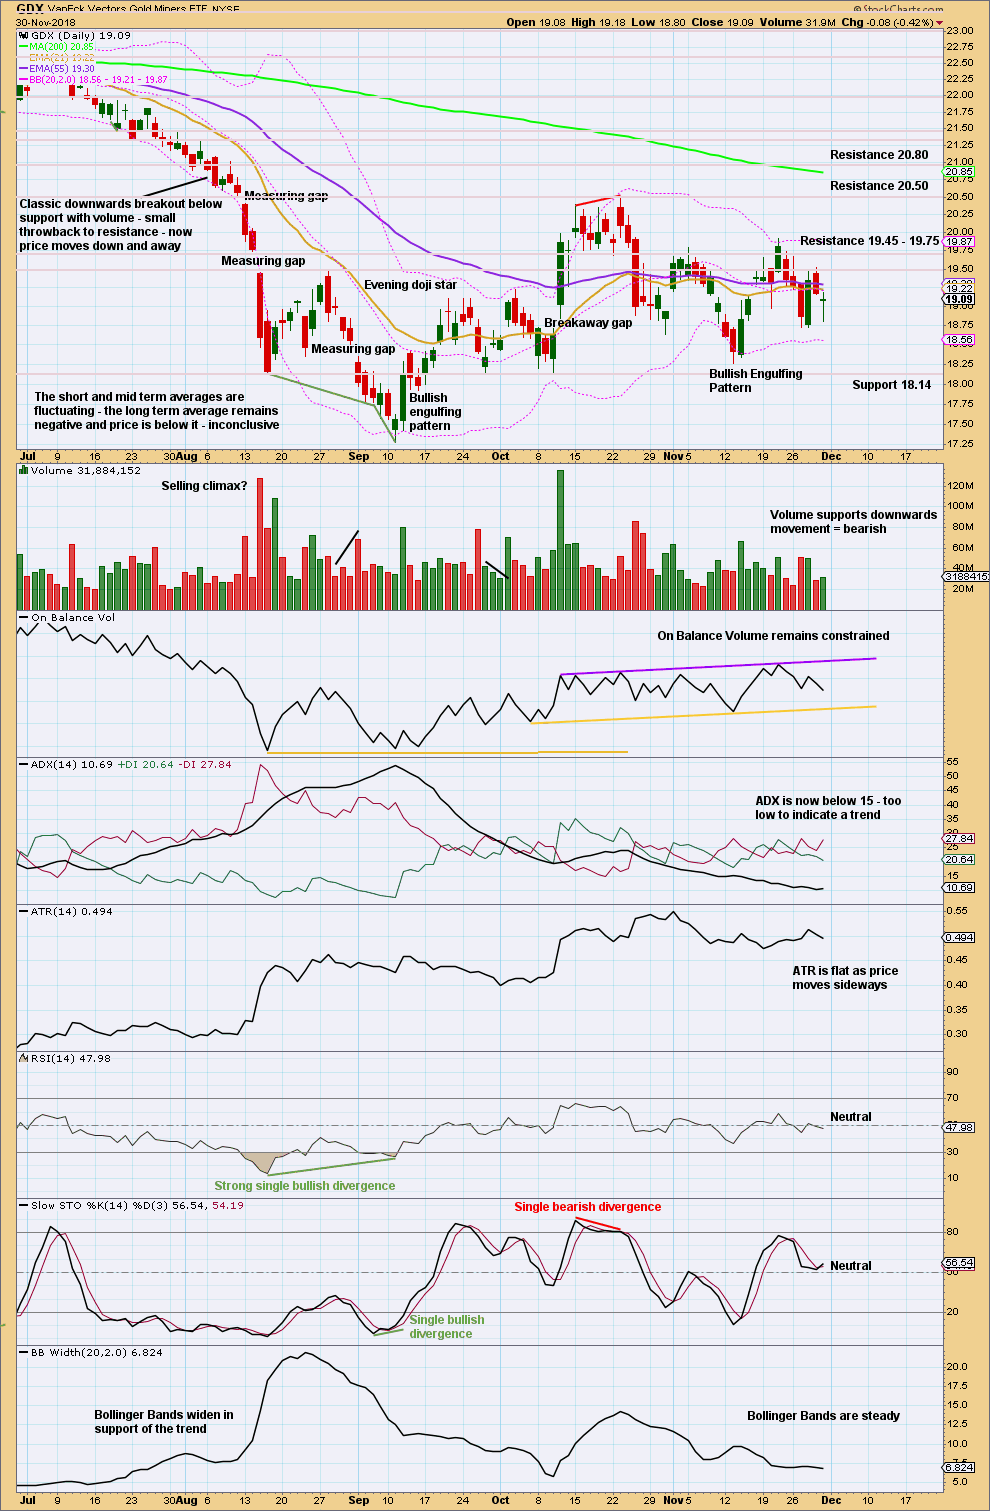
Click chart to enlarge. Chart courtesy of StockCharts.com.
At the daily chart level, price is now within a consolidation that is bound by resistance above at 20.50 and support below at 18.14. It is the upwards day of the 11th of October that has strongest volume during this consolidation, suggesting an upwards breakout may be more likely than downwards. This technique does not always work, but it does work more often than it fails.
However, if price does break above 20.50, then it would be extremely likely to find very strong resistance just above at 20.80 and halt there. At a higher time frame that would look like a classic back test of resistance at prior support, identified on the weekly chart. If price does behave like that, it would offer a high probability low risk set up for a short position on GDX that may be held for the long term.
A breakout above 19.75 or below 18.14 is needed for short-term clarity.
US OIL
Downwards movement has continued for the week as expected. The target remains the same.
Summary: Oil is in a downwards trend. The probability that Oil may continue to move reasonably below 26.06 has increased.
Trends do not move in straight lines. There will be bounces and consolidations along the way. Look for a candlestick reversal pattern on the daily chart, or a breach of the narrow channel, to signal the first multi-week bounce or consolidation for a second wave. The target for this to begin is at 46.80.
MAIN ELLIOTT WAVE COUNT
MONTHLY CHART
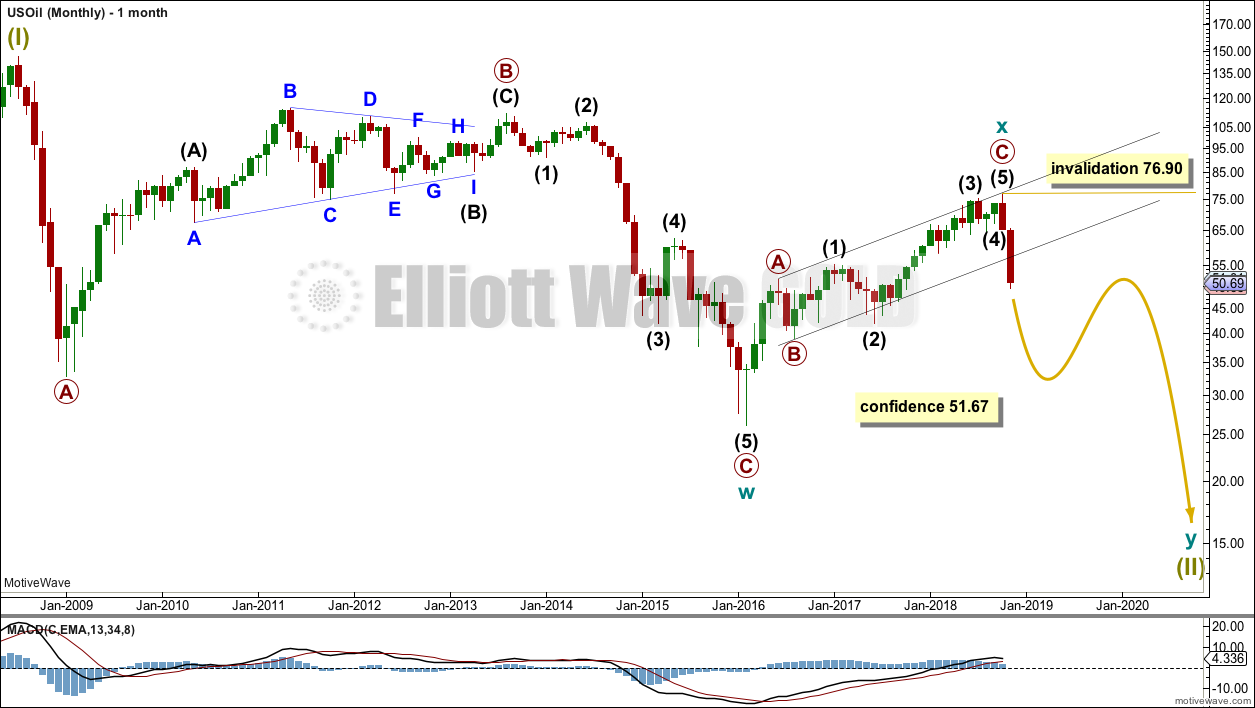
Click chart to enlarge.
Classic technical analysis favours a bearish wave count for Oil at this time.
The large fall in price from the high in June 2008 to February 2016 is seen as a complete three wave structure. This large zigzag may have been only the first zigzag in a deeper double zigzag.
The first zigzag down is labelled cycle wave w. The double is joined by a now complete three in the opposite direction, a zigzag labelled cycle wave x.
The purpose of a second zigzag in a double is to deepen the correction when the first zigzag does not move price deep enough. Cycle wave y would be expected to move reasonably below the end of cycle wave w to deepen the correction. Were cycle wave y to reach equality with cycle wave w that takes Oil into negative price territory, which is not possible. Cycle wave y would reach 0.618 the length of cycle wave w at $2.33.
A better target calculation would be using the Fibonacci ratios between primary waves A and C within cycle wave y. This cannot be done until both primary waves A and B are complete.
Within cycle wave y, no second wave correction nor B wave may move beyond its start above 76.90.
WEEKLY CHART
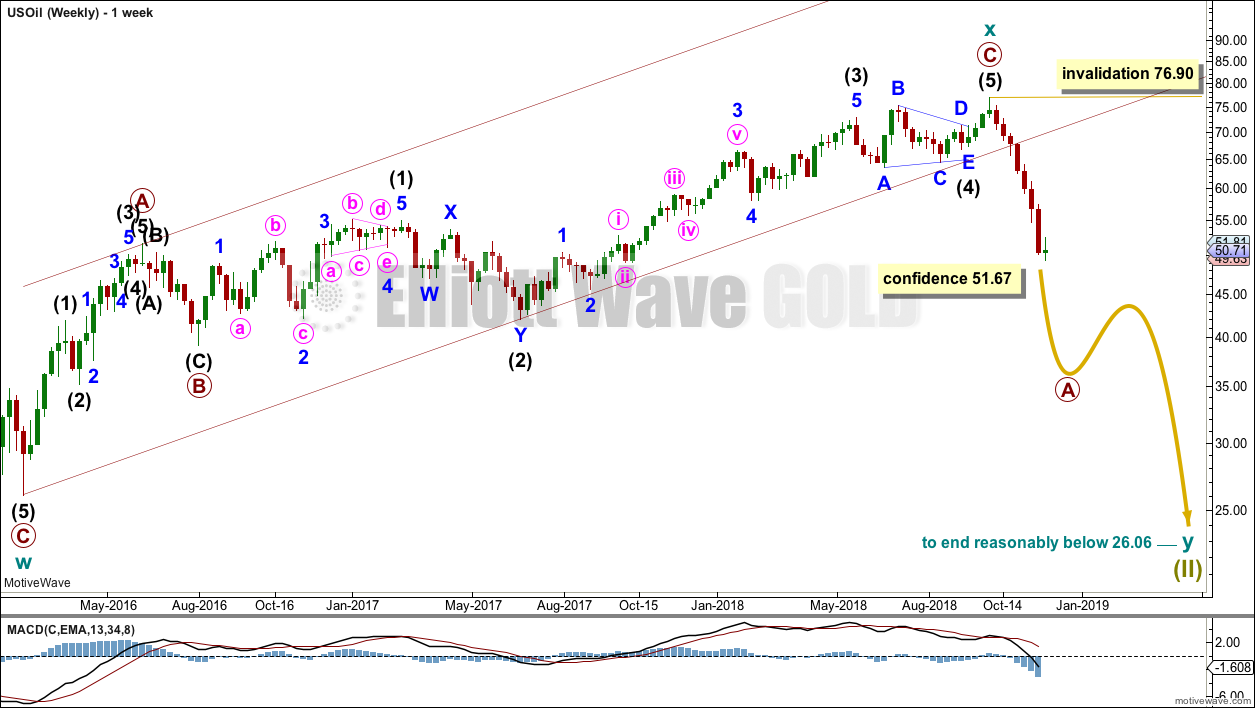
Click chart to enlarge.
Cycle wave x is seen as a complete zigzag. Within the zigzag, primary wave C is a five wave impulse and within it intermediate wave 4 is a triangle.
A new low below 51.67 has added confidence in this bearish wave count. At that stage, the bullish alternate was invalidated.
DAILY CHART
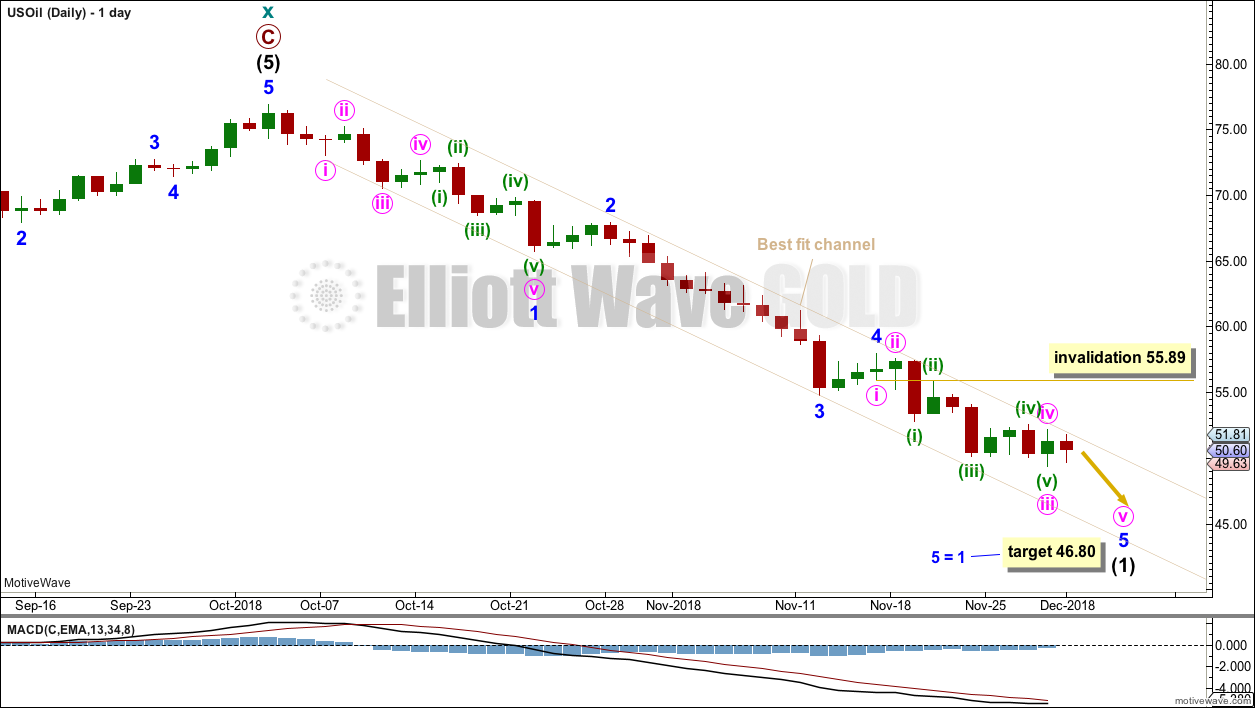
Click chart to enlarge.
Attention now turns to the structure of downwards movement. An impulse is unfolding lower.
Minor wave 3 is longer than minor wave 1 and does not exhibit a Fibonacci ratio to minor wave 1.
Minor wave 4 has remained contained within the best fit channel.
The most common Fibonacci ratio for minor wave 5 is used to calculate a target for it to end. Minor wave 5 is subdividing as an impulse. Within the impulse, minute waves i through to iv may be complete. If minute wave iv continues, then it may not move into minute wave i price territory above 55.89. However, it should remain contained within the best fit channel.
Intermediate wave (1) may end next week.
However, if this analysis is wrong, it may be in expecting intermediate wave (1) to end sooner than it does. It must be accepted that while price remains within the channel intermediate wave (1) could continue for longer than this analysis expects. Look out for surprises to the downside.
Keep using the best fit channel as the first guide for an upcoming trend change. If the channel is breached by clearly upwards movement (not sideways), that would be an early indication that intermediate wave (1) may be over and intermediate wave (2) may have begun.
TECHNICAL ANALYSIS
MONTHLY CHART
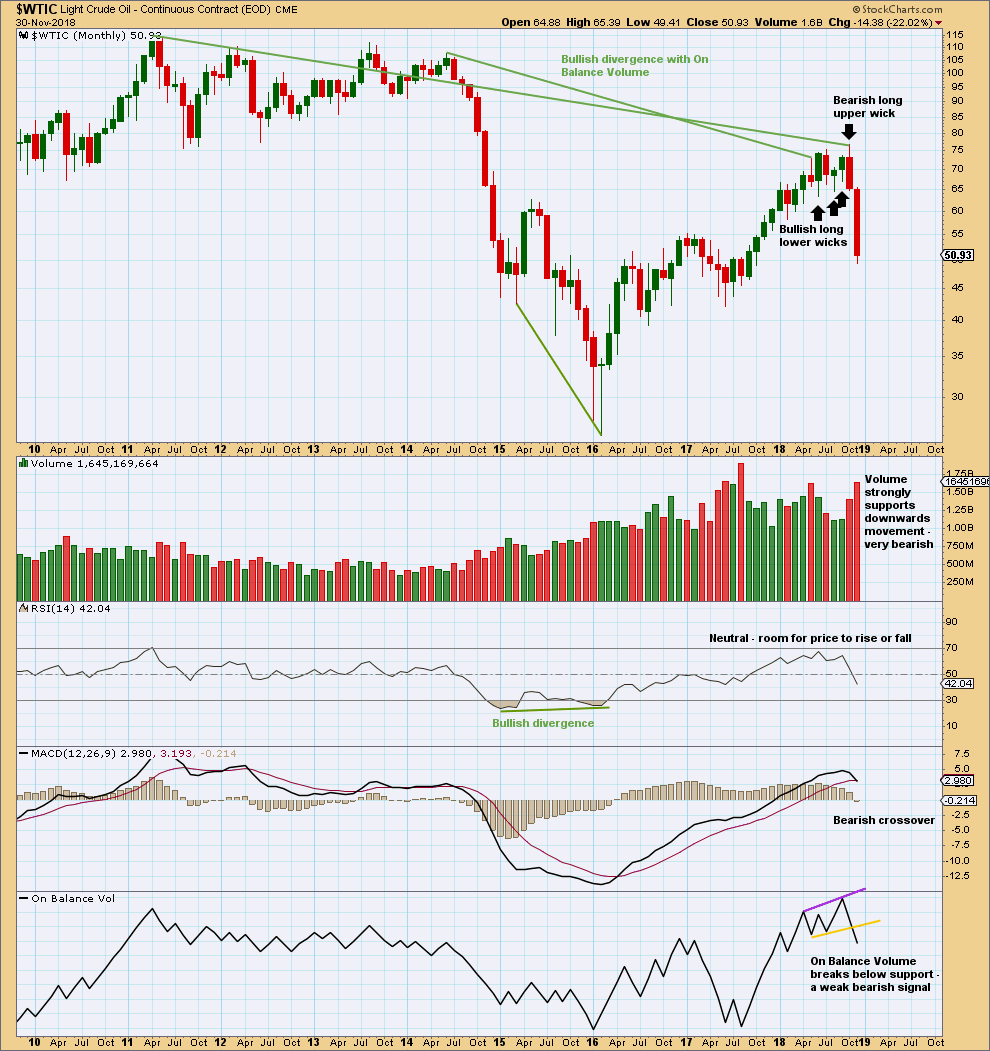
Click chart to enlarge. Chart courtesy of StockCharts.com.
Strong support from volume and no long lower wick this month are very bearish. Expect price to continue falling at this time frame until there is a candlestick reversal pattern or at least a long lower wick.
The signal from On Balance Volume is weak because the trend line breached had only two anchor points and a reasonable slope. But it is still a bearish signal.
WEEKLY CHART
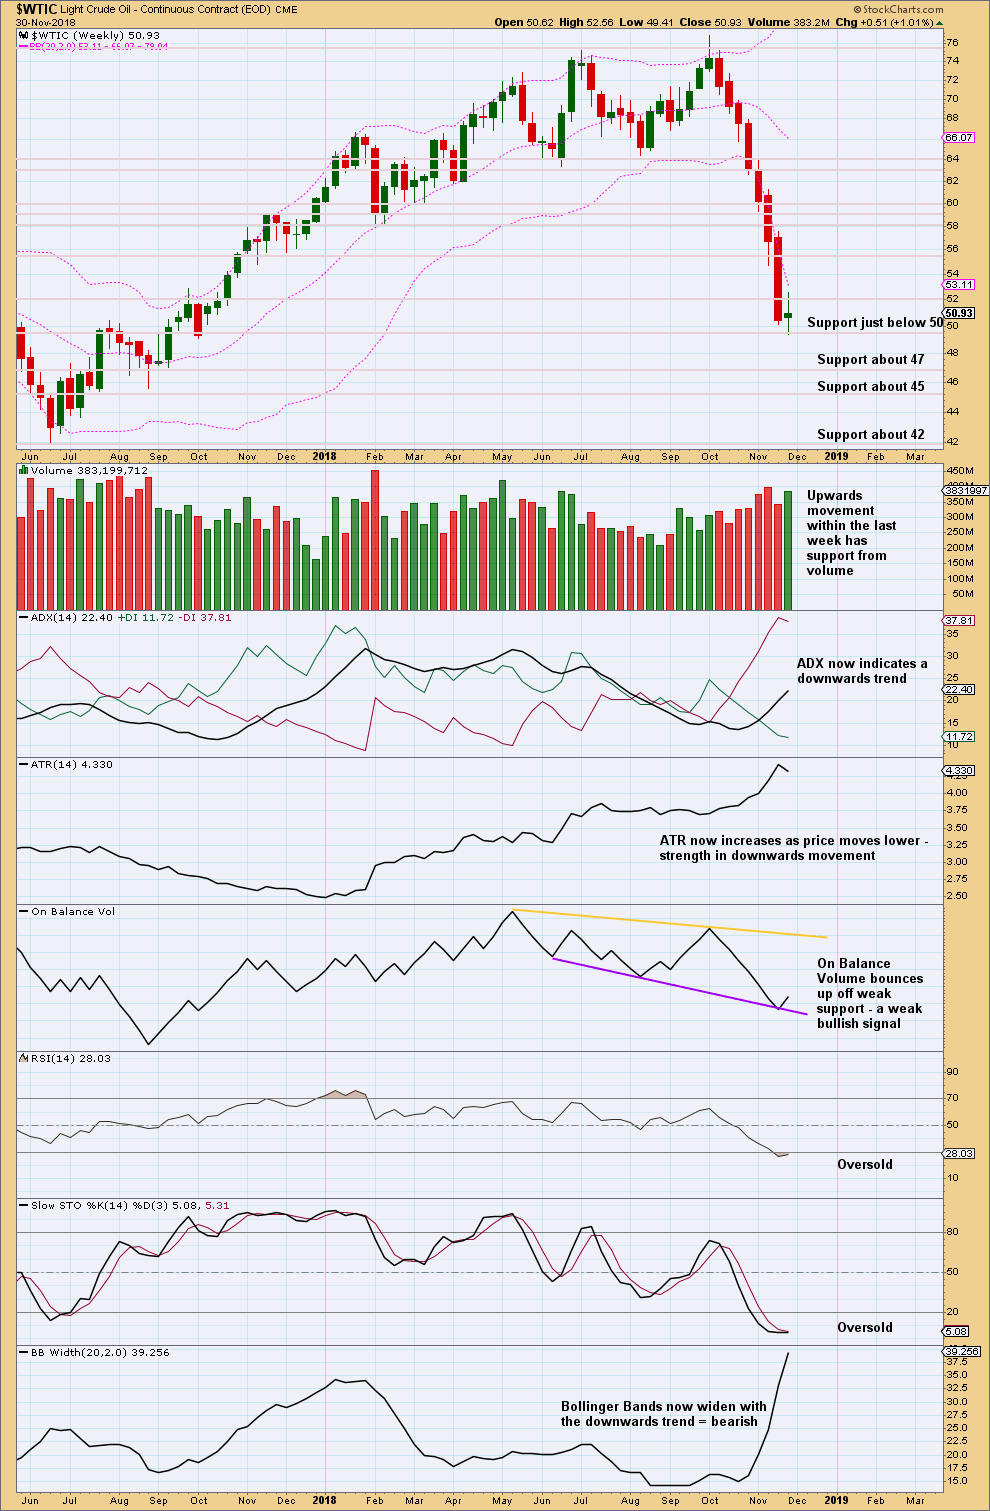
Click chart to enlarge. Chart courtesy of StockCharts.com.
The doji on its own is not a candlestick reversal pattern. With this week’s real body inside the real body of last week’s real body, the candlestick cannot be part of a Morning Doji star either.
The signal this week from On Balance Volume is weak because the trend line it bounced up from had only two prior anchor points and has a reasonable slope.
DAILY CHART
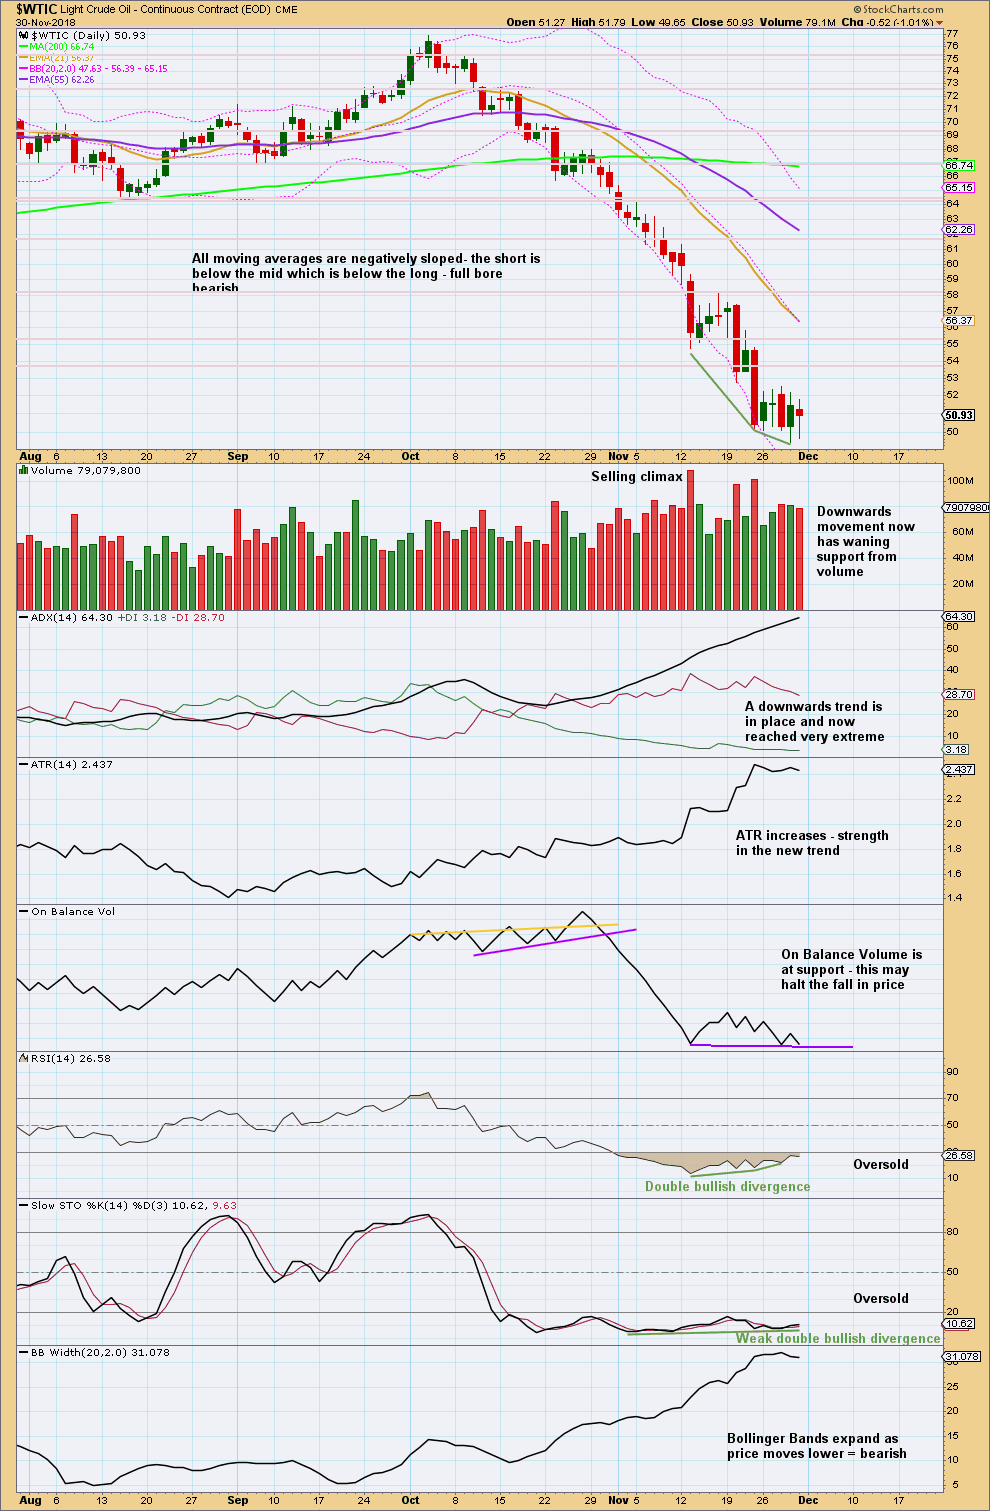
Click chart to enlarge. Chart courtesy of StockCharts.com.
I have taken some time to look back at the last strong bearish trend from Oil from about May 2014 to January 2016. I have noticed that downwards waves often end with support from volume, and sometimes do not even end with a long lower wick. Bullish reversal patterns are often but not always found at lows. RSI can reach very extreme and remain so for as long as three months when this market has a strong downwards trend. At lows Stochastics often will exhibit bullish divergence, but this can be rather weak. At lows RSI sometimes, not always, exhibits bullish divergence and can remain deeply oversold for long periods of time.
US Oil is a particularly difficult market to find lows in. It can trend strongly for very long periods of time with indicators remaining very extreme.
At this time, there is now clearly a downwards trend in place. This could continue for months yet. While price remains within the channel on the daily Elliott wave chart, expect it to continue to fall.
Expect that a low has been found only if a bullish candlestick reversal pattern appears, or the channel is clearly breached. But note that even if these occur, that any bounce may still be short lived.
This week members should be more alert for a possible low in place soon. Downwards movement is beginning to show some weakness. A bounce may be coming in the next week or so.
—
Always practice good risk management as the most important aspect of trading. Always trade with stops and invest only 1-5% of equity on any one trade. Failure to manage risk is the most common mistake new traders make.
Updated daily chart for the S&P today:
This is now going to be the main wave count. The triangle is invalidated, and the way I had the main count is invalidated (although I could have seen intermediate (2) over today as a flat correction).
I want to draw members attention to the teal trend line. This line has been held over 10 years, is tested multiple times and so far has only a couple of small overshoots and no breaches. This line has very strong technical significance. Expect a low is in place here today if support here holds. This is most likely.
A new target is calculated for P5 to end. It needs to move above the end of P3 to make new all time highs and for the AD line to begin to show that minimum required 4 months of divergence.
Thanks Lara…
Your analysis is completing mine and has propelled my portfolios to new highs YTD…. I really appreciate your passion and dedication to your work…
Even if you analyze the market differently than me, your unbiased work is always a view that I consider seriously…
Excellent work!!!!
Mathieu
That’s awesome to hear Mathieu! Thanks for telling me.
When I hear that my work is used to profit, that makes me very happy and want to work harder for you all 🙂 🙂 🙂
Lara, Where would you place your stop on this bullish possibility? My understanding is to remain bullish until previous wave 4 is taken out.
Thank you
Technically it should be at 2,111.05; primary 4 may not move into primary 1.
However, the teal trend channel is extremely significant for this bull market. So I’d place it a little below that trend channel, allowing for overshoots. Somewhere about 2,550 gives plenty of room for the market to move.
Please remember to adjust position size so risk is only 1-5% of equity.
There is always risk. I could always be wrong.
Hi Laura, Are you still sure that the SPX Wave 4 has completed already? The downside action over the past two days looks rather impulsive.
wow… the main Elliott wave count has been invalidated and the triangle as well… I think we have the double combination scenario (above) which may finish today…. Anyway, I am sure Lara will respond…
Cheers,
Mathieu
Hi Lara,
I am referring to S&P. While the levels for the main count and the triangle alternative have not yet been invalidated, I was wondering whether the triangle could already be ruled out (given that potential waves d and e look more like motive waves…)?
I was also wondering whether we should maybe consider the possibility that we may already be in a bear market, something along the way of this chart?
I would very much appreciate your comments. Thanks for your help!
Nice chart, until 2500 is taken out I like triangle idea. Same chart you have log scale connect lows of 2011 and 2016. I come up with 2516 and we are not there yet. I hate getting so bearish so far away from 13 ema.
I can see a problem here. You would have to resolve how your pink i within blue 5 subdivides.
It needs to be a five wave structure. That looks like a three.
To do this the subdivisions at the daily chart need to be looked at.
Otherwise, a very nice count. Sorry to put a spanner in your works there 🙂
Fady08,
You might be on to something…. I predicted every move last week correctly except for Friday as my sentiment was bullish…. Friday’s move broke the impulse rebound of Thursday… We have now a weekly engulfing red candlestick… This is really bearish…. I went to cash at the end of the day…
The Nasdaq and the Russell are looking much worse… The American banks are doing new lows….
My confidence in this bull market got shot down with yesterday’s move…
Updated daily chart for Oil:
The narrow channel is breached. This count now expects that intermediate (1) is over and intermediate (2) has just begun.
Intermediate (1) lasted 7 weeks. Intermediate (2) may last a Fibonacci 5 weeks minimum, and it may be longer lasting than that if it is a more time consuming kind of sideways correction like a flat or combination.
Intermediate (2) may end at the 0.618 Fibonacci ratio, but it may also be quite a lot deeper than that. This is the first big second wave correction within a new trend for this wave count, and for this market those can often be surprisingly deep, it could be over 90% of intermediate (1) and look very normal.
Hi Lara
Topic is oil. My read is that price has just finished up the final 4 wave correction and should be just starting the final 5th wave down. Is that your read?
Not anymore. The channel is breached.
Lara
Thanks for all you do. Your insights are very valuable for those of us who use the tool as a way of identifying trends, pullbacks and ultimately corrections.
I wonder if you could make a mid week comment on todays market action in the S&P. In your main wave count, within intermediate wave (3) of Primary wave 5, is it possible we have begun minor wave 2 with todays action? If so, would the invalidation point be 2631.09? It seems unlikely that todays move would already be intermediate wave 4.
In the triangle alternate wave count, we could have completed (D) and begun the (E) wave of primary wave 4. I would expect this wave count is still valid and the invalidation point for (E) to the downside would be the same 2631.09.
Thanks as always for what you do.
Rich
The main count expects minor wave 2, yes. And it expects it to end in just another couple of days.
The triangle alternate count yes, intermediate (D) complete and now the final zigzag down for intermediate (E).
Hi Lara,
Wow! The end is very near☝️🤷🏼♂️ It moved from Oct19 on to Dec18-Mar19 in SP…. where was a miscalculation earlier? You expected much longer wave 4 and 5 and now you think it is probably over…???🤷🏼♂️🤷🏼♂️🤷🏼♂️ Is there a chance wave 4 will last two-three more months as expected before and 5th wave to end around next fall 2019? I just do not understand why it squeezed so much and so fast ????
“where was a miscalculation earlier? ”
I have had it noted underneath my AD line daily chart for a long time that the earliest the bull market could end is the end of this December.
While primary wave 4 was incomplete I could only calculate a target and time expectation at cycle degree. Now that it looks like it is possible that primary wave 4 could be complete I can calculate the target and time expectation at primary degree, and so it changes.
And so to call it a miscalculation is I think misunderstanding what I’m trying to do here.
At the beginning of a wave it’s impossible to tell what EW structure it may be (unless it’s a third wave in an impulse, all others have multiple structural options) and impossible to tell with any confidence when it may end.
As a wave unfolds and the structure becomes clearer then a little more confidence can enter the wave counts. As it gets closer and closer to the end more degrees of labelling are complete and the target calculation can be honed.
Maybe think of it like this. It’s like driving in heavy rain to an uncertain destination. The closer you get, the more you can see the end and so you adjust accordingly. Not the best analogy, but I hope you get the idea.
When within primary wave 5 there is intermediate (1) through to (4) complete then I will be able to add to the target calculation at intermediate degree, so at that time the target may again change or it may widen to a zone.
And finally, it could still take until October 2019 and the higher target could still be the correct target. Or neither of them could be right and I could be wrong.
Thanks Lara! The problem is that all this analysis and forecast is after the fact…when any wave is almost over…. no one can say for sure any short-term or at least long-term ( as case is with oil) correct wave count…. I meant that everything can change 180 degrees even at larger scale🤷🏼♂️🤷🏼♂️🤷🏼♂️ I mean everything- direction, levels, time…. December 2018 is too close to be the final point although market can go up like crazy in next weeks but next 3 months is quite probable time period…. the thing is that when you wrote about wave 4 you expected some length from it around 10 weeks and you also had 3600 target for this bull market to end. So, now everything seems to be squeezed significantly🤷🏼♂️ It seemed you expected multi-months correction in SP in wave 4 but now it seems to be over… well, ok, lets see when SP hits new high and where other indicators will be….Sorry, i didn’t mean to be rude or insulting…. just observations… I thought you meant multi-month wave SP 4 correction ( not 1-1,5 month) initially much longer than we had in 4 wave of lesser degree in Jan-Feb 2018…🤷🏼♂️🤷🏼♂️🤷🏼♂️
alexpronin,
We are all humans here… EW is not a forecasting tool. It is another way to look at the markets and to determine probabilities. Sometimes things can come from left field and can change the EW count abruptly. That’s why Lara has invalidation points. Sometimes her counts turn out to be wrong… Normal impulses are so easy to analyze… However this impulse from early 2016 is not that easy to analyze because it is not a clear cut 12345 impulse. And corrections are extremely hard to analyse. I have to give all the praise to Lara to have the guts to analyze the difficult sideways pattern of the Gold market… Extremely difficult and frustrating. I have been unable to analyze it myself. Lara has been the best I’ve seen in my 25 year investment career.
Cheers,
Mathieu
My original expectation for the duration of primary wave 4 was for it to be about 10 weeks, about even in duration with primary wave 2.
My main wave count now sees primary wave 4 over in 6 weeks. That’s just 4 weeks, one month, short of original expectations.
I really don’t see what the problem is with the change.
Markets change all the time. If you are looking for an analyst who is going to give you a prediction well in advance of an event, and not change that with changing market conditions, then you are looking for an impossibility.
I am beginning to strongly believe that this may not be the analysis service for you.