

S&P 500
Downwards movement for Friday remains just above the invalidation point and on the support line.
Two alternate Elliott wave counts are published for members today.
Summary: The main wave count will expect support at the teal trend line to continue to hold. Assume support holds, until it is broken. Only if that line is breached by a full weekly candlestick will a more bearish scenario be seriously considered.
The main wave count now expects this bull market to end at the end of December 2018 at the earliest, and possibly in March 2019, at 3,090.
Two alternates look at primary wave 4 continuing as a zigzag. It is possible it could overshoot the teal trend line.
The biggest picture, Grand Super Cycle analysis, is here.
Last published monthly chart is here, video is here.
MAIN ELLIOTT WAVE COUNT
WEEKLY CHART

Click chart to enlarge.
Cycle wave V must complete as a five structure, which should look clear at the weekly chart level and also at the monthly chart level. It may only be an impulse or ending diagonal. It is clear it is an impulse.
Within primary wave 3, there is perfect alternation and excellent proportion between intermediate waves (2) and (4).
Draw the teal channel from the high of cycle wave I at 1,343.80 on the week beginning 3rd July 2011, to the high of cycle wave III at 2,079.46 on the week beginning 30th November 2014, and place a parallel copy on the low of cycle wave II at 1,074.77 on the week beginning 2nd October 2011. Draw this chart on a semi-log scale. A small overshoot, like that seen at the end of cycle wave IV, would be entirely acceptable. If price does move below the channel, then it should reverse reasonably quickly.
Primary wave 4 may be over at the last low as a complete double combination. Price has found support very close to the lower edge of the teal trend channel, with a very small intraday overshoot. If primary wave 4 is over here, it would exhibit perfect alternation in structure with primary wave 2 and almost perfect proportion.
This wave count has the right look at the monthly chart level.
If primary wave 5 ends at or after the end of December 2018 and the AD line fails to make new all time highs, there would then be the minimum required four months of bearish divergence between price and the AD line. If this happens, then the conditions for the end of this bull market would be in place.
A target is calculated for primary wave 5 to end. If primary wave 5 were to be only equal in length with primary wave 1, then it would be truncated. A truncated primary wave 5 would be unlikely as then there could be no bearish divergence with the AD line. The next Fibonacci ratio in the sequence is used to calculate a target for primary wave 5.
Primary wave 4 may not move into primary wave 1 price territory below 2,111.05.
Three daily charts below are published in order of probability.
DAILY CHART
Click chart to enlarge.
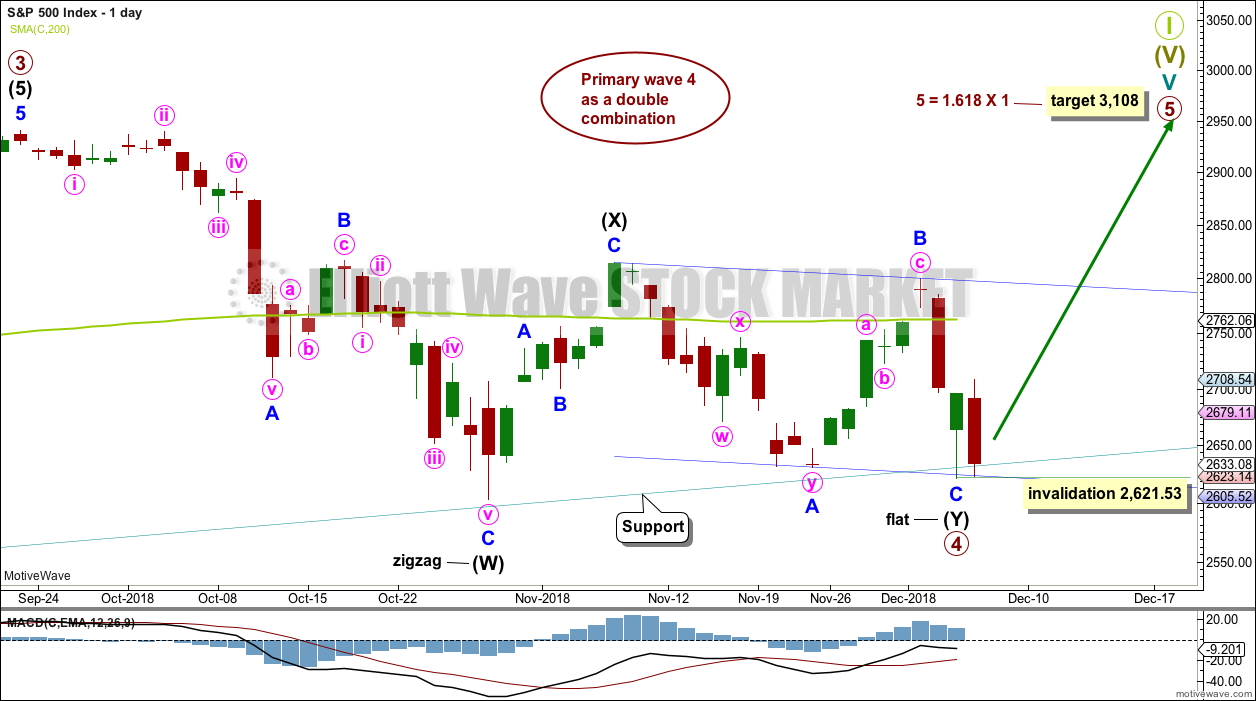
Primary wave 4 may be complete as a double combination. The first structure in the double may be a complete zigzag labelled intermediate wave (W). The double may be joined by a three in the opposite direction labelled intermediate wave (X). Intermediate wave (X) may be complete as a single zigzag; it is deep at 0.63 the length of intermediate wave (W), which looks reasonable.
While double combinations are fairly common structures, triple combinations are extremely rare. The probability that the entire correction is complete is very high when a second structure in a multiple is complete.
Intermediate wave (Y) may be a regular flat correction, subdividing 3-3-5.
Within the flat correction of intermediate wave (Y), minor wave C is 5.41 points short of equality in length with minor wave A. This is close enough to say they have an adequate Fibonacci ratio of equality.
Within primary wave 5, no second wave correction may move beyond the start of its first wave below 2,621.53.
Primary wave 5 at its end may be expected to exhibit reasonable weakness. At its end, it should exhibit a minimum of 4 months bearish divergence with the AD line, it may exhibit bearish divergence between price and RSI and Stochastics, and it may lack support from volume.
ALTERNATE DAILY CHART
Click chart to enlarge.
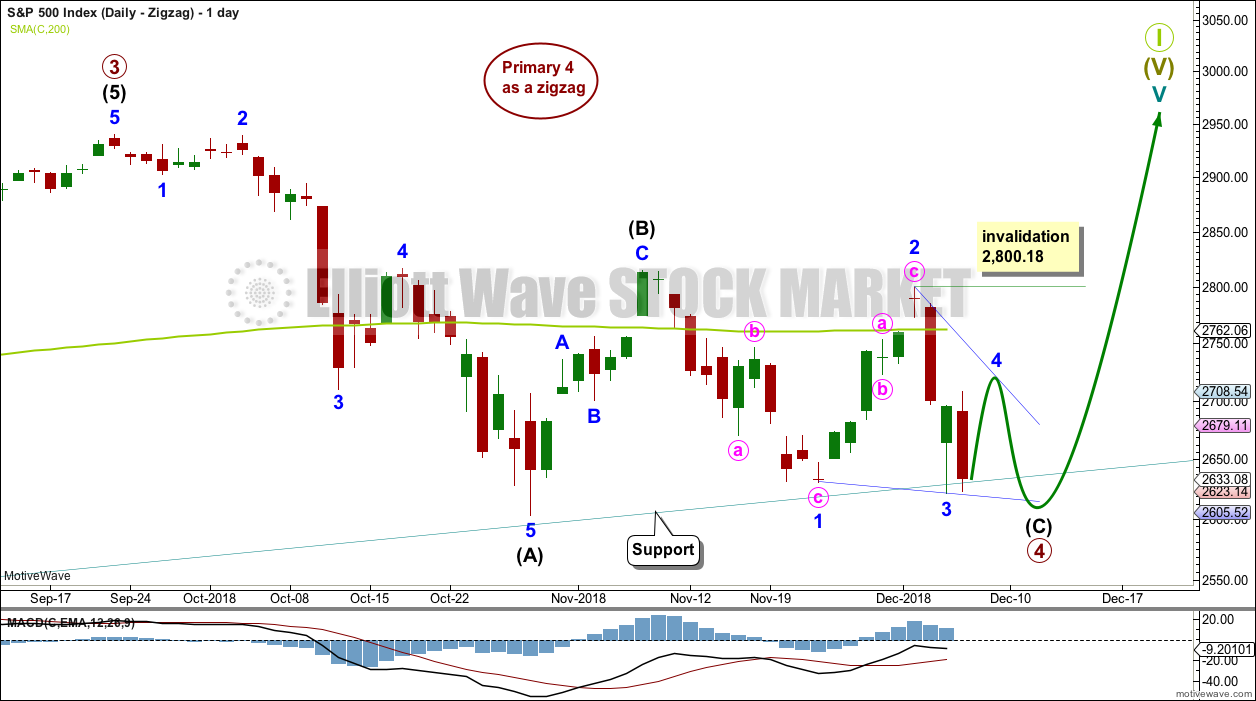
This wave count has been published before with some variation. It considers primary wave 4 continuing as a single zigzag.
Within the zigzag, intermediate wave (C) may be an almost complete ending contracting diagonal.
Within the ending diagonal, all sub-waves must subdivide as zigzags, minor wave 4 must overlap minor wave 1 price territory, and minor wave 4 may not move beyond the end of minor wave 2 above 2,800.18.
Minor wave 5 may end with a small overshoot of the 1-3 trend line.
It is possible that minor wave 4 may move sideways as the arrow suggests. This would give the diagonal trend lines a more normal look. It is also possible that minor wave 4 could be over at Friday’s high and minor wave 5 may continue lower on Monday.
This wave count would expect only a small overshoot of the teal trend channel.
SECOND ALTERNATE DAILY CHART
Click chart to enlarge.
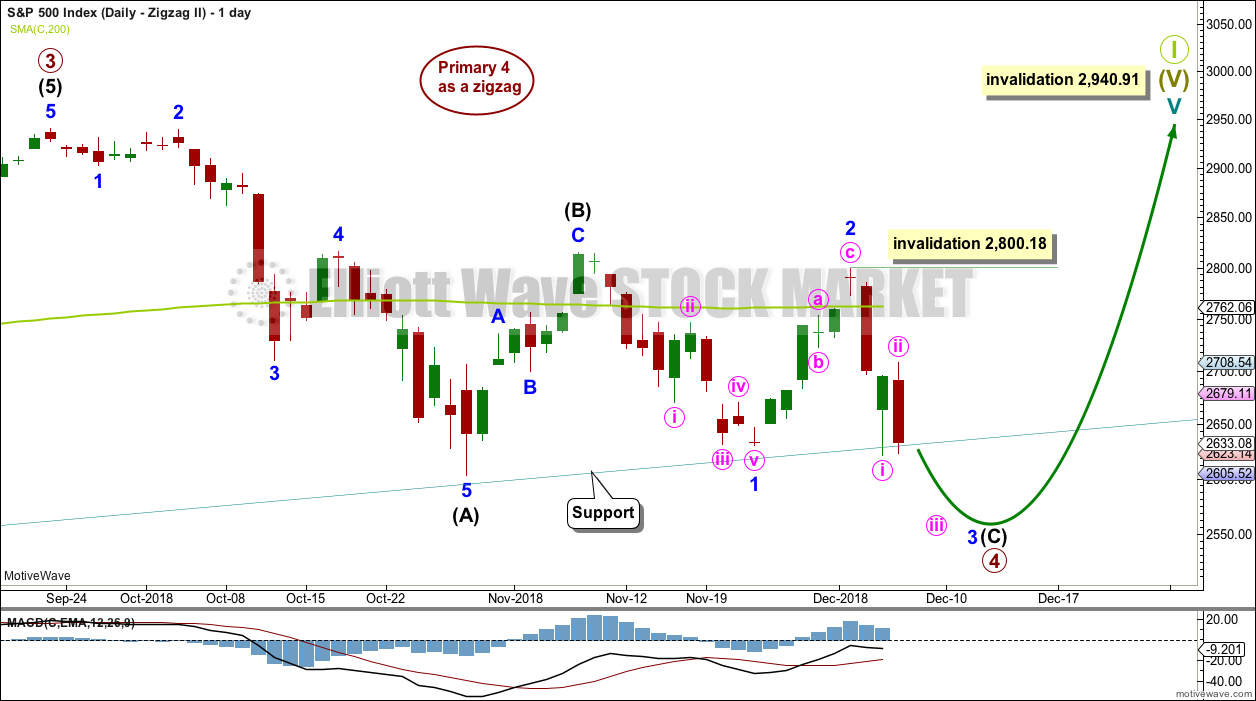
The other possible structure for intermediate wave (C) would be a simple impulse. If intermediate wave (C) is unfolding as an impulse, then it may now have two first and second waves complete. This wave count would expect to see an increase in downwards momentum early next week as the middle of a third wave unfolds.
Minute wave ii may not move beyond the start of minute wave i above 2,800.18.
This wave count would expect to see a strong overshoot of the teal trend channel on the weekly chart, and possibly a breach on the daily chart. This would be acceptable; it has happened before on the 11th of February 2016 for one session.
The S&P commonly forms slow curving rounded tops. When it does this, it can breach channels only to continue on to make new all time highs. It is possible that Super Cycle wave I may end in this way.
TECHNICAL ANALYSIS
WEEKLY CHART
Click chart to enlarge. Chart courtesy of StockCharts.com.
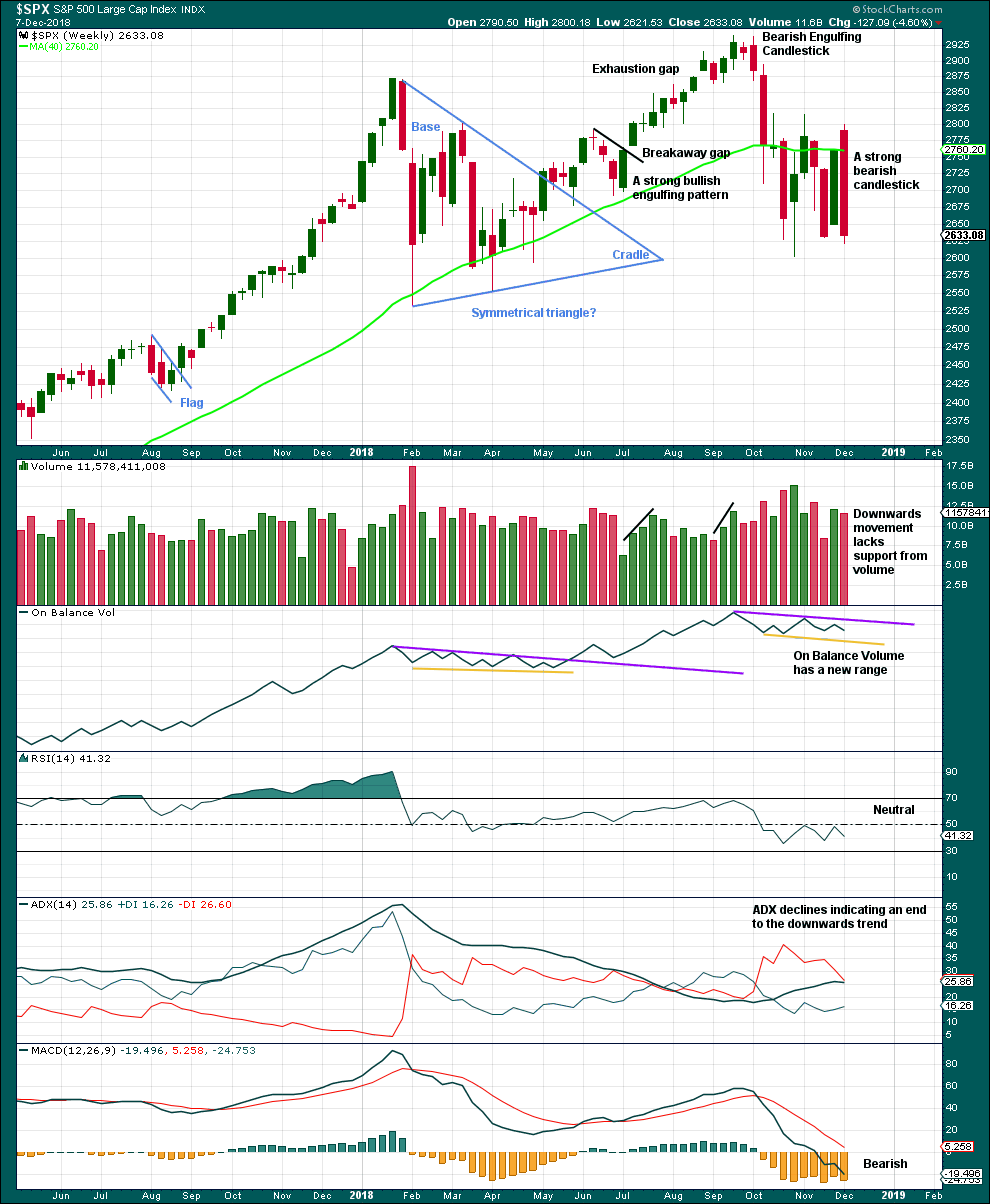
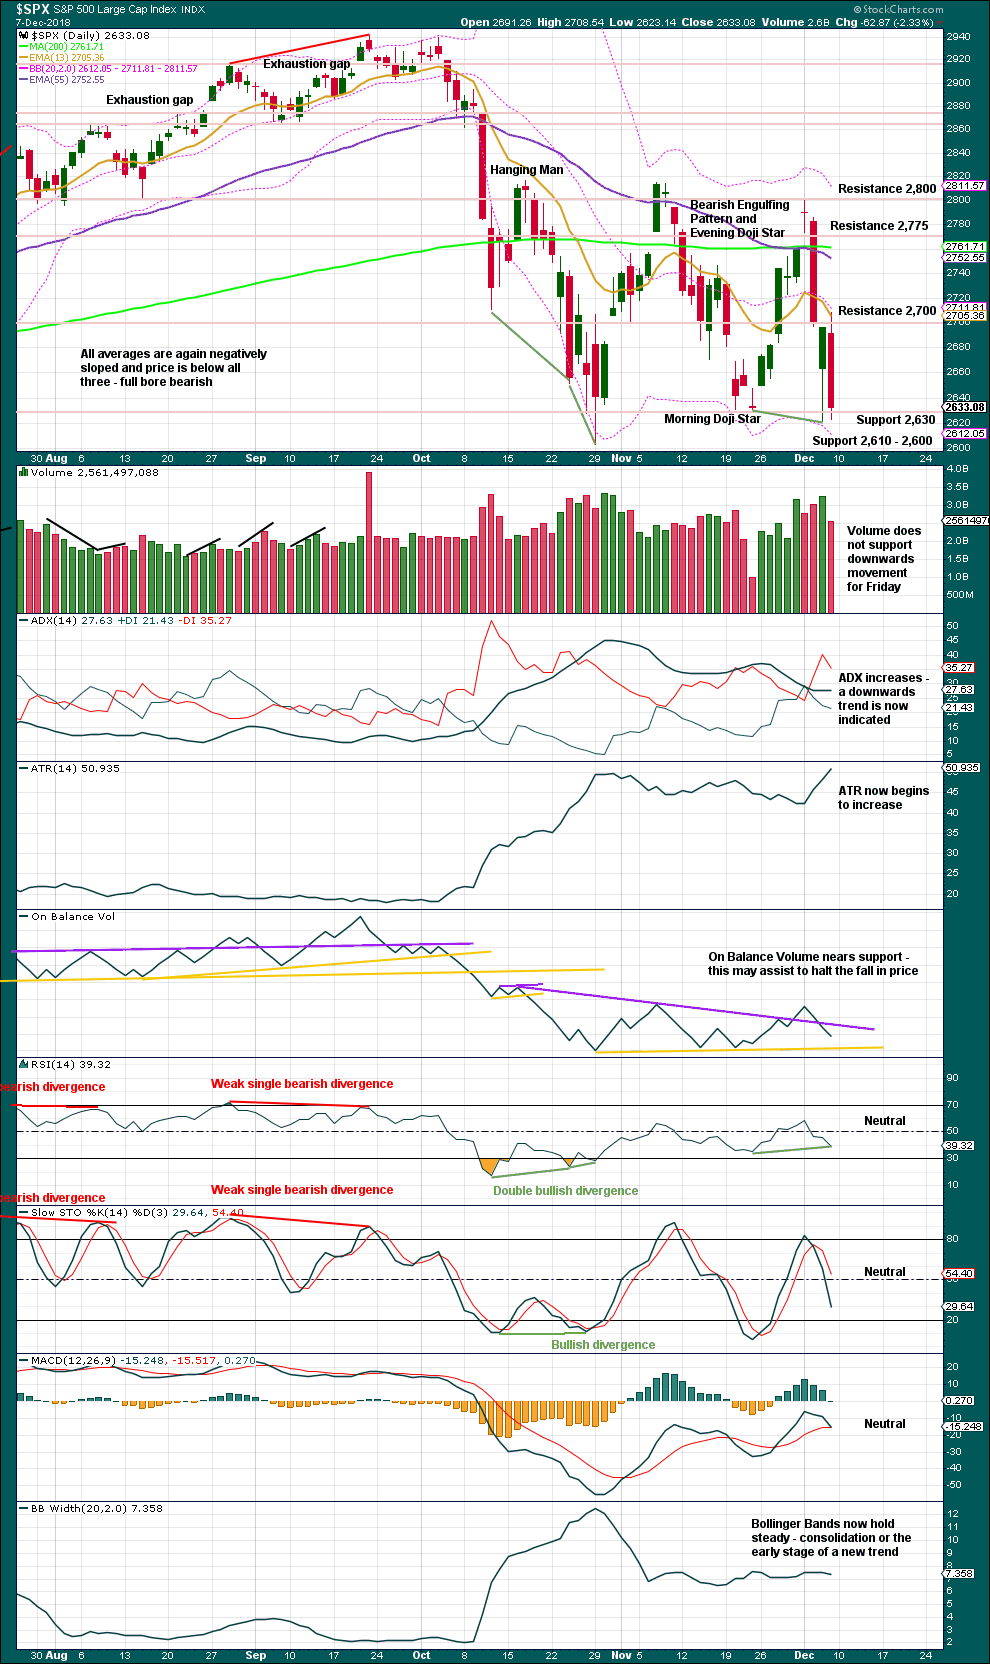
This weekly candlestick is a strong bearish candlestick, but does not meet all the criteria for a Bearish Engulfing pattern. From Nison, “Japanese Candlestick Charting Techniques” page 43:
“There are three criteria for an engulfing pattern:
1. The market has to be in a clearly definable uptrend (for a bearish engulfing pattern)…
2. Two candles comprise the engulfing pattern. The second real body must engulf the prior real body (it need not engulf the shadows).
3. The second real body of the engulfing pattern should be the opposite colour of the first real body.”
This market is not currently in a clearly definable upwards trend, so the first criteria is not met.
A decline in volume this week may be due to the week being a short trading week, and so it would be best to look inside the week to determine the short-term volume profile.
However, the strongest volume for recent weeks is for the upwards week beginning 29th of October. This short-term volume profile at this time frame is bullish.
For a more bearish outlook a bearish signal from On Balance Volume would be preferred.
DAILY CHART
Click chart to enlarge. Chart courtesy of StockCharts.com.
The lower edge of the teal trend channel is not shown on this chart, but it should be considered as part of this technical analysis. Expect that trend line to continue to provide support, until it does not.
Support at the teal trend line holds. While Friday is a strong downwards day, it has not made a new low and volume shows a decline. The market can fall of its own weight though for long distances, and so a decline in volume is not necessarily bullish.
The last bearish signal from On Balance Volume is too weak to support a more bearish outlook here: the trend line broken has some reasonable slope, was only tested three times, and had been breached and weakened before a second breach. The lower support line offers stronger technical significance, which may assist to halt a fall in price if price does continue lower here.
Bullish divergence between price and RSI remains, although it was weakened on Friday.
Currently, this market is consolidating with resistance about 2,815 and support about 2,605 to 2,620. It is the upwards day of the 30th of October that has strongest volume during this consolidation, suggesting an upwards breakout may be more likely than downwards. This technique does not always work, but it does work more often than it fails.
On balance it is my judgement that there is not enough strength in downwards movement yet for a more immediately bearish outlook.
BREADTH – AD LINE
WEEKLY CHART
Click chart to enlarge. Chart courtesy of StockCharts.com. So that colour blind members are included, bearish signals
will be noted with blue and bullish signals with yellow.
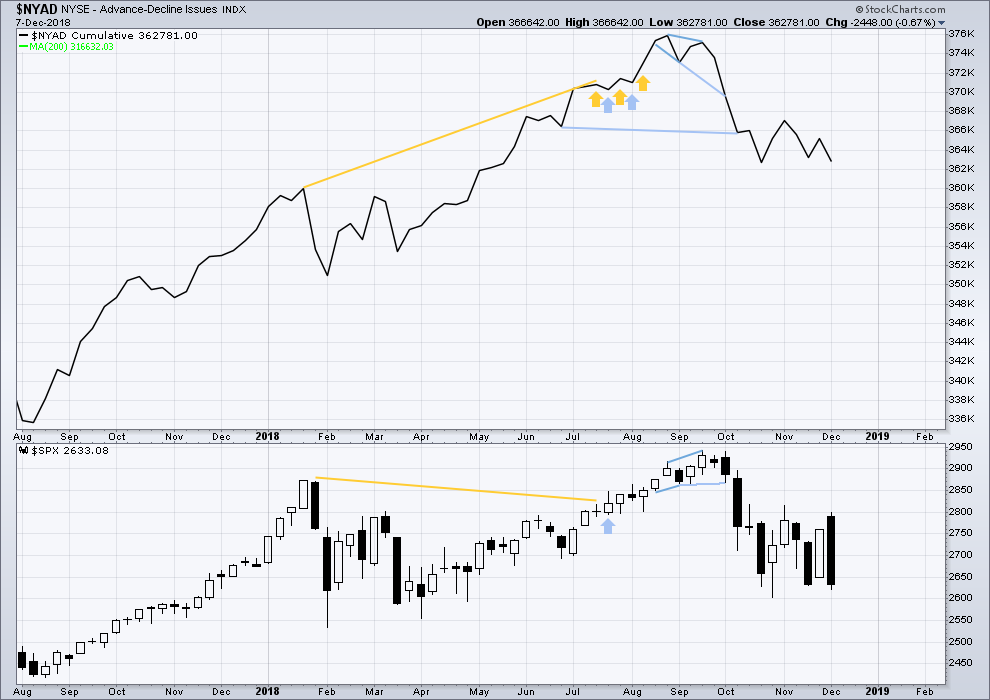
Both price and the AD line have moved lower this week. There is no divergence, and the AD line is not falling any faster than price here.
DAILY CHART
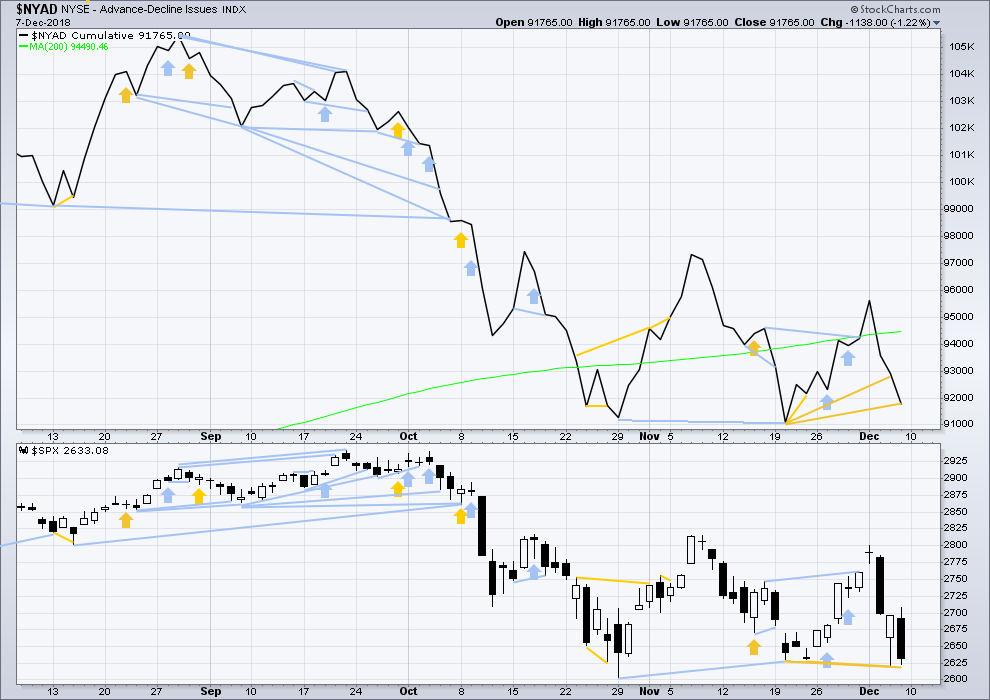
Click chart to enlarge. Chart courtesy of StockCharts.com. So that colour blind members are included, bearish signals
will be noted with blue and bullish signals with yellow.
There is normally 4-6 months divergence between price and market breadth prior to a full fledged bear market. This has been so for all major bear markets within the last 90 odd years. With no longer-term divergence yet at this point, any decline in price should be expected to be a pullback within an ongoing bull market and not necessarily the start of a bear market. New all time highs from the AD line on the 29th of August means that the beginning of any bear market may be at the end of December 2018, but it may of course be a lot longer than that.
Breadth should be read as a leading indicator.
Both price and the AD line have moved lower on Friday, but price has made another new swing low yet the AD line has not made a corresponding swing low. The fall in price does not have support from a corresponding fall in market breadth. This divergence is bullish.
VOLATILITY – INVERTED VIX CHART
WEEKLY CHART
Click chart to enlarge. Chart courtesy of StockCharts.com. So that colour blind members are included, bearish signals
will be noted with blue and bullish signals with yellow.
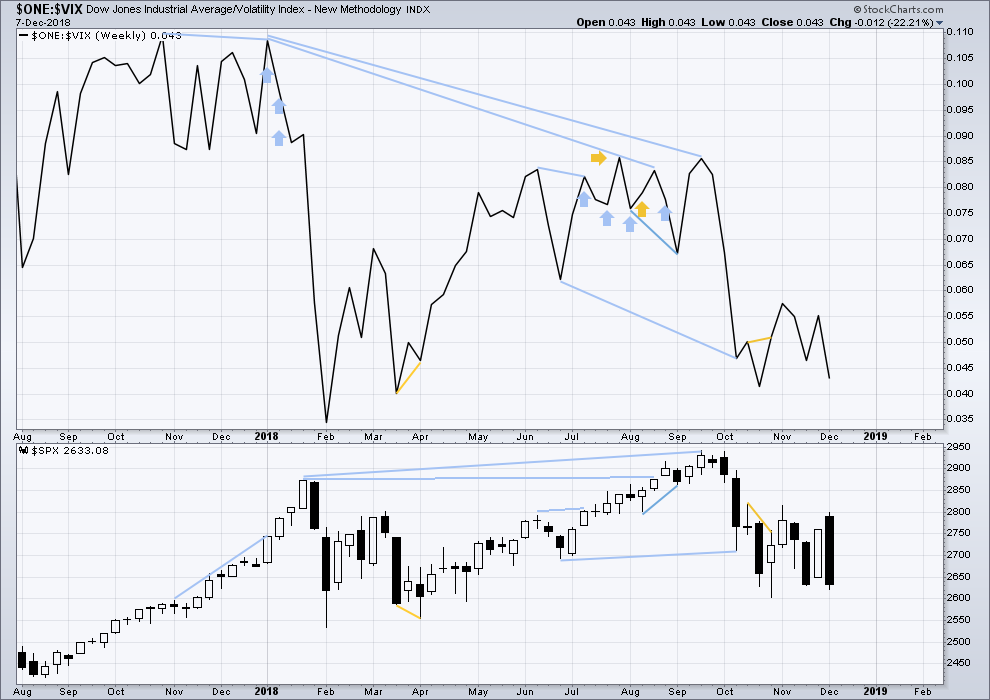
Both price and inverted VIX have moved lower this week. The fall in price comes with a normal corresponding increase in volatility, but VIX is not increasing any faster than price. There is no divergence and no bearish signal.
DAILY CHART
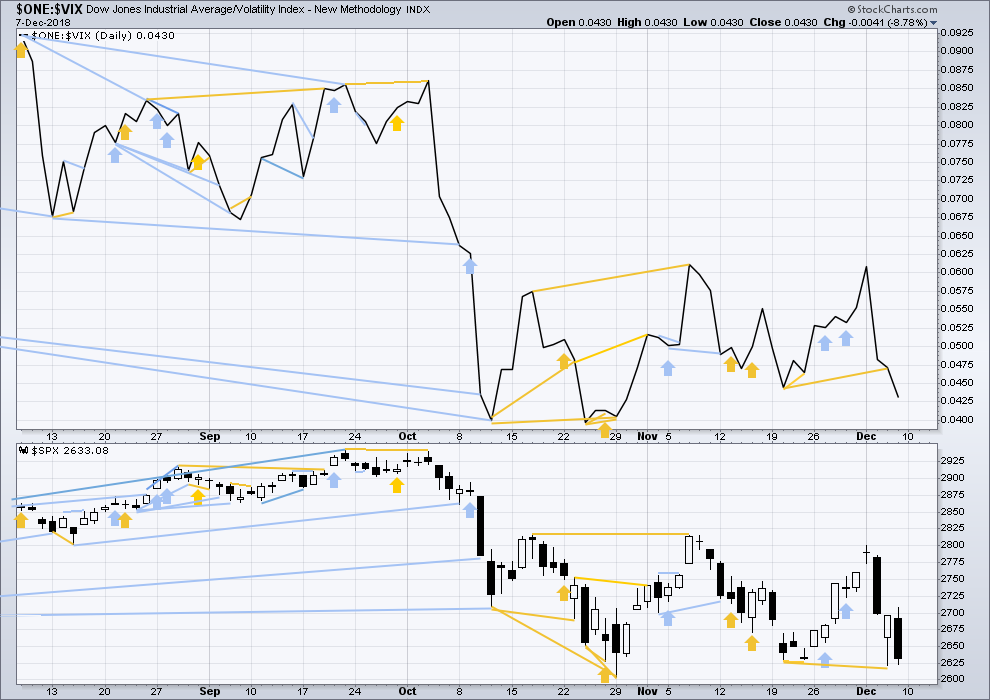
Click chart to enlarge. Chart courtesy of StockCharts.com. So that colour blind members are included, bearish signals
will be noted with blue and bullish signals with yellow.
Normally, volatility should decline as price moves higher and increase as price moves lower. This means that normally inverted VIX should move in the same direction as price.
Like the AD line, inverted VIX may now begin to accumulate instances of bearish signals or divergence as a fifth wave at three large degrees comes to an end.
Bullish divergence noted in last analysis has not been followed by upwards movement, so it is considered to have failed.
Both price and inverted VIX moved lower on Friday. Downwards movement in price has support from a normal corresponding increase in VIX. There is no new divergence.
DOW THEORY
The following lows need to be exceeded for Dow Theory to confirm the end of the bull market and a change to a bear market:
DJIA: 23,344.52.
DJT: 9,806.79.
S&P500: 2,532.69.
Nasdaq: 6,630.67.
GOLD
The short-term target for upwards movement for Friday was 1,250. Price moved higher to reach 1,249.66, just 0.34 short of the target.
Summary: For the very short term, a small pullback to about 1,235 may unfold early next week, lasting about 3 to 5 days. Thereafter, the upwards trend may resume. The mid-term target remains the same at 1,295.
The final target for this bounce to end is about 1,305 – 1,310.
Grand SuperCycle analysis is here.
Last historic analysis with monthly charts is here.
There are four remaining weekly wave counts at this time for cycle wave b: a triangle, a flat, a combination, and a double zigzag.
At this time, the Triangle wave count may again be slightly more likely.
MAIN ELLIOTT WAVE COUNT
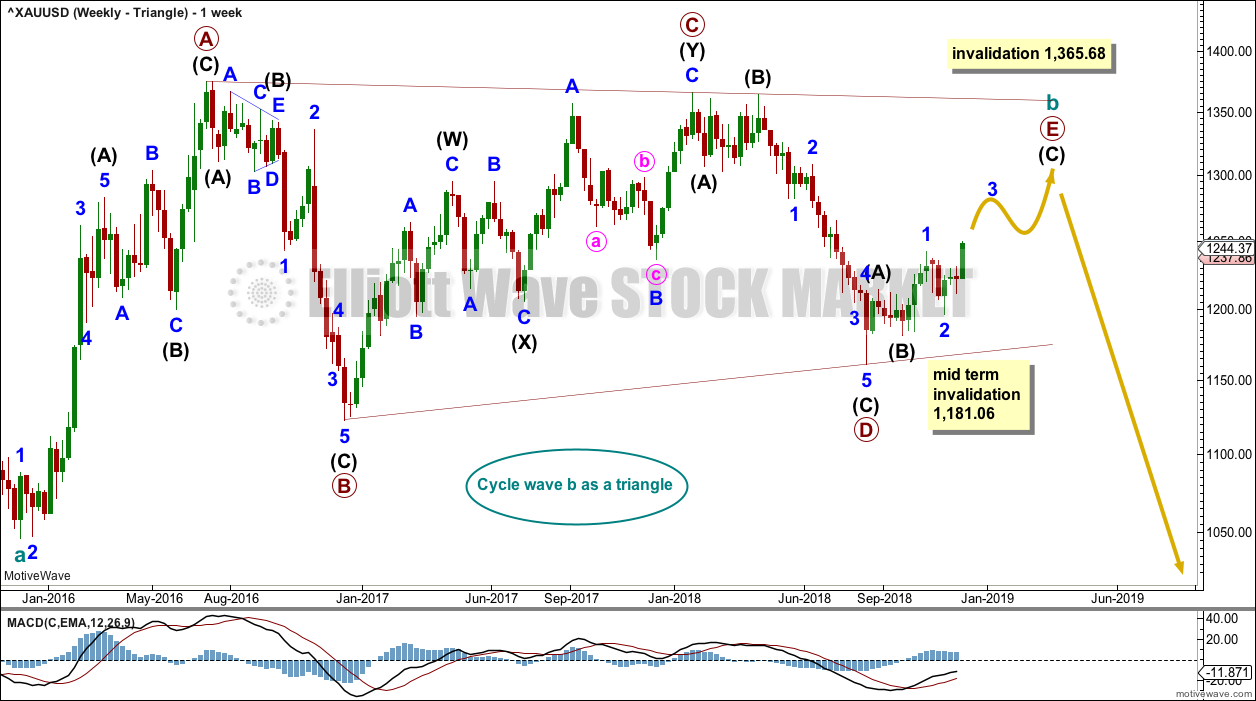
WEEKLY CHART – TRIANGLE
Click chart to enlarge.
Cycle wave b may be an incomplete regular contracting triangle. Primary wave E may not move beyond the end of primary wave C above 1,365.68.
Within primary wave E, intermediate waves (A) and (B) may be complete. Intermediate wave (C) must subdivide as a five wave structure. Within intermediate wave (C), minor wave 2 may not move beyond the start of minor wave 1 below 1,181.06.
Four of the five sub-waves of a triangle must be zigzags, with only one sub-wave allowed to be a multiple zigzag. Wave C is the most common sub-wave to subdivide as a multiple, and this is how primary wave C for this example fits best. Primary wave E would most likely be a single zigzag. It is also possible that it may subdivide as a triangle to create a rare nine wave triangle.
There are no problems in terms of subdivisions or rare structures for this wave count. It has an excellent fit and so far a typical look.
When primary wave E is a complete three wave structure, then this wave count would expect a cycle degree trend change. Cycle wave c would most likely make new lows below the end of cycle wave a at 1,046.27 to avoid a truncation.
DAILY CHART – TRIANGLE
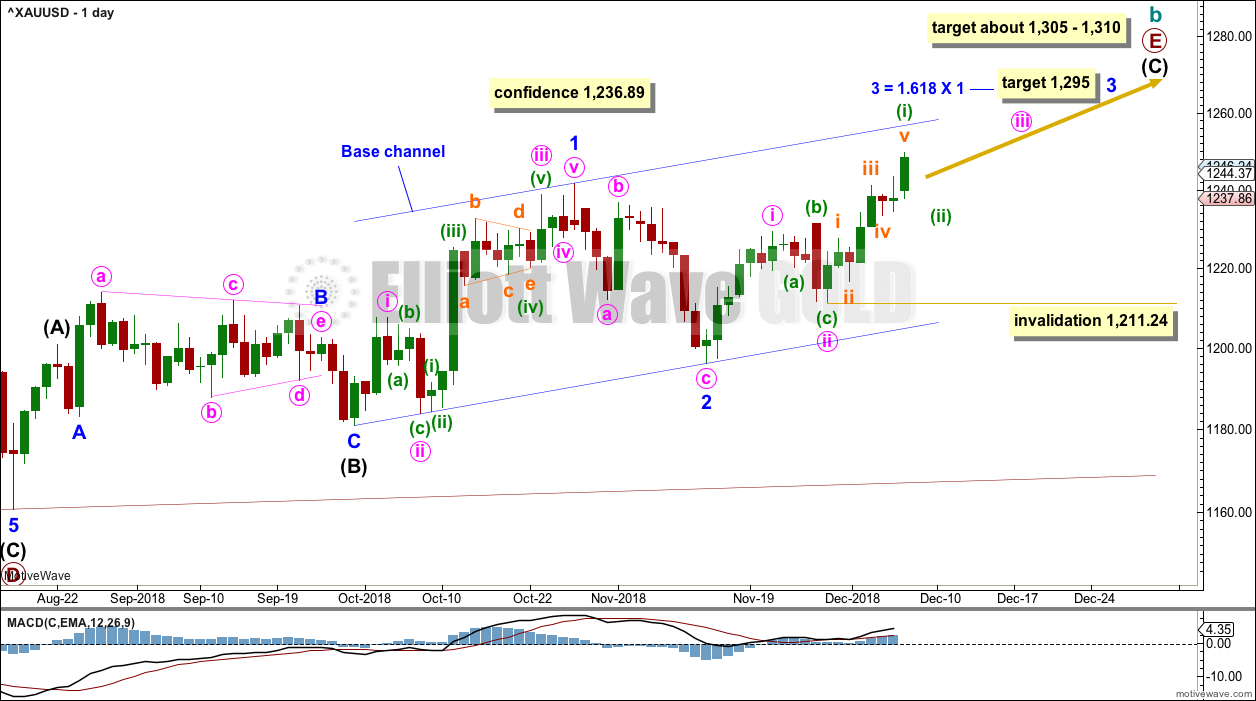
Click chart to enlarge.
Primary wave E should now be underway for this wave count.
Primary wave E should subdivide as a zigzag. Intermediate waves (A) and (B) may now be complete. Intermediate wave (C) may be underway.
Minor wave 1 fits perfectly as a five wave impulse. Minor wave 2 should be complete as a deep zigzag. Minor wave 3 may now exhibit an increase in upwards momentum, and it should have support from volume. The target for minor wave 3 expects it to exhibit a common Fibonacci ratio to minor wave 1.
Minor wave 3 may only subdivide as an impulse. Within minor wave 3, minute waves i and ii may now be complete. Within minute wave iii, minuette wave (ii) may not move beyond the start of minuette wave (i) below 1,211.24.
A target for primary wave E is the strong zone of resistance about 1,305 to 1,310. Primary wave E is most likely to subdivide as a zigzag (although it may also subdivide as a triangle to create a rare nine wave triangle). It may last a total Fibonacci 21 or 34 weeks. So far it has lasted 13 weeks. Primary wave E may not move beyond the end of primary wave C above 1,365.68.
WEEKLY CHART – DOUBLE ZIGZAG
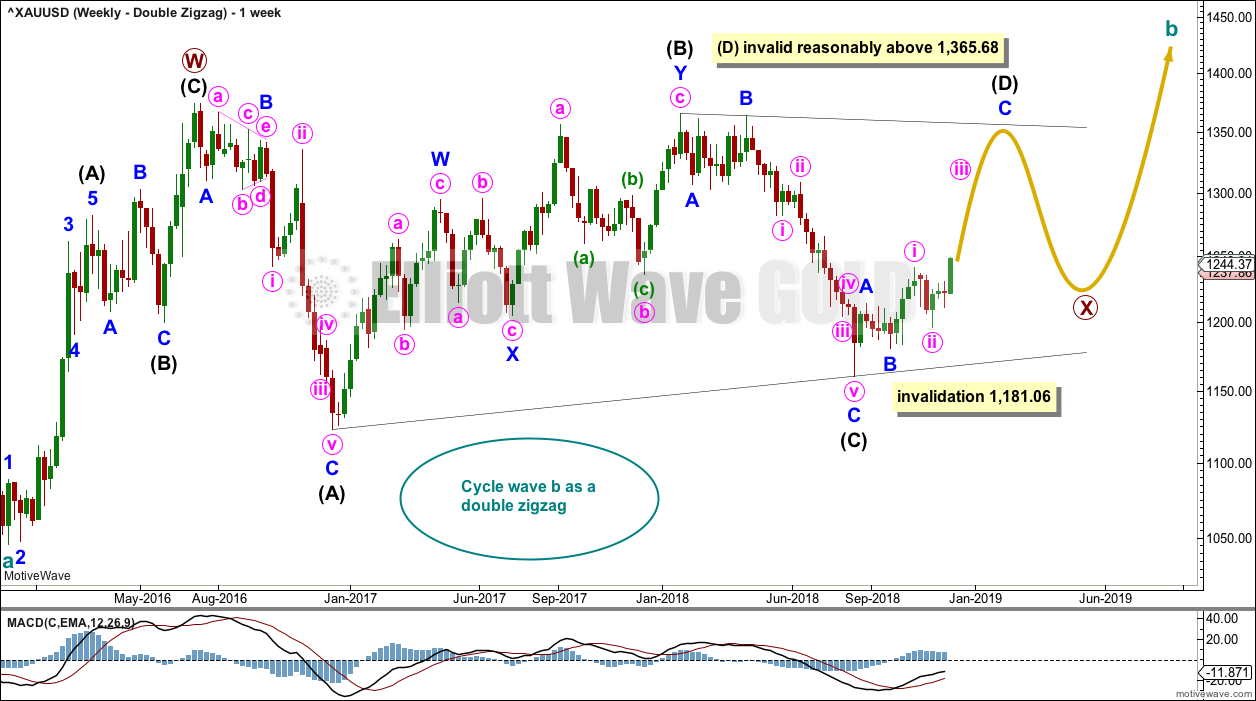
Click chart to enlarge.
It is possible that cycle wave b may be a double zigzag or a double combination.
The first zigzag in the double is labelled primary wave W. This has a good fit.
The double may be joined by a corrective structure in the opposite direction, a triangle labelled primary wave X. The triangle would be about three quarters complete.
Within the triangle of primary wave X, intermediate wave (C) should be complete. Within intermediate wave (D), minor waves A and B may be complete. Minor wave C must subdivide as a five wave structure. Within minor wave C, minute wave ii may not move beyond the start of minute wave i below 1,181.06.
Intermediate wave (D) would most likely subdivide as a single zigzag.
This wave count may now expect choppy overlapping movement in an ever decreasing range for several more months.
Primary wave Y would most likely be a zigzag because primary wave X would be shallow; double zigzags normally have relatively shallow X waves.
Primary wave Y may also be a flat correction if cycle wave b is a double combination, but combinations normally have deep X waves. This would be less likely.
This wave count has good proportions and no problems in terms of subdivisions.
WEEKLY CHART – COMBINATION
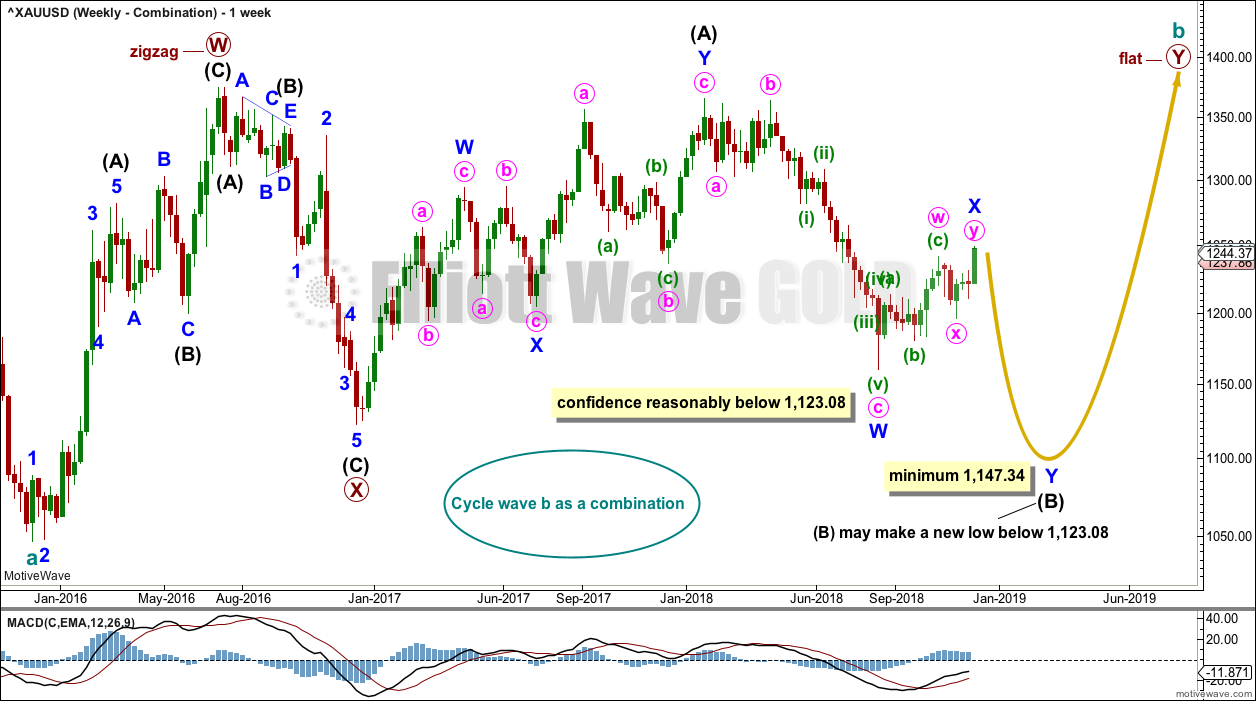
Click chart to enlarge.
If cycle wave b is a combination, then the first structure in a double may be a complete zigzag labelled primary wave W.
The double may be joined by a three in the opposite direction, a zigzag labelled primary wave X.
The second structure in the double may be a flat correction labelled primary wave Y. My research on Gold so far has found that the most common two structures in a double combination are one zigzag and one flat correction. I have found only one instance where a triangle unfolded for wave Y. The most likely structure for wave Y would be a flat correction by a very wide margin, so that is what this wave count shall expect.
Within a flat correction for primary wave Y, the current downwards wave of intermediate wave (B) may be a double zigzag. Intermediate wave (B) must retrace a minimum 0.9 length of intermediate wave (A) at 1,147.34. Intermediate wave (B) may move beyond the start of intermediate wave (A) as in an expanded flat.
Because the minimum requirement for intermediate wave (B) is not yet met, this wave count requires that intermediate wave (B) continues lower. This is the most immediately bearish of all four weekly wave counts.
When intermediate wave (B) is complete, then intermediate wave (C) would be expected to make at least a slight new high above the end of intermediate wave (A) at 1,365.68 to avoid a truncation. Primary wave Y would be most likely to end about the same level as primary wave W at 1,374.91, so that the whole structure takes up time and moves price sideways, as that is the purpose of double combinations.
While double combinations are very common, triples are extremely rare. I have found no examples of triple combinations for Gold at daily chart time frames or higher back to 1976. When the second structure in a double is complete, then it is extremely likely (almost certain) that the whole correction is over.
DAILY CHART – COMBINATION
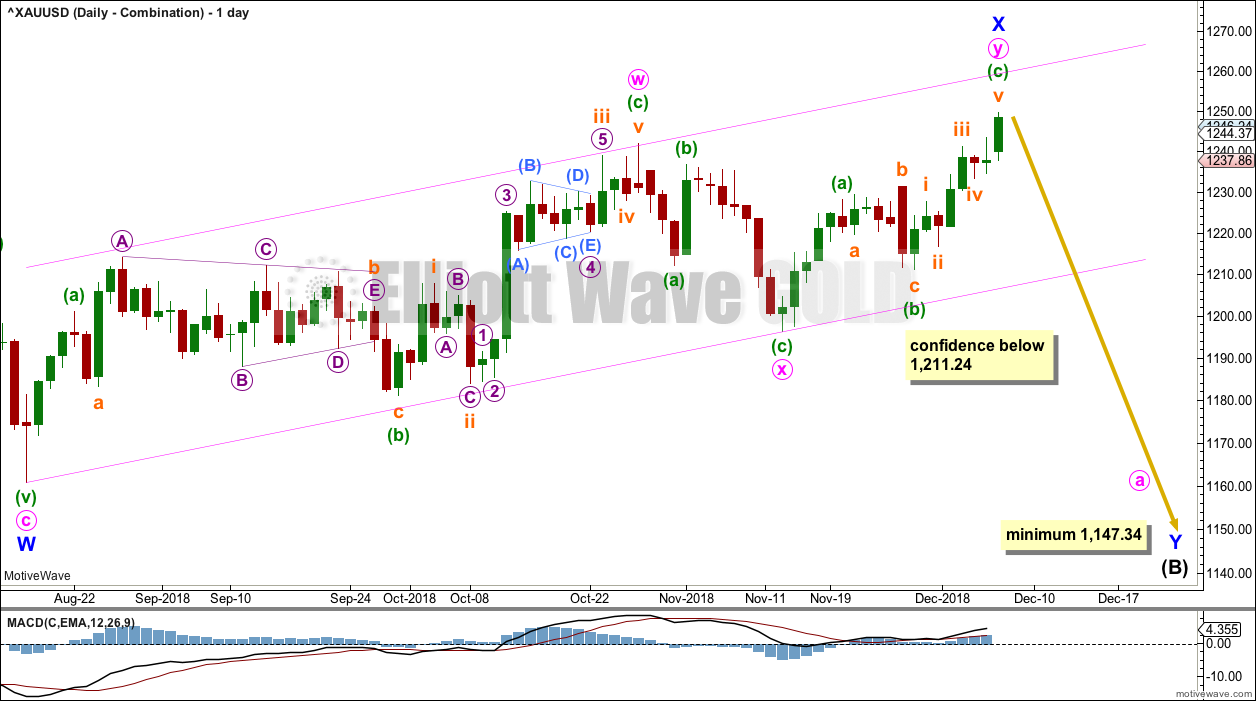
Click chart to enlarge.
Minor wave X may be a complete double zigzag.
The maximum number of corrective structures within a multiple is three. This number refers to W, Y and Z. Each of W, Y and Z may only be simple corrective structures; they may not be multiples. However, the total of three does not include X waves, so X waves may be any corrective structure including multiples and the Elliott wave rule is not violated.
While X waves may be multiples, they very rarely are. The probability of this wave count is reduced.
WEEKLY CHART – FLAT
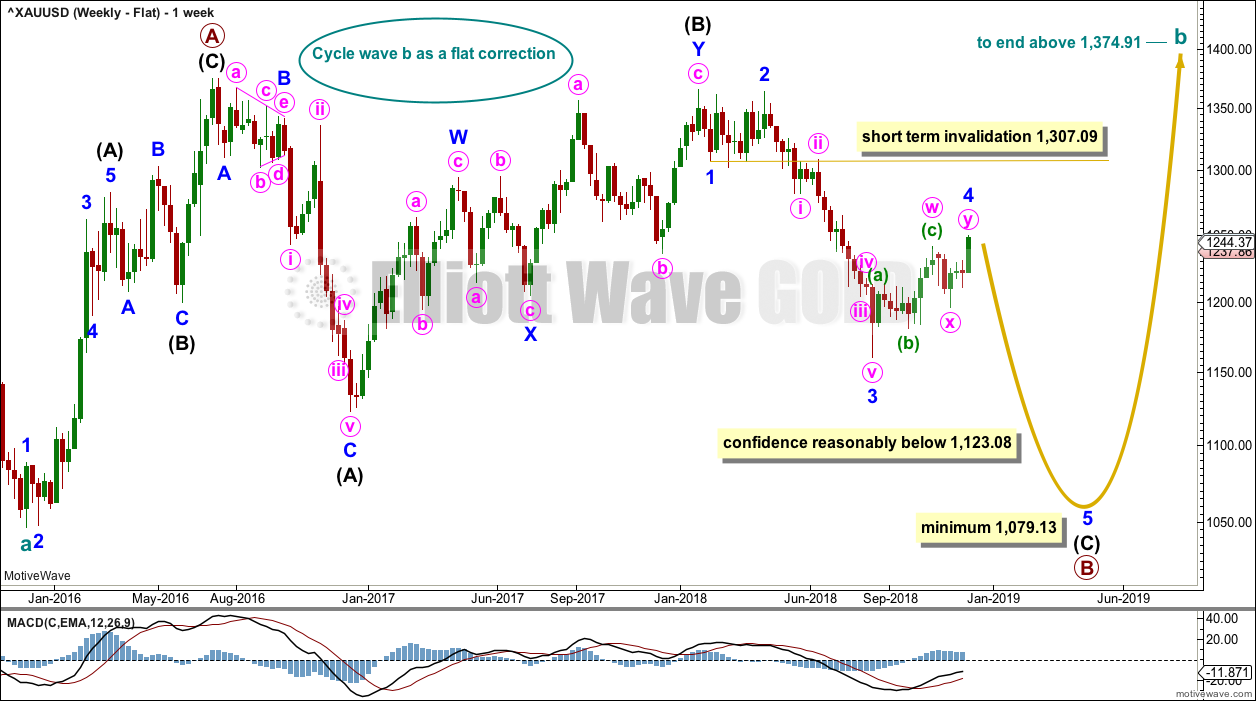
Click chart to enlarge.
It is possible that cycle wave b may be a flat correction. Within a flat correction, primary wave B must retrace a minimum 0.9 length of primary wave A at 1,079.13 or below. Primary wave B may make a new low below the start of primary wave A at 1,046.27 as in an expanded flat correction.
Only a new low reasonably below 1,123.08 would provide reasonable confidence in this wave count.
Intermediate wave (C) must subdivide as a five wave structure; it may be unfolding as an impulse. Within intermediate wave (C), minor waves 1 through to 3 may be complete. Today minor wave 4 is relabelled as possibly incomplete as a double zigzag.
Minor wave 2 lasted 9 weeks. If minor wave 4 is now complete, then it has lasted 16 weeks. Minor wave 4 would be longer in duration than minor wave 2 by a reasonable margin. For Gold this is unusual, so the probability of this wave count is further reduced.
TECHNICAL ANALYSIS
WEEKLY CHART
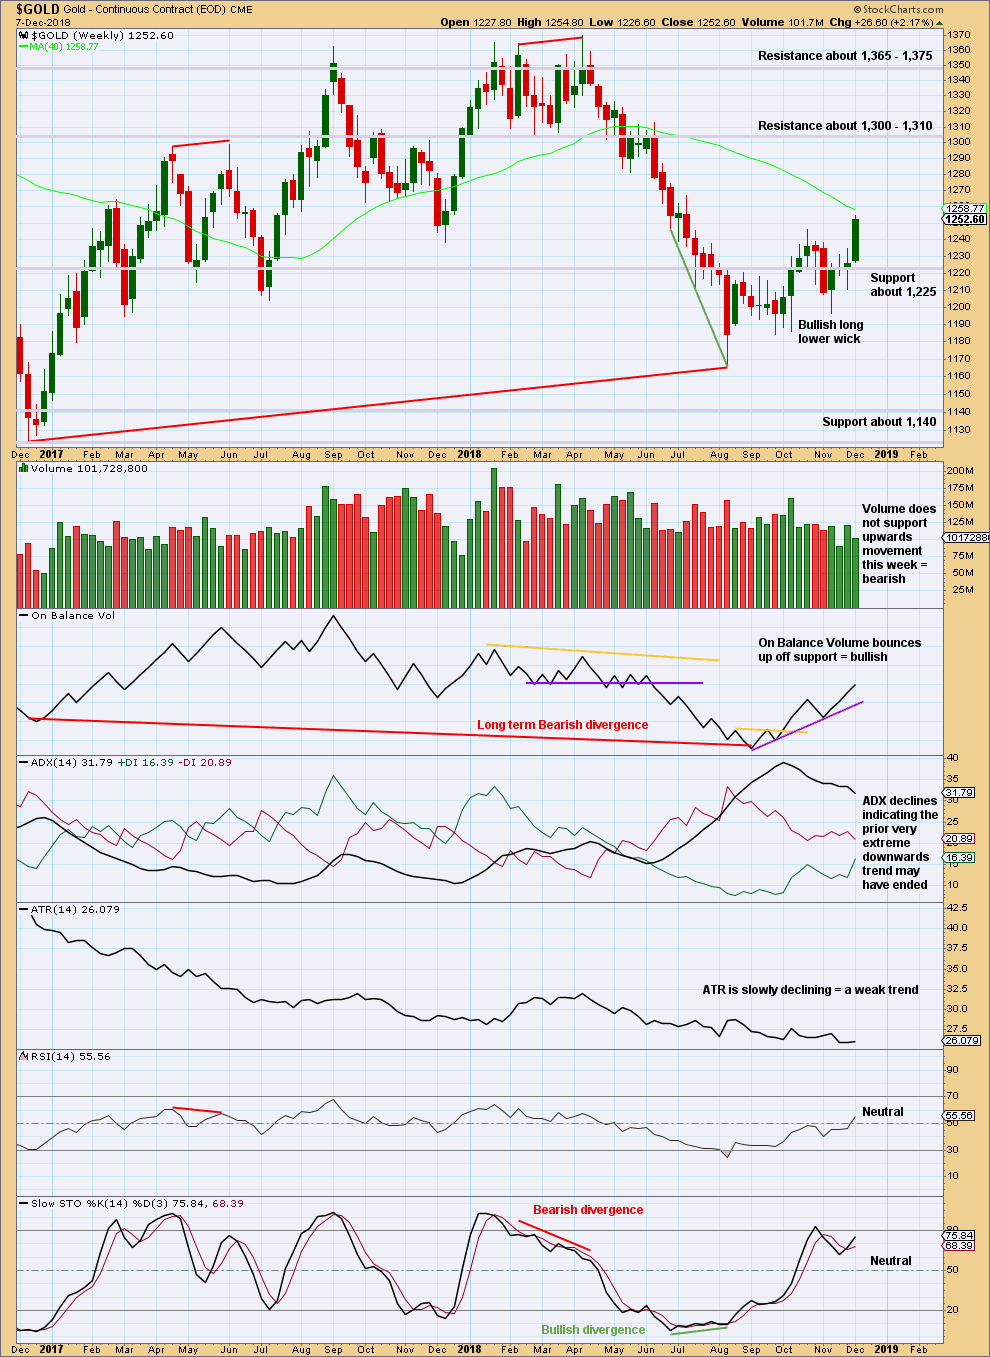
Click chart to enlarge. Chart courtesy of StockCharts.com.
On Balance Volume has made a lower low than its prior low at the end of November 2015. This divergence is extremely bearish but does not rule out a consolidation unfolding here; the divergence does strongly support the Triangle wave count, which expects a consolidation or bounce up to test resistance now and then a continuation of a major bear market. It could also support the flat wave count that allows for a new low below 1,046.27 in coming months.
A strong upwards week makes a new high. There is a series of higher highs and higher lows since mid August. There is strong resistance above about 1,300 to 1,310.
DAILY CHART
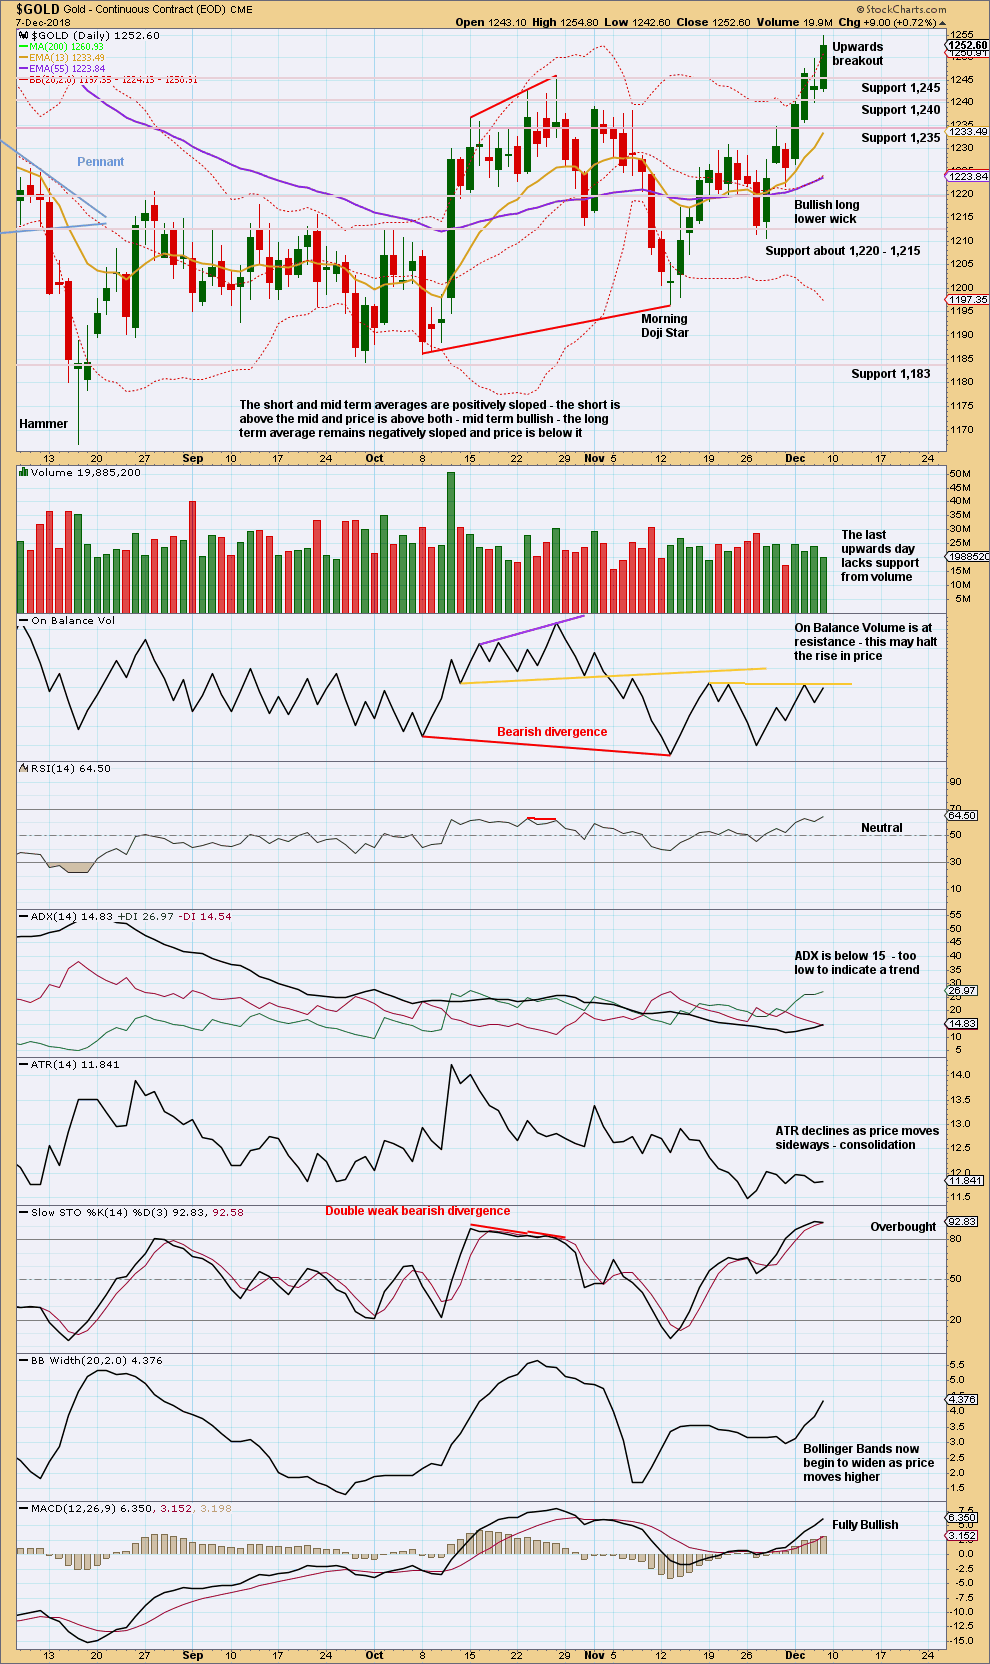
Click chart to enlarge. Chart courtesy of StockCharts.com.
The upwards breakout above 1,245 does not have support from volume. On Balance Volume at resistance may see a pullback about here. Look for support below about 1,245 to 1,235.
GDX WEEKLY CHART
Click chart to enlarge. Chart courtesy of StockCharts.com.
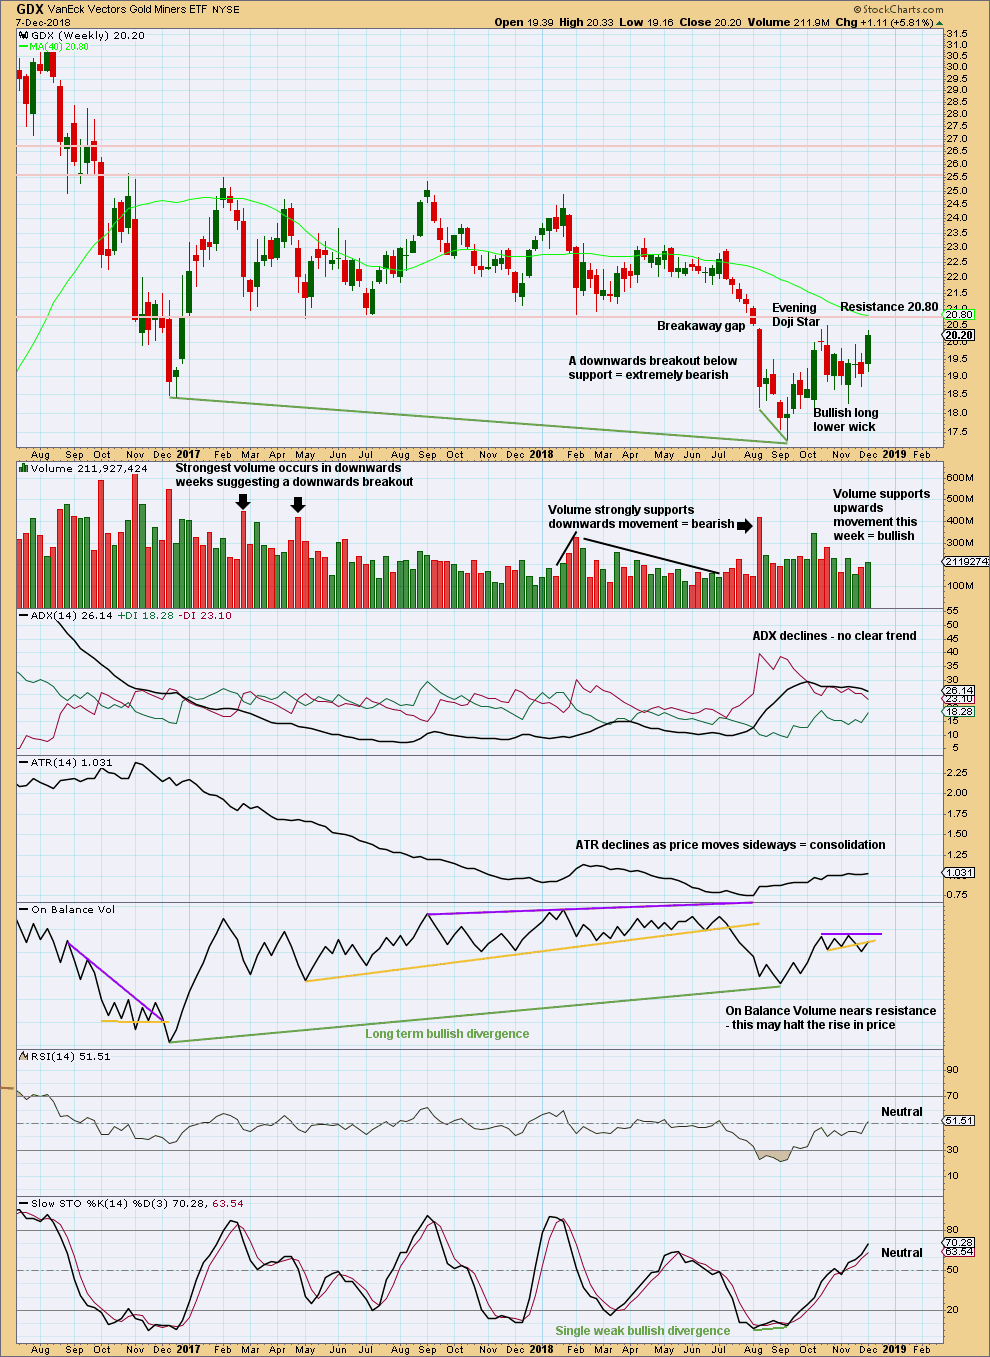
GDX had a large consolidation that lasted from January 2017 to August 2018. A downwards breakout below support at 20.80 in early August 2018 is highly significant. The breakout had support from volume, which adds confidence.
The target is at 16.02.
GDX DAILY CHART
Click chart to enlarge. Chart courtesy of StockCharts.com.
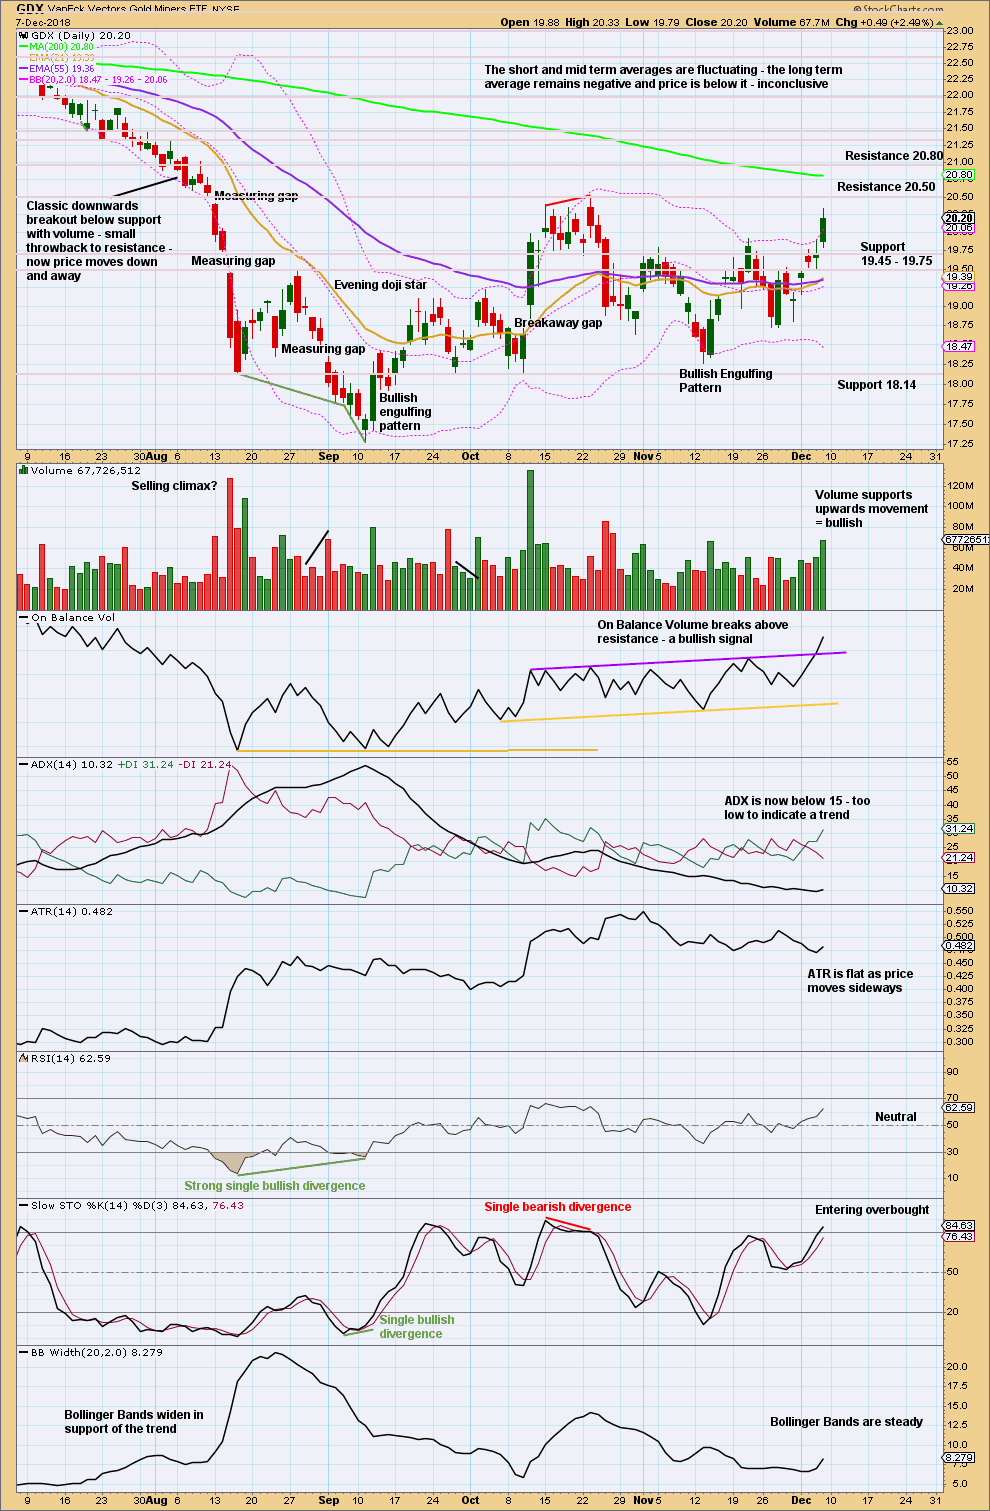
At the daily chart level, price is now within a consolidation that is bound by resistance above at 20.50 and support below at 18.14. It is the upwards day of the 11th of October that has strongest volume during this consolidation, suggesting an upwards breakout may be more likely than downwards. This technique does not always work, but it does work more often than it fails.
However, if price does break above 20.50, then it would be extremely likely to find very strong resistance just above at 20.80 and halt there. At a higher time frame that would look like a classic back test of resistance at prior support, identified on the weekly chart. If price does behave like that, it would offer a high probability low risk set up for a short position on GDX that may be held for the long term.
Upwards movement has support from volume and a bullish signal from On Balance Volume. Expect for the short term for price to move higher to 20.50.
US OIL
Members were advised in last analysis to expect a low in place when the channel on the daily chart was breached. This happened on the 4th of December.
Summary: A breach of the narrow channel on the daily chart in last analysis indicated an end to intermediate wave (1) and the start of intermediate wave (2). This correction may last about 5 to 13 weeks and may be very deep indeed. The first target will be the 0.618 Fibonacci ratio at 66.40, but this may not be high enough.
The larger picture still sees Oil in a new downwards trend to end reasonably below 26.06.
MAIN ELLIOTT WAVE COUNT
MONTHLY CHART
Click chart to enlarge.
Classic technical analysis favours a bearish wave count for Oil at this time.
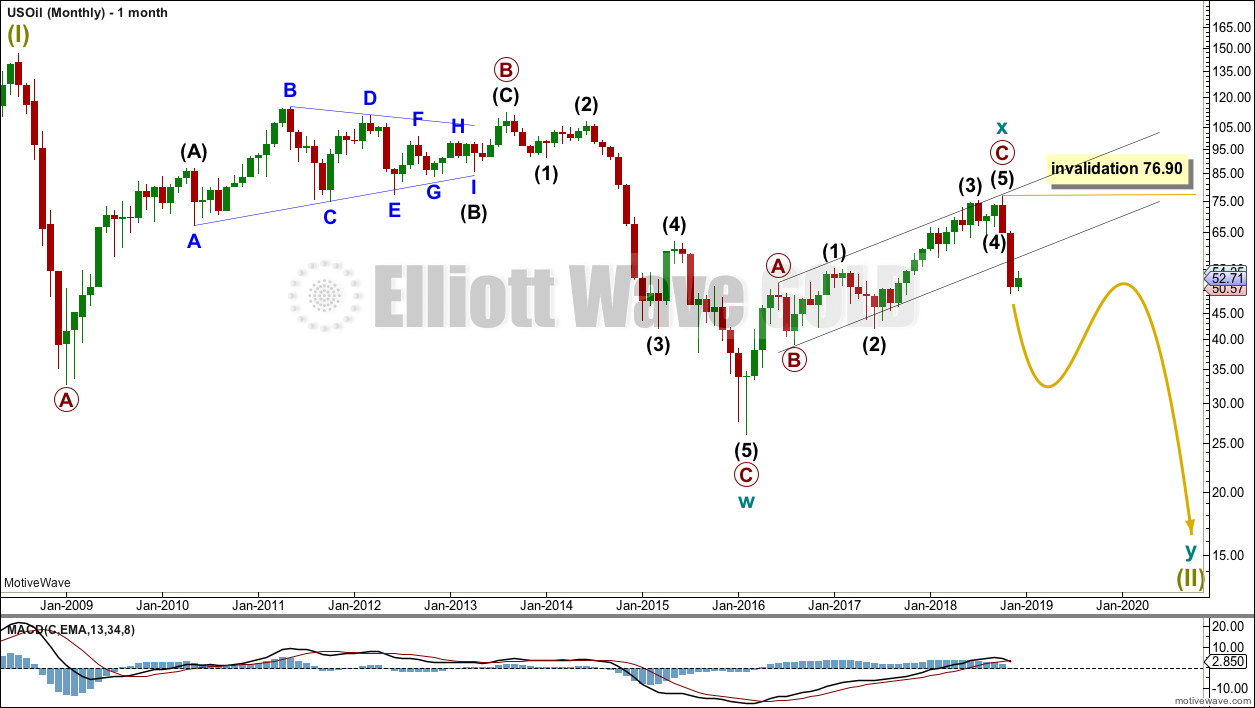
The large fall in price from the high in June 2008 to February 2016 is seen as a complete three wave structure. This large zigzag may have been only the first zigzag in a deeper double zigzag.
The first zigzag down is labelled cycle wave w. The double is joined by a now complete three in the opposite direction, a zigzag labelled cycle wave x.
The purpose of a second zigzag in a double is to deepen the correction when the first zigzag does not move price deep enough. Cycle wave y would be expected to move reasonably below the end of cycle wave w to deepen the correction. Were cycle wave y to reach equality with cycle wave w that takes Oil into negative price territory, which is not possible. Cycle wave y would reach 0.618 the length of cycle wave w at $2.33.
A better target calculation would be using the Fibonacci ratios between primary waves A and C within cycle wave y. This cannot be done until both primary waves A and B are complete.
Within cycle wave y, no second wave correction nor B wave may move beyond its start above 76.90.
WEEKLY CHART
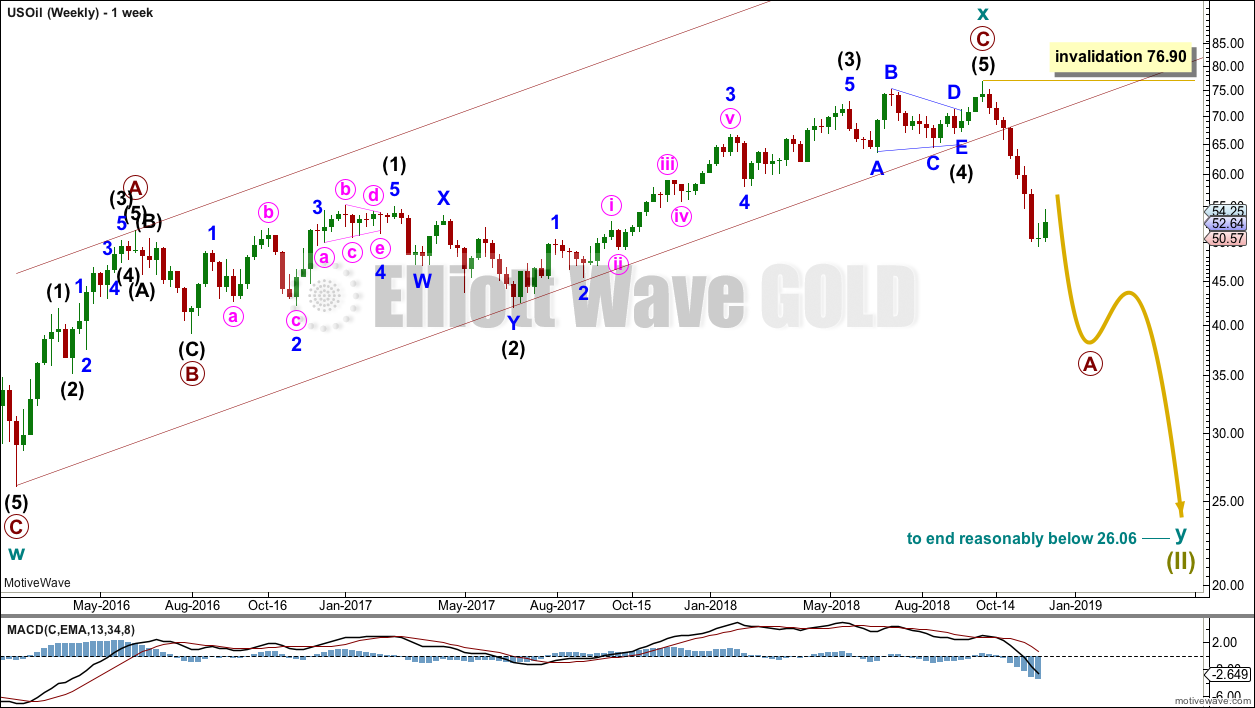
Click chart to enlarge.
Cycle wave x is seen as a complete zigzag. Within the zigzag, primary wave C is a five wave impulse and within it intermediate wave 4 is a triangle.
A new low below 51.67 has added confidence in this bearish wave count. At that stage, the bullish alternate was invalidated.
Cycle wave y is expected to subdivide as a zigzag. A zigzag subdivides 5-3-5. Primary wave A must subdivide as a five wave structure if this wave count is correct.
Within primary wave A, intermediate wave (1) may now be complete. Intermediate wave (2) may be very deep.
DAILY CHART
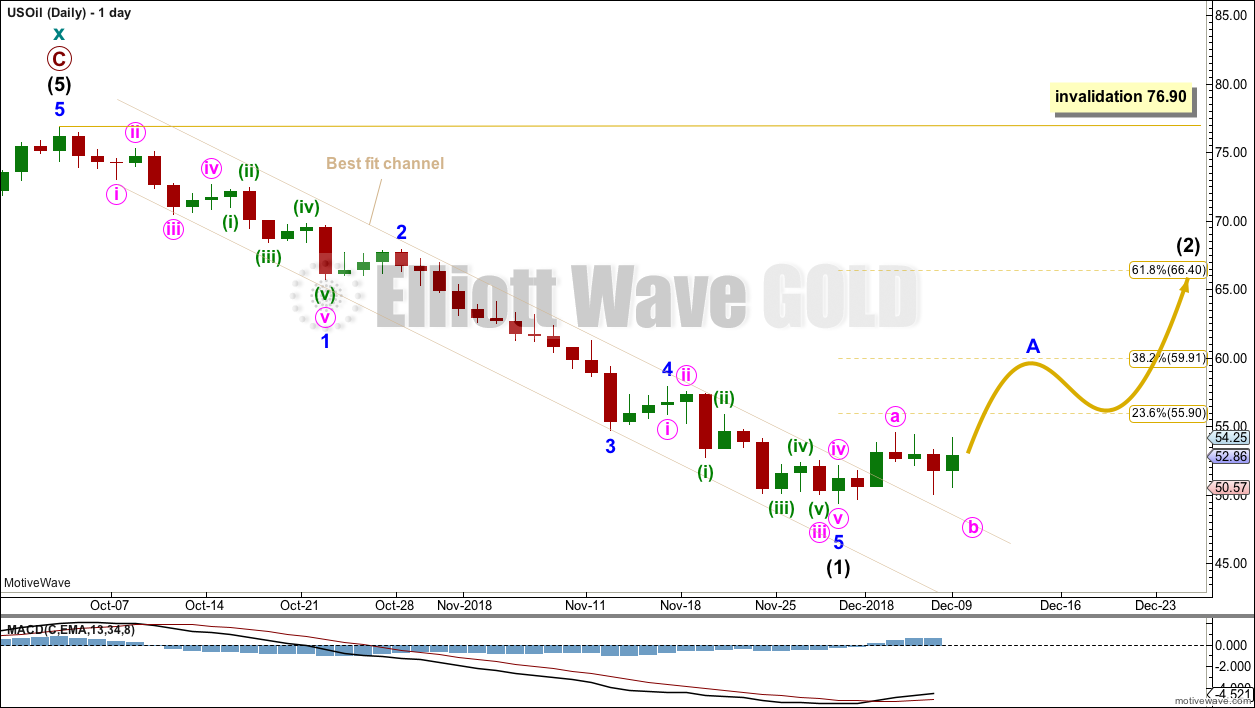
Click chart to enlarge.
Attention now turns to the structure of downwards movement. An impulse may now be complete. This is labelled intermediate wave (1).
Within intermediate wave (1), minor wave 3 exhibits no Fibonacci ratio to minor wave 1 and minor wave 5 is 0.40 longer than 0.618 the length of minor wave 3.
The narrow best fit channel about intermediate wave (1) was clearly breached on the 4th of December. At that stage, this analysis expected that intermediate wave (1) should be over and intermediate wave (2) should be underway.
Intermediate wave (2) may subdivide as any corrective structure except a triangle. It would most likely be a zigzag (zigzags are the most common corrective structures). It is impossible to tell which structure it may be at the start, and as it unfolds labelling within it will change.
Intermediate wave (1) lasted 7 weeks. Intermediate wave (2) may be expected to have reasonable proportion to intermediate wave (1), so that the wave count has the right look. Intermediate wave (2) may last a Fibonacci 5, 8 or even 13 weeks if it is a more time consuming correction like a combination.
Intermediate wave (2) may not move beyond the start of intermediate wave (1) above 76.90.
For Oil the first large second wave correction within a new trend can be extremely deep. This does not always happen, but it is a fairly common tendency; we should be aware of this possibility here.
TECHNICAL ANALYSIS
MONTHLY CHART
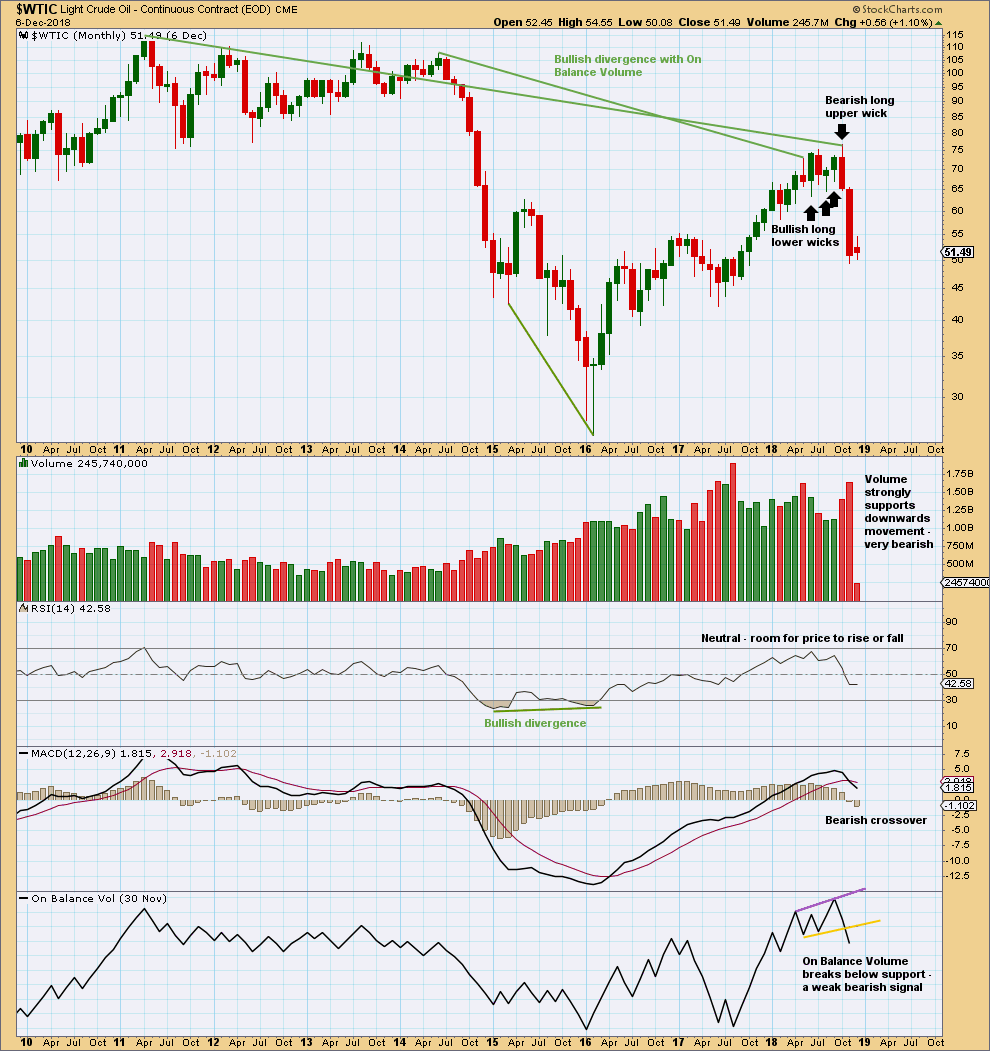
Click chart to enlarge. Chart courtesy of StockCharts.com.
The month of November has a very small lower wick. This is still fairly bearish.
The signal from On Balance Volume is weak because the trend line breached had only two anchor points and a reasonable slope. But it is still a bearish signal.
WEEKLY CHART
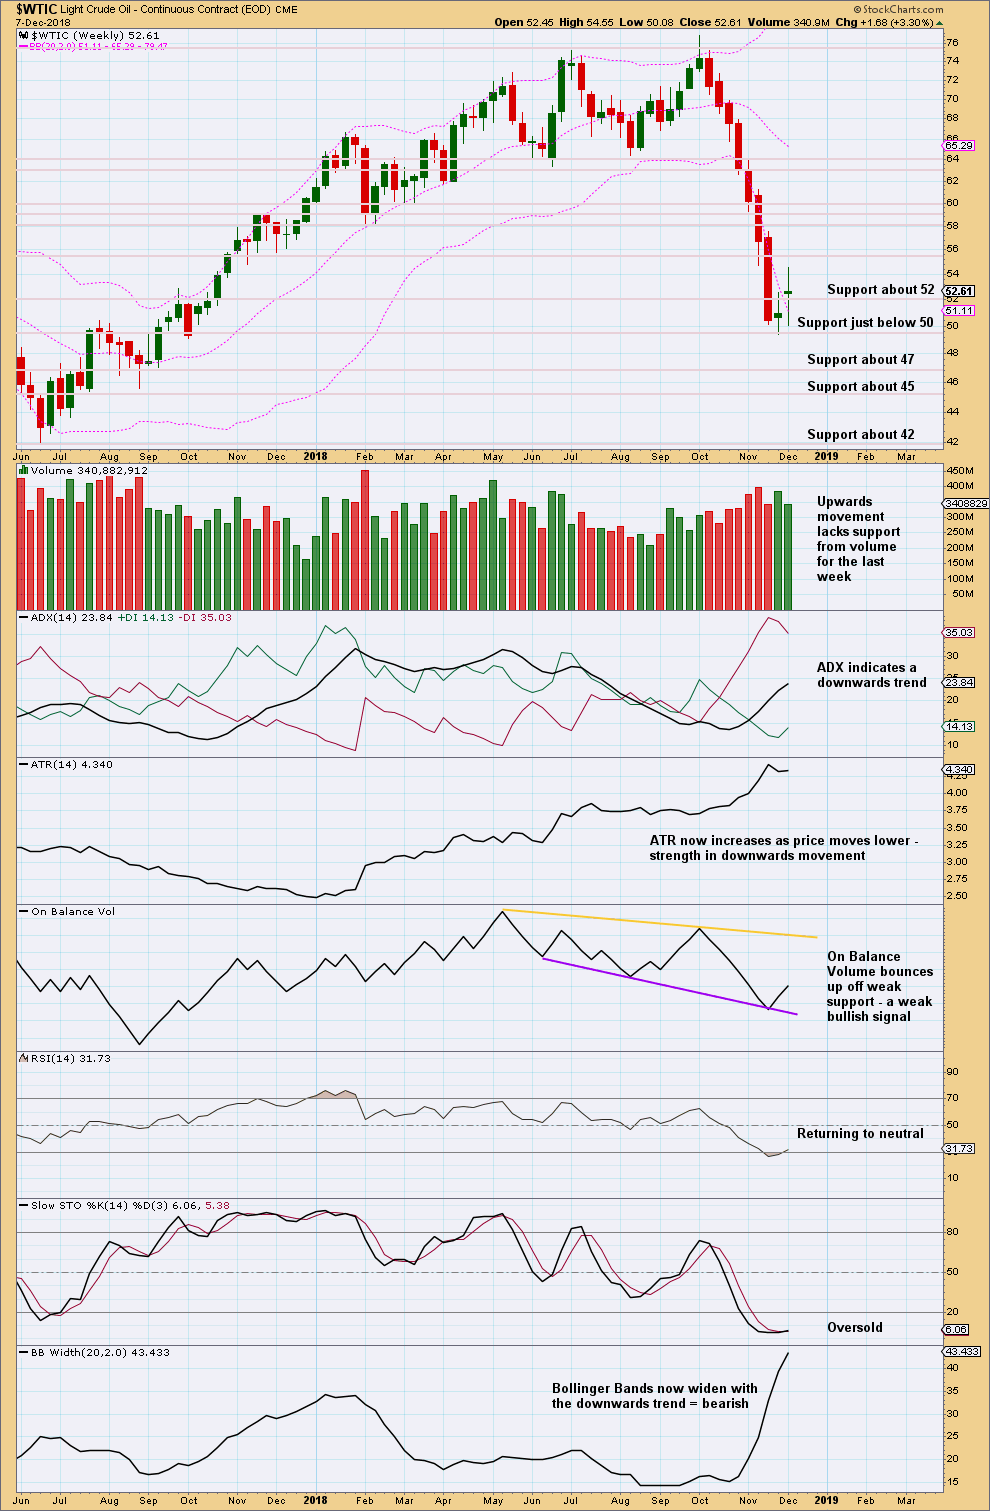
Click chart to enlarge. Chart courtesy of StockCharts.com.
The doji on its own is not a candlestick reversal pattern. With last week’s real body inside the real body of last week’s real body, the candlestick cannot be part of a Morning Doji star either.
The signal last week from On Balance Volume is weak because the trend line it bounced up from had only two prior anchor points and has a reasonable slope.
The last two green weekly candlesticks do not complete a reversal pattern. The long wicks indicate some indecision. This looks like an interruption to the downwards trend and not like a new upwards trend. This supports the Elliott wave count.
DAILY CHART
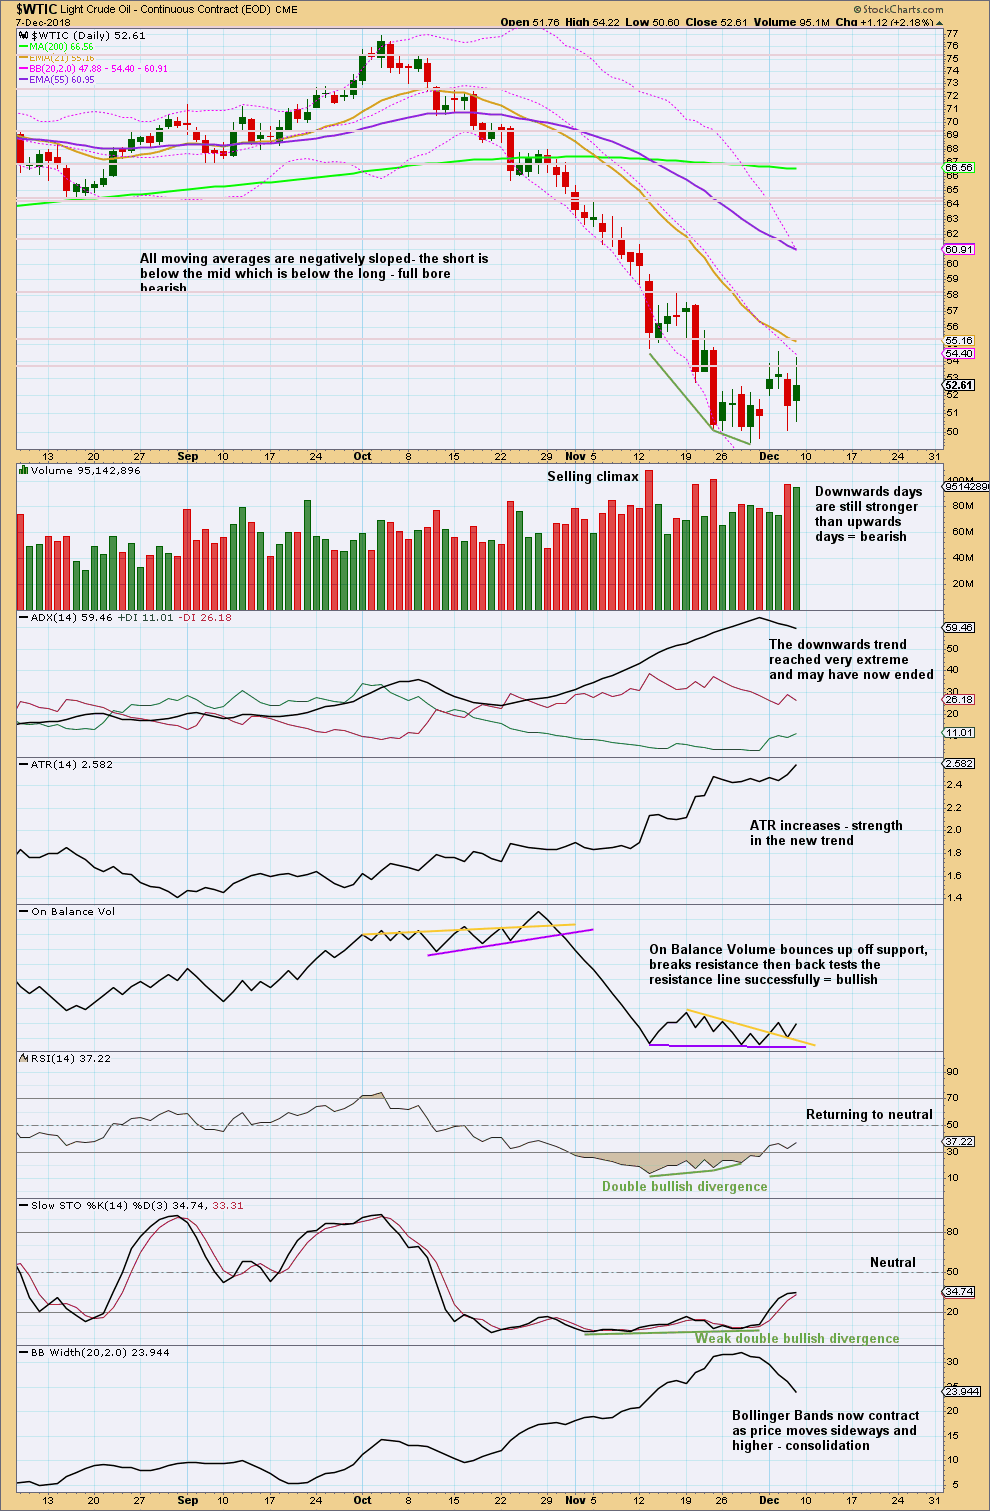
Click chart to enlarge. Chart courtesy of StockCharts.com.
I have taken some time to look back at the last strong bearish trend from Oil from about May 2014 to January 2016. I have noticed that downwards waves often end with support from volume, and sometimes do not even end with a long lower wick. Bullish reversal patterns are often but not always found at lows. RSI can reach very extreme and remain so for as long as three months when this market has a strong downwards trend. At lows Stochastics often will exhibit bullish divergence, but this can be rather weak. At lows RSI sometimes, not always, exhibits bullish divergence and can remain deeply oversold for long periods of time.
US Oil is a particularly difficult market to find lows in. It can trend strongly for very long periods of time with indicators remaining very extreme.
At the daily chart level, there is no candlestick reversal pattern at the low. Sideways movement of this last week looks like a consolidation within a downwards trend. It may form a flag or pennant pattern.
Look for resistance just above 55 and next above that about 58.
—
Always practice good risk management as the most important aspect of trading. Always trade with stops and invest only 1-5% of equity on any one trade. Failure to manage risk is the most common mistake new traders make.
Hi Lara
Clarification on your note for oil, if your last point above about the sideways movement appears more to be a pause in the downwards trend then I assume the wave 1 down may still not be complete?
Because this sideways movement doesn’t fit into the previous downwards channel, no, it’s not part of that downwards wave.
The sideways movement may be a reasonably time consuming consolidation.
Hi Lara,
For S&P 500…
I really believe the AD line theory and it is extremely hard to go against 90 years of history. So, let’s assume that this is true for this time as well that we will see at least 4 months of divergence between the AD line top and the price top. In other words, I would give this the biggest weight as far as the indicator for the end of the bull market, even bigger than your monthly Elliott wave counts. I am playing Devil’s advocate…
From Friday’s movement, I believe that there is still downside for the S&P 500 to go to 2540 or so and it would be still be in the upward channel if you draw the line from the 2011 and 2016 lows and project it to today (see attached chart)…
I looked also at other US indices using stockcharts.com…. I looked at $MID, $NYSE, QQQ, $COMPQ, $RUT and none of them has broken their respective upward channels if you draw the line from the bottom of 2011 and 2016 and project it to today… But there is still room for all them to move lower and still be in a bull market….
I have to admit that my strength is more on the classical analysis side and my weakness is on the Elliott wave side….
How confident are you with your monthly Elliott wave count for Super Cycle Wave V? I was not your member during Cycle I but that wave count looks iffy in my opinion with Primary wave 5 being very short and truncated. Is there a link to the explanation of why you did that count? In addition, is it possible as well that Cycle Wave III is an extended one and that we are currently doing cycle Wave IV instead and we are about to do cycle wave V soon and for this to end in 2020-2021? I just see this correction as a bigger one and would be comparable to the one in 2011.
Bottom line, I am just playing devil’s advocate here and I am assuming that the AD line theory still holds since we have 90 years of history and I am challenging that maybe your monthly Elliott wave count for Super Cycle Wave 5 is wrong…. I just can’t get my head around the count of Cycle I plus I can’t see this bull market ending with none of the above US indices breaking the classic analysis channels…. Hence, I am hoping that you can review your monthly count for Super Cycle Wave V to see if it is still correct with all the new information you now have from this correction.
Thanks Lara, I appreciate all the hard work….
Mathieu
This is how I have counted cycle I.
I have done this because it gives good proportion between primary waves 2 and 4 within it, and then allows for cycle II to look like a three wave structure.
The truncation for primary wave 5 comes before a very strong downwards movement, which is the kind of context in which a truncation may occur. And so I am comfortable with this part of the count.
The problem with seeing cycle wave I over at 1,370.58 is then cycle wave II does not fit as a corrective structure. And because it came within the context of a bull market, that downwards wave is most definitely a corrective structure.
Seeing cycle wave I over at the price extreme of 1,370.58 on the week of 1st May 2011 doesn’t work. Or at least, I can’t make it work.
but I will chart the idea that cycle wave III could have just ended at the last ATH and the current move down could be cycle wave IV. That certainly has merit, and I can see how it could work.
And while I know what you’re meaning, I don’t think the Devil needs anymore advocates. He appears to have quite enough already.
Chart of cycle wave I
haha… Thanks Lara… I appreciate it….
I know it is weird time as we want to be at the right place with the right EW call and not to have the invalidation points dictate our trading…
The reason why I see 2020-2021 when this will all end is because I charted QQQ:$SPX on a monthly chart and I can see it end at that time using long term indicators with perfect symmetry. And as you know, it is the big caps of QQQ that’s driving the SPX to new highs…
It is just another way for me to see it…
Cheers,
Mathieu
Hello Lara and Matthieu,
I also et the feeling that this correction could be different (as in Wave IV)… I don’t know what you think but the geometry looks quite convincing to me. Another thing could be the Fibonacci extension of Wave III up to 2,618…?
On a lighter note, how about checking the following video on Elliott Waves and skirt sizes… https://youtu.be/rHFJueDG_Yg After watching the video, you may google the 2019 spring fashion. I am shocked! 🙂
Regards to all.
Fady (Barcelona, Spain)
Fady, when I look at fashion I see a real mix of hemlines.
I’ve found it hard to buy skirts and dresses at mid length (just below the knee) which I personally prefer, for years now. They’re either really short, really long, or that awful “mullet” fashion – short in the front and long in the back.
It’s all over the place.
I’m waiting for skirts to be only short before the top is in. That is, if the “hemline” index is really a thing.
That’s what I see. What do you see in Spain?
Fady, I’ve just charted your idea.
It fits, technically. But it has horrible proportions.
Within cycle wave III, primary 2 would have lasted 4 weeks, and primary wave 4 would have lasted 62 weeks. That’s the biggest problem.
Within primary wave 5 of cycle wave III; the middle of the third wave would have disproportion at minor degree.
In my judgement, it has a very low probability.
I don’t know… I see an extended 5 five structure for Cycle III…. Anyway, maybe I am wrong…
I still think that there is a high probability that we are doing Cycle IV currently….
I am keeping my options open…
I really believe the AD line theory… We did a new low today….
Hello Lara!
Hope you had a good weekend and thanks a lot for this week’s analysis and your replies over here!
Regarding current fashion in Spain, you may wish to check the following link (Zara). Surprisingly the first image is of the miniskirt for this winter which we readily see on the streets and in cafés despite the cold weather… Zara does introduce lower hems too, even they look confused! Or is it a prediction?
Thanks again and kind regards.
Fady
Sorry I forgot to paste the link: https://www.zara.com/es/es/mujer-faldas-l1299.html?v1=1074619