
Downwards movement has unfolded for the week as expected from technical analysis and the main Elliott wave count.
Summary: Silver has had a very long consolidation from about November 2016 to July 2017. A technical principle is the longer price consolidates, the stronger and longer lasting the next trend may be.
The breakout was down. The long-term target for the current downwards trend remains at 12.08.
The larger trend remains down until proven otherwise.
Monthly charts were reviewed here.
New updates to this analysis are in bold.
ELLIOTT WAVE COUNTS
MAIN WAVE COUNT
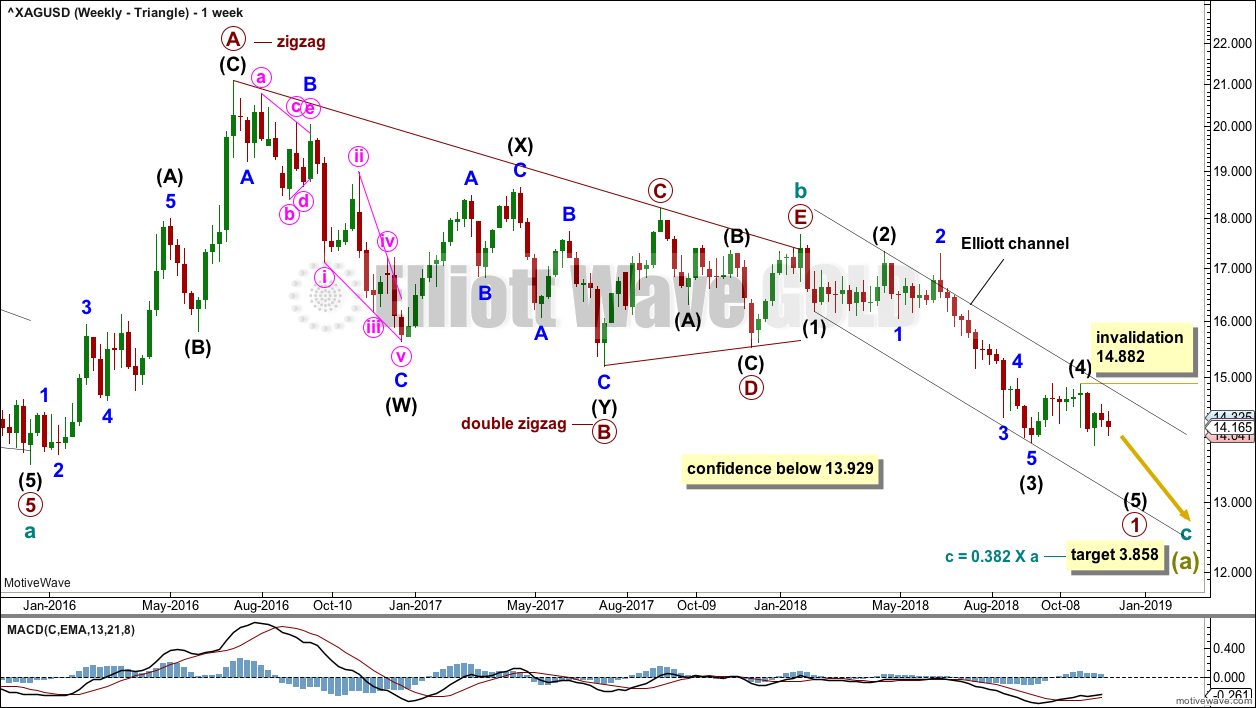
WEEKLY CHART – TRIANGLE
Click chart to enlarge.
This first wave count has good support from classic technical analysis, so it will be favoured. This wave count looks likely.
The first wave count expects that the bear market, which began from the April 2011 high, is incomplete.
Cycle wave a is seen as a five wave impulse for this main wave count.
This first weekly chart sees cycle wave b as a now possibly complete regular contracting triangle.
Primary wave E of the triangle may have ended with an overshoot of the A-C trend line.
Within cycle wave c, primary wave 1 may be an incomplete impulse. Within primary wave 1, intermediate waves (1), (2), (3), and now (4) may be complete.
Within intermediate wave (5), no second wave correction may move beyond its start above 14.882.
Intermediate wave (2) was a deep 0.77 flat correction lasting ten weeks. Intermediate wave (4) may now be a complete shallow 0.28 double combination lasting seven weeks. There is perfect alternation and very good proportion. This part of the wave count now has the right look.
The Elliott channel is drawn from the ends of intermediate degree waves. Intermediate wave (4) remains contained within this channel.
DAILY CHART – TRIANGLE

Click chart to enlarge.
Intermediate wave (4) may be a complete double combination.
Within intermediate wave (5), minor wave 1 fits well as a complete impulse and minor wave 2 may be a complete zigzag, which may also move higher as a double zigzag. Minor wave 2 may not move beyond the start of minor wave 1 above 14.882.
Silver behaves like a typical commodity. It often exhibits swift strong fifth waves. While this tendency is especially prevalent for its fifth waves to end third wave impulses one degree higher, it can also show up for fifth waves to end first wave impulses. Look out for the possibility that intermediate wave (5) may be very swift and strong, ending with a selling climax. This is not a certainty, but the possibility exists and so we should be aware of it.
There is no adequate Fibonacci ratio between intermediate waves (3) and (1). This makes it more likely that intermediate wave (5) may exhibit a Fibonacci ratio to either of intermediate waves (3) or (1); the most common Fibonacci ratio for a fifth wave is equality in length with the first wave.
ALTERNATE WAVE COUNT
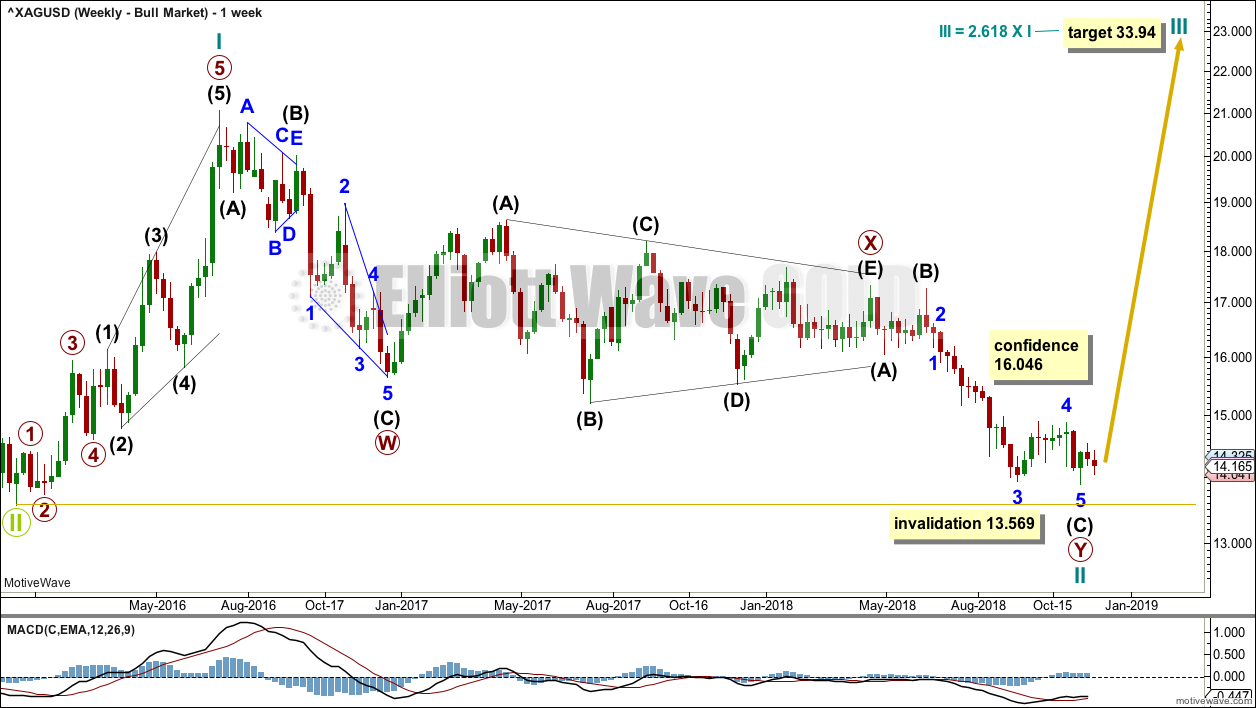
WEEKLY CHART – BULL WAVE COUNT
Click chart to enlarge.
Cycle wave II may be a complete double zigzag. Cycle wave II would be very deep at 0.96 of cycle wave I. This is typical behaviour for the first second wave correction within a new trend for commodities.
A five wave impulse (down) for intermediate wave (C) may be complete. However, the disproportion between minor waves 2 and 4 gives this part of wave count the wrong look.
If it continues any further, then cycle wave II may not move beyond the start of cycle wave I below 13.569.
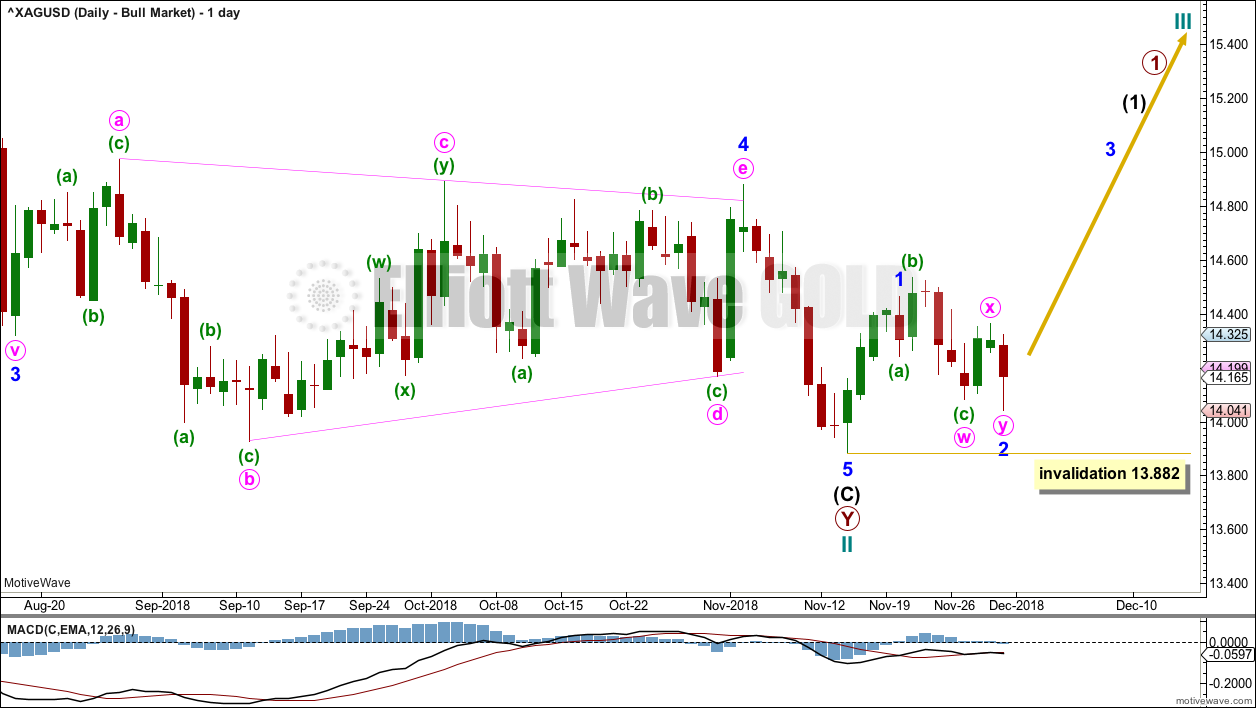
DAILY CHART – BULL WAVE COUNT
Click chart to enlarge.
If cycle wave II is over, then the new trend up for cycle wave III should begin with a five wave structure.
Cycle wave III may only subdivide as an impulse. So far primary wave 1 would be incomplete.
Within primary wave 1, intermediate wave (1) may be incomplete.
Within intermediate wave (1), minor wave 1 may be complete. Minor wave 2 may be moving lower as a double combination. Minor wave 2 may not move beyond the start of minor wave 1 below 13.882.
TECHNICAL ANALYSIS
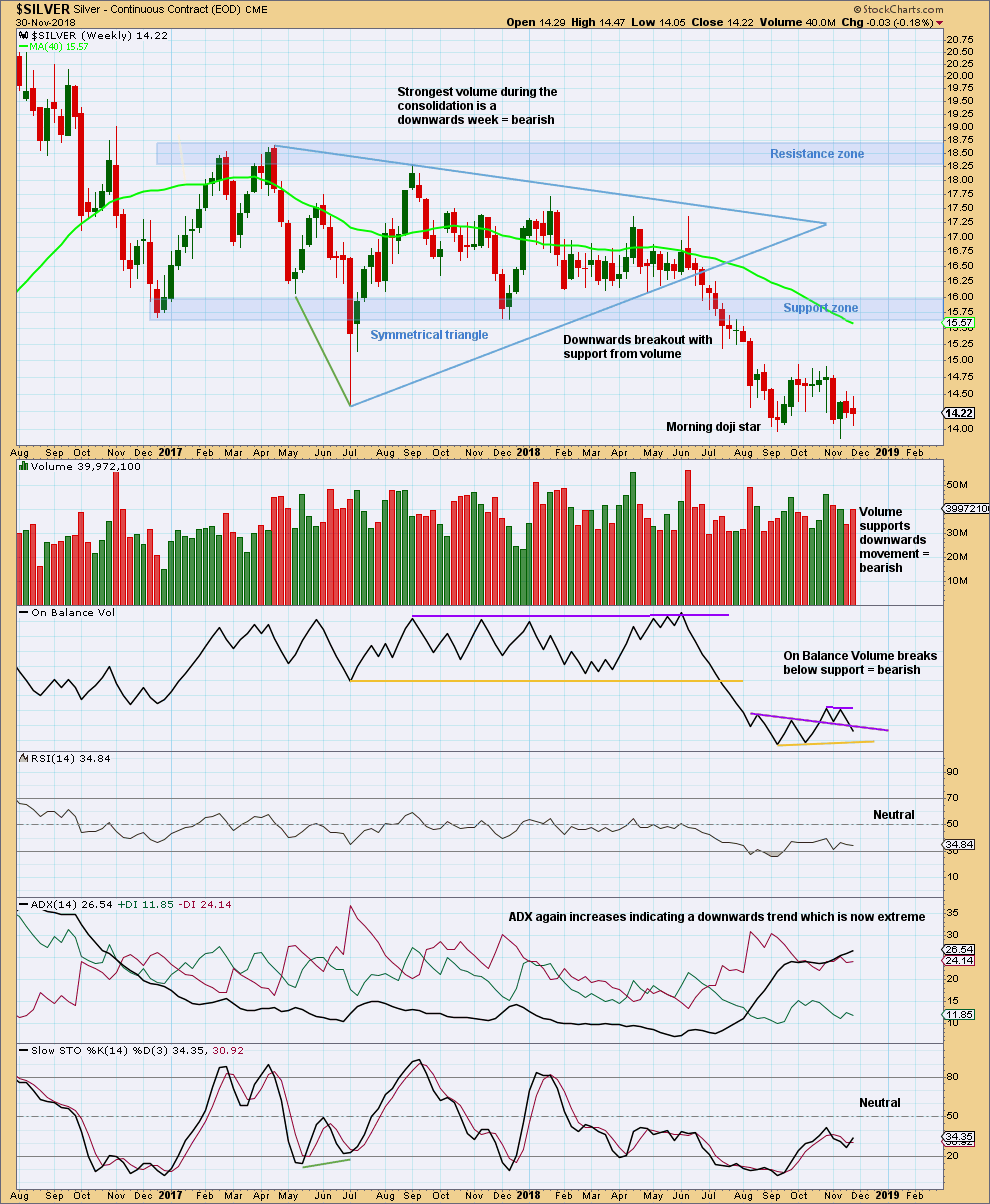
WEEKLY CHART
Click chart to enlarge. Chart courtesy of StockCharts.com.
Silver has seen a classic downwards breakout from the shaded support zone, which then provided resistance for a small back test.
A target from the breakout of the symmetrical triangle is about 12.08.
The last week completes a Spinning Top candlestick pattern, which remains within a fairly narrow trading range.
However, bearish volume and a bearish signal from On Balance Volume this week suggest more downwards movement next week. This supports the main Elliott wave count.
DAILY CHART
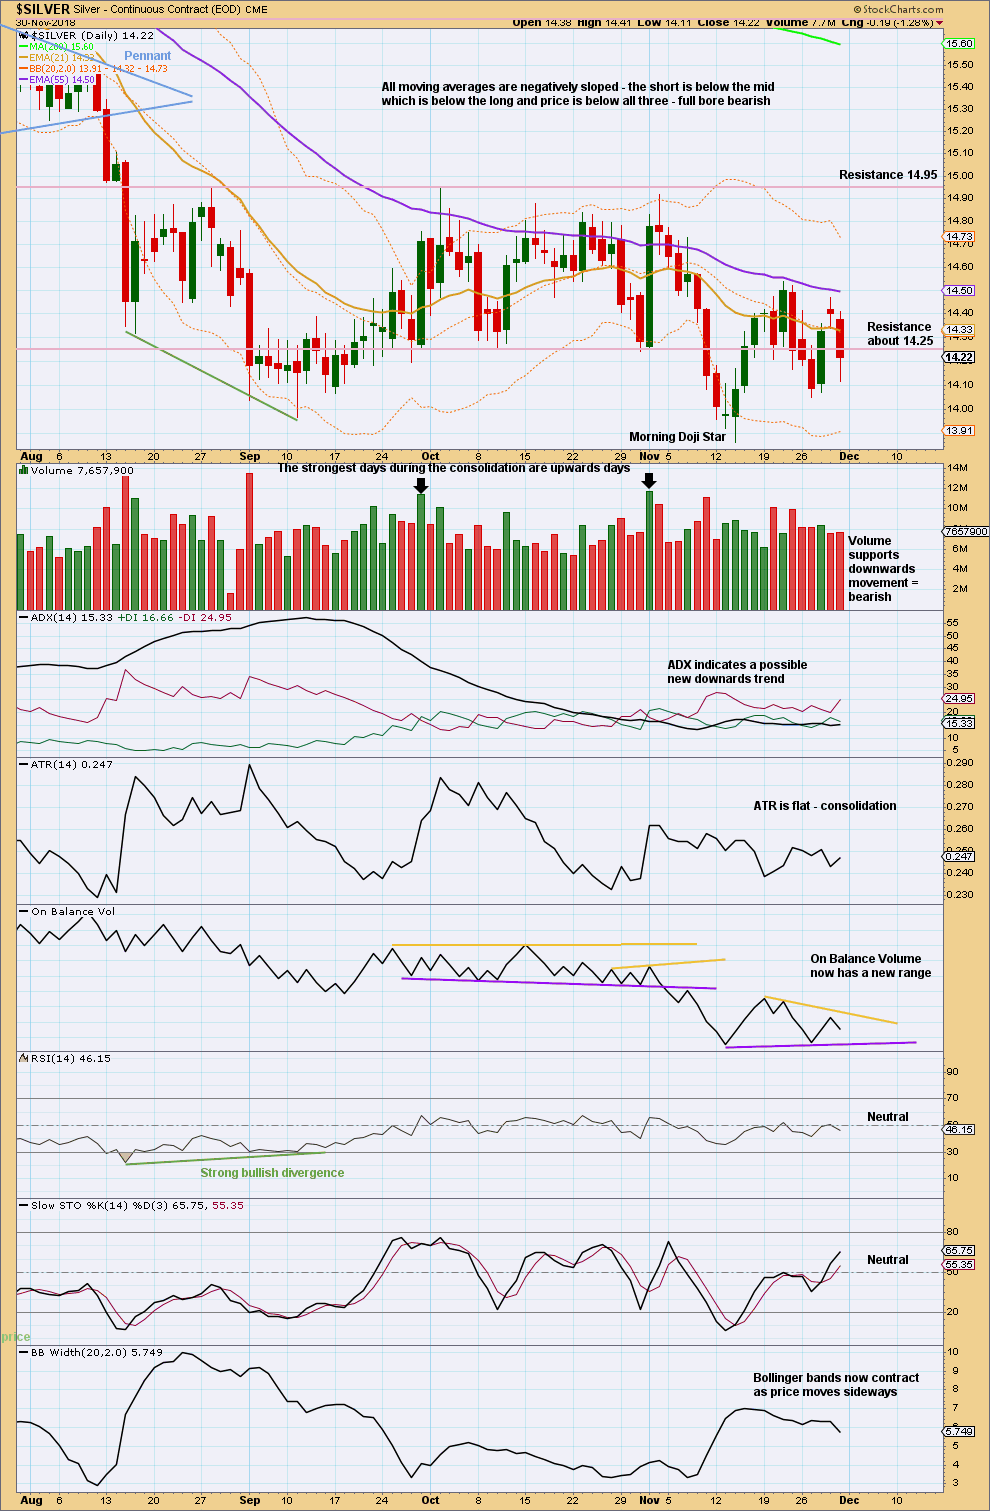
Click chart to enlarge. Chart courtesy of StockCharts.com.
Friday’s candlestick has a long lower wick, which is slightly bullish. There is support from volume for downwards movement during Friday’s session, but not much.
Watch On Balance Volume carefully next week for a breakout from the new range.
Published @ 06:57 p.m. EST on December 1, 2018.
—
Careful risk management protects your trading account(s).
Follow my two Golden Rules:
1. Always trade with stops.
2. Risk only 1-5% of equity on any one trade.
Hi Lara. The gold analysis has the main elliott wave moving up to 1295 in the short term. The main silver has it moving down. The two usually work in lock step. Do you see a disconnect of this long standing attachment.
You’ve assumed that there is a positive correlation between the price of Gold and the price of Silver. Luckily there is a simple mathematical tool to determine if this assumption is correct.
At both the daily and weekly chart levels these two markets do not have a reliable positive correlation. Currently the correlation between the two is too weak to be said that it is due to a real relationship between them, it is less than 0.5. Sometimes they may have a correlation co-efficient which is less than 0.
Any positive correlation above 0.5 they have from time to time cannot be assumed to continue, because the math proves it has not in the past. Past data is all we have to go on.
For how to use a correlation co-efficient see this article.
I’ve added the correlation co-efficient to the bottom of these charts.
And here’s the daily chart.
Also, if you note the dates of major turning points for Gold and Silver you’ll see that they don’t always turn together. They can have major points which are months apart.
At the daily chart level these two markets do currently have a strong positive correlation. But this chart also shows that as recently as October that correlation had completely broken down to 0.
My point is that because they are not always correlated, we cannot assume that they should be correlated in the future.