
The Elliott wave count remains the same. It expected more sideways movement.
Summary: A sideways consolidation is now expected for a fourth wave to continue still for another few sessions. It may be very shallow, with support about 1,277 and resistance about 1,297. The breakout is expected to be upwards, and the resulting movement may be surprisingly short and brief.
If price now moves reasonably above 1,296.77, then the triangle could be complete and an upwards breakout should be underway. The target would then be at 1,312.
New updates to this analysis are in bold.
Grand SuperCycle analysis is here.
Last historic analysis with monthly charts is here.
Only two remaining wave counts have a reasonable probability and are published below: a triangle (the preferred wave count) and a double zigzag.
MAIN ELLIOTT WAVE COUNT
WEEKLY CHART – TRIANGLE
Click chart to enlarge.
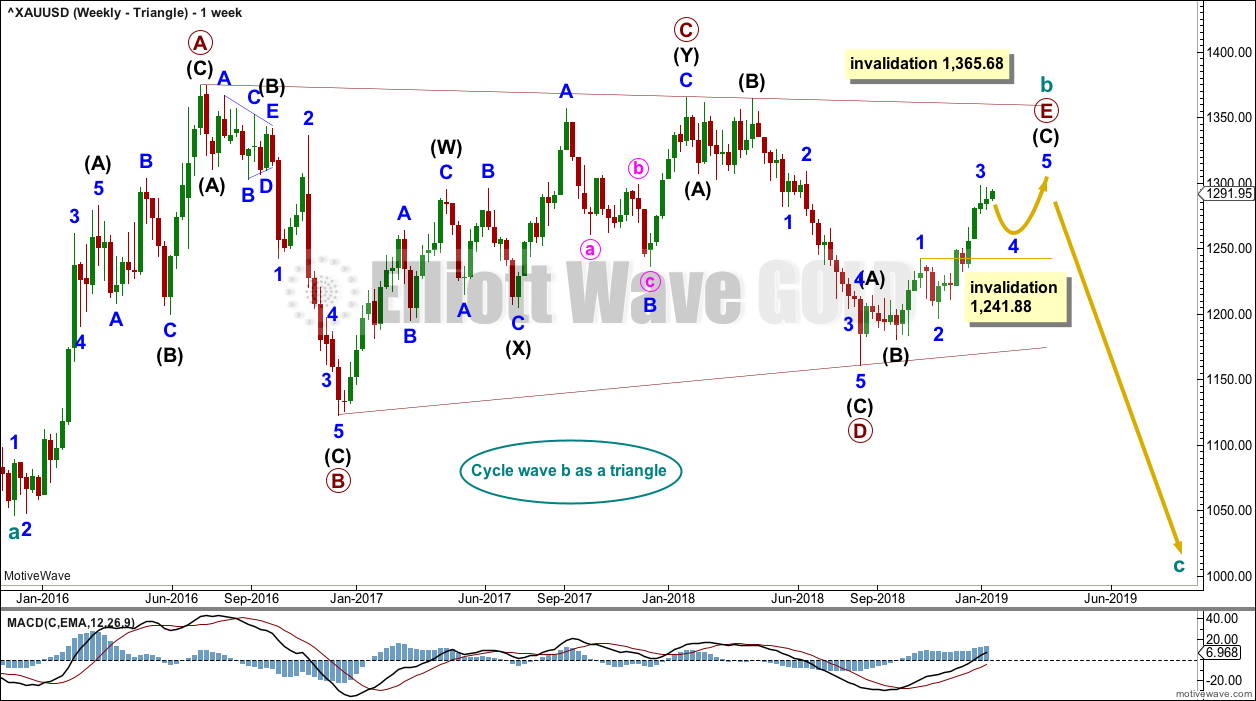
Cycle wave b may be an incomplete regular contracting triangle. Primary wave E may not move beyond the end of primary wave C above 1,365.68.
Within primary wave E, intermediate waves (A) and (B) may be complete. Intermediate wave (C) must subdivide as a five wave structure. Within intermediate wave (C), minor wave 4 may not move into minor wave 1 price territory below 1,241.88.
Four of the five sub-waves of a triangle must be zigzags, with only one sub-wave allowed to be a multiple zigzag. Wave C is the most common sub-wave to subdivide as a multiple, and this is how primary wave C for this example fits best. Primary wave E looks like it is unfolding as a single zigzag.
There are no problems in terms of subdivisions or rare structures for this wave count. It has an excellent fit and so far a typical look.
When primary wave E is a complete three wave structure, then this wave count would expect a cycle degree trend change. Cycle wave c would most likely make new lows below the end of cycle wave a at 1,046.27 to avoid a truncation.
It is possible now that primary wave E may end in January or February 2019. Some reasonable weakness should be expected at its end. Triangles often end with declining ATR, weak momentum and weak volume.
DAILY CHART – TRIANGLE
Click chart to enlarge.
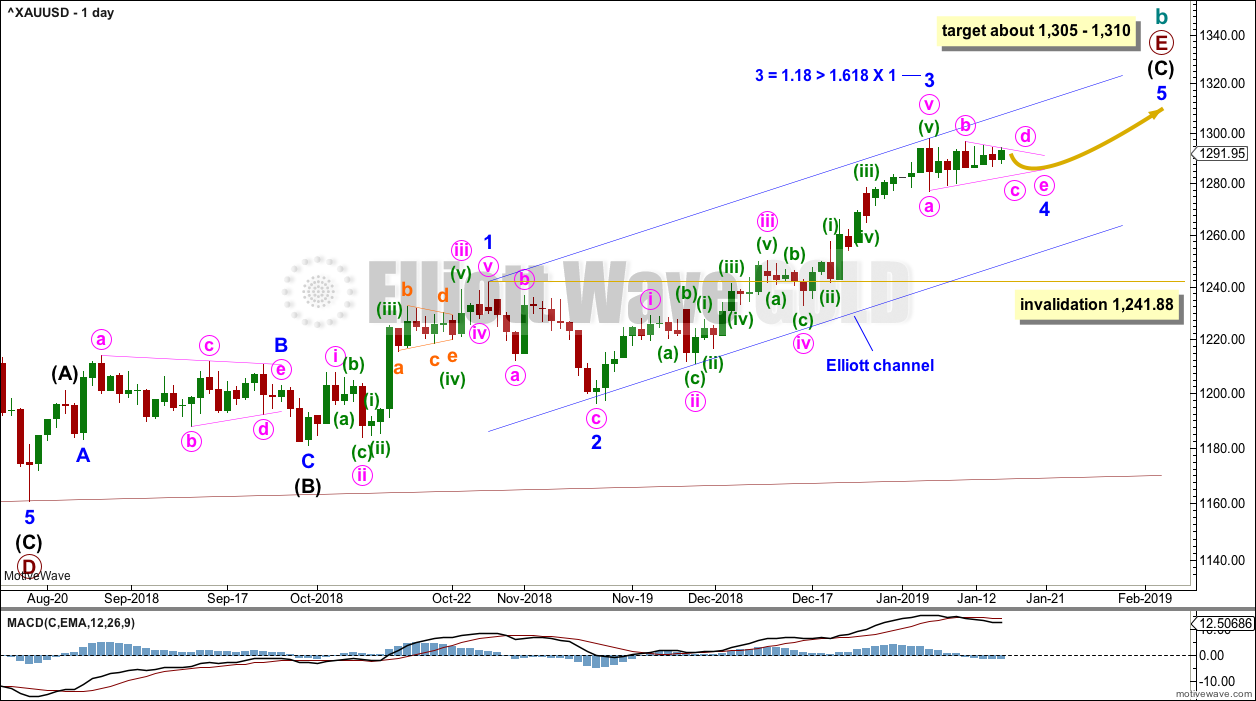
Primary wave E may now be nearing its final stages for this wave count.
Primary wave E should subdivide as a zigzag. Intermediate waves (A) and (B) may now be complete. Intermediate wave (C) may now be nearing completion.
Minor wave 2 is a deep 0.75 zigzag. Minor wave 4 may be expected to most likely be a shallow sideways flat, triangle or combination.
Minor wave 3 exhibits the most common Fibonacci ratio to minor wave 1.
Minor wave 4 may not move into minor wave 1 price territory below 1,241.88.
A target for primary wave E is the strong zone of resistance about 1,305 to 1,310. Primary wave E may not move beyond the end of primary wave C above 1,365.68.
When minor wave 4 may be complete, then the target may be calculated at minor degree.
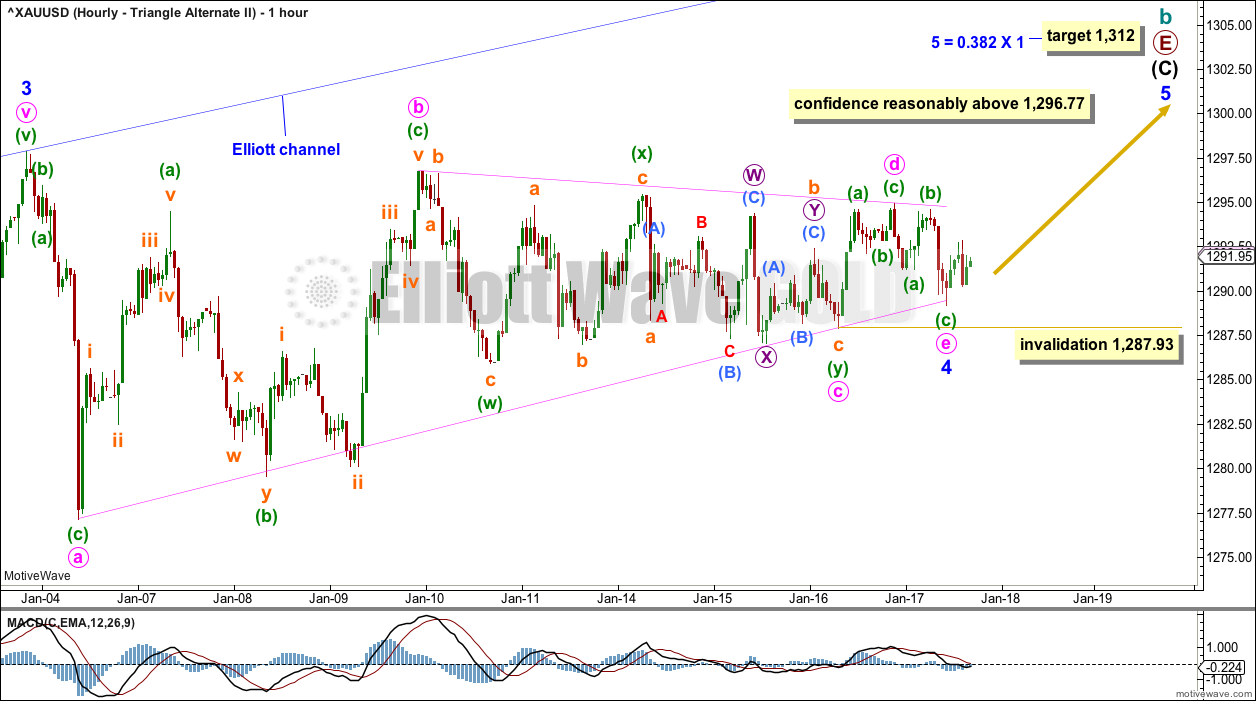
HOURLY CHART
Click chart to enlarge.
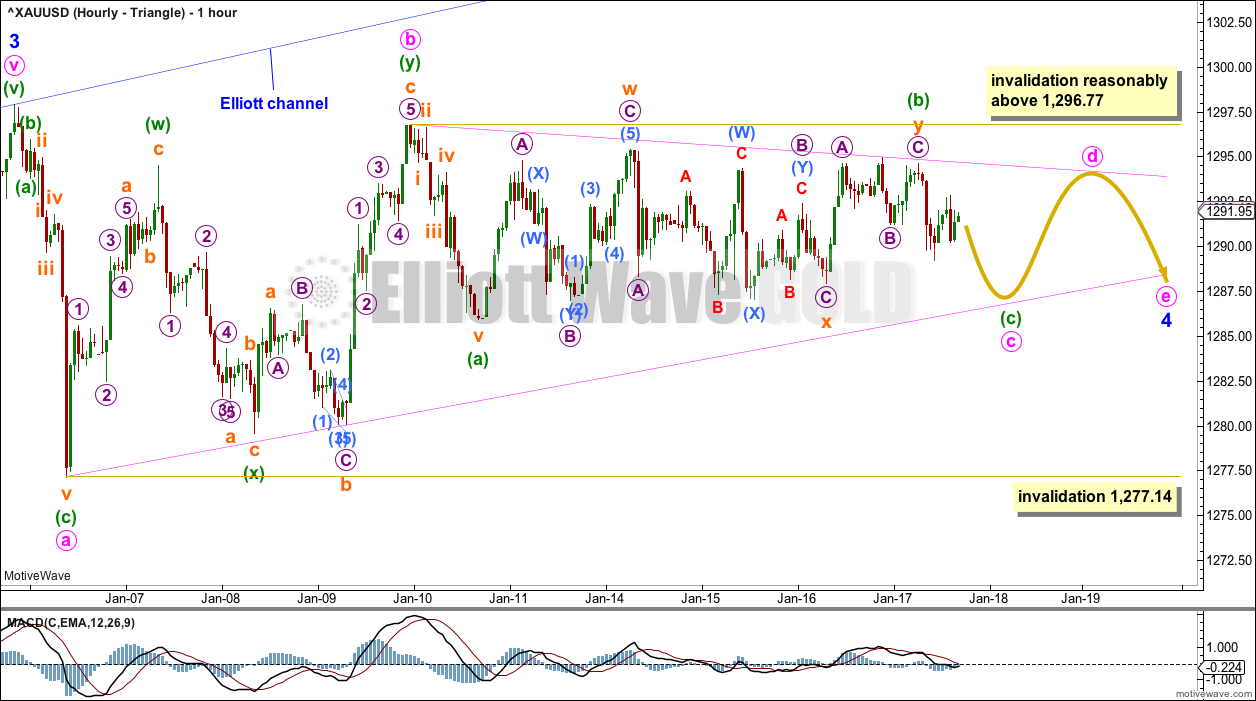
It will be essential at this time to be flexible because there are several possible structures for minor wave 4, so the labelling within it will change as it unfolds; alternate wave counts may be required. The focus should not be on identifying each small swing within minor wave 4. The focus should be on identifying when its structure may be complete and then the trend may resume.
This first hourly chart considers an incomplete triangle for minor wave 4. The triangle may be either a regular contracting triangle, which is the most common type, or a regular barrier triangle. My research shows that barrier triangles are more often running than regular.
Minute wave c may not move beyond the end of minute wave a below 1,277.14.
For a contracting triangle, minute wave d may not move beyond the end of minute wave b above 1,296.77.
For a barrier triangle, minute wave d may end about the same level as minute wave b, and in practice may move very slightly above minute wave b at 1,296.77. A triangle would remain valid as long as the b-d trend line remains essentially flat.
The final sub-wave of minute wave e may not move beyond the end of minute wave c.
A triangle may still take another few sessions to complete.
If a triangle is invalidated with a new high reasonably above 1,296.77, then use the second alternate hourly count below. If the triangle is invalidated with a new low below 1,277.14, then use the first alternate hourly wave count below.
The triangle trend lines are drawn as they may sit when the triangle is complete. Elliott wave triangles often test their trend lines within the triangle subwaves. The upper b-d trend line may now have two tests within minute wave c, and the lower a-c trend line may now have two tests within minute wave b.
Look for price to continue now to find resistance and support at these trend lines. When the structure may be complete, then a breakout above the b-d trend line would be expected. It may be swift.
HOURLY CHART FIRST ALTERNATE
Click chart to enlarge.
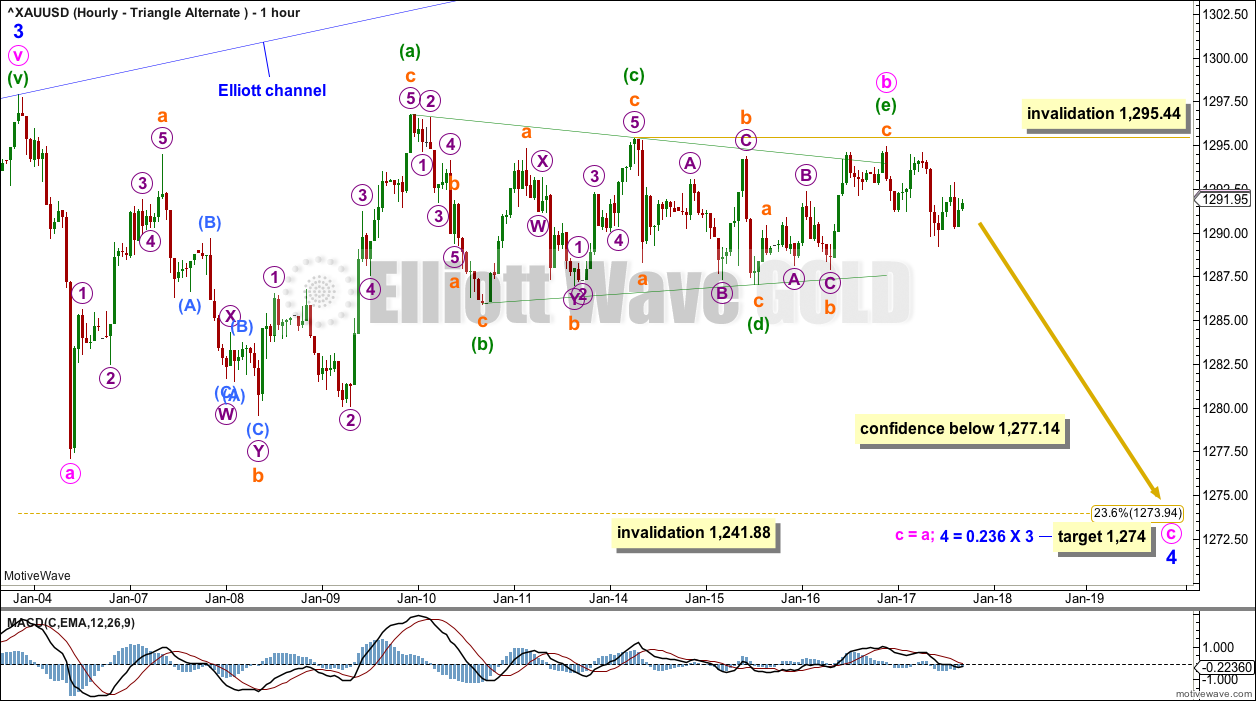
A possible zigzag is also considered for minor wave 4.
Within the zigzag, minute wave b may be a complete regular contracting triangle. If minuette wave (e) continues any higher, it may not move beyond the end of minuette wave (c) above 1,295.44.
Today this wave count has a problem with the structure of minuette wave (e). This should be a zigzag, and within it subminuette wave c should be a five wave structure. Subminuette wave c looks very strongly like a three wave structure. The probability of this wave count today is reduced.
If the triangle is a B wave within a zigzag, then the breakout would be expected to be downwards.
The downwards breakout for this alternate wave count would be expected to be false and brief. As soon as minute wave c has moved below the end of minute wave a at 1,277.14, it would then avoid a truncation. This wave count would then expect a quick reversal.
A target for minor wave 4 is calculated at two degrees.
HOURLY CHART SECOND ALTERNATE
Click chart to enlarge.
It is possible now that a triangle could be complete for minor wave 4.
However, when Elliott wave triangles complete the following movement out of them is almost always swift. At this stage, there is no swift upwards movement; price is not yet behaving normally following the completion of a triangle. For this reason, this wave count today is judged to have a low probability.
A new high reasonably above 1,296.77 is required for confidence in this wave count.
A target is calculated that expects minor wave 5 to be brief; this is normal behaviour for fifth waves following fourth wave triangles for Gold.
If minute wave e moves lower, it may not move beyond the end of minute wave c below 1,287.93.
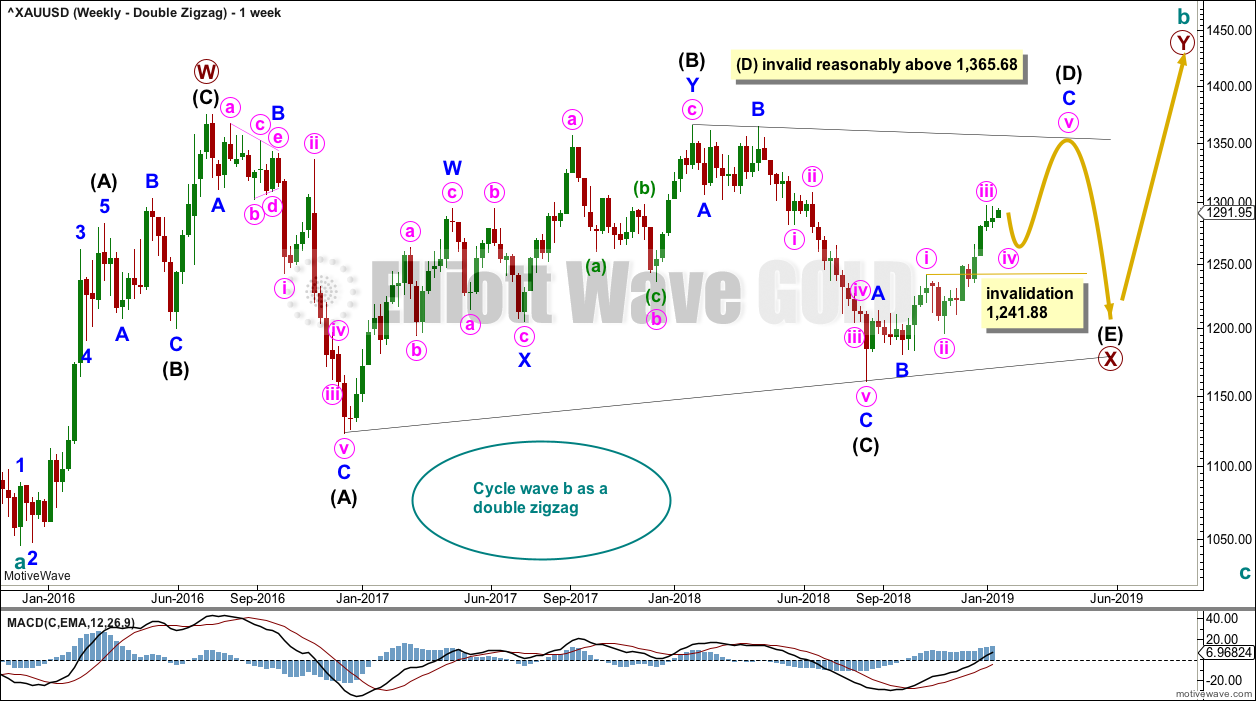
WEEKLY CHART – DOUBLE ZIGZAG
Click chart to enlarge.
It is possible that cycle wave b may be a double zigzag or a double combination.
The first zigzag in the double is labelled primary wave W. This has a good fit.
The double may be joined by a corrective structure in the opposite direction, a triangle labelled primary wave X. The triangle would be about three quarters complete.
Within the triangle of primary wave X, intermediate wave (C) should be complete. Within intermediate wave (D), minor waves A and B may be complete. Minor wave C must subdivide as a five wave structure. Within minor wave C, minute wave iv may not move into minute wave i price territory below 1,241.88.
Intermediate wave (D) would most likely subdivide as a single zigzag.
This wave count may now expect choppy overlapping movement in an ever decreasing range for a few more months.
Primary wave Y would most likely be a zigzag because primary wave X would be shallow; double zigzags normally have relatively shallow X waves.
Primary wave Y may also be a flat correction if cycle wave b is a double combination, but combinations normally have deep X waves. This would be less likely.
This wave count has good proportions and no problems in terms of subdivisions.
TECHNICAL ANALYSIS
WEEKLY CHART
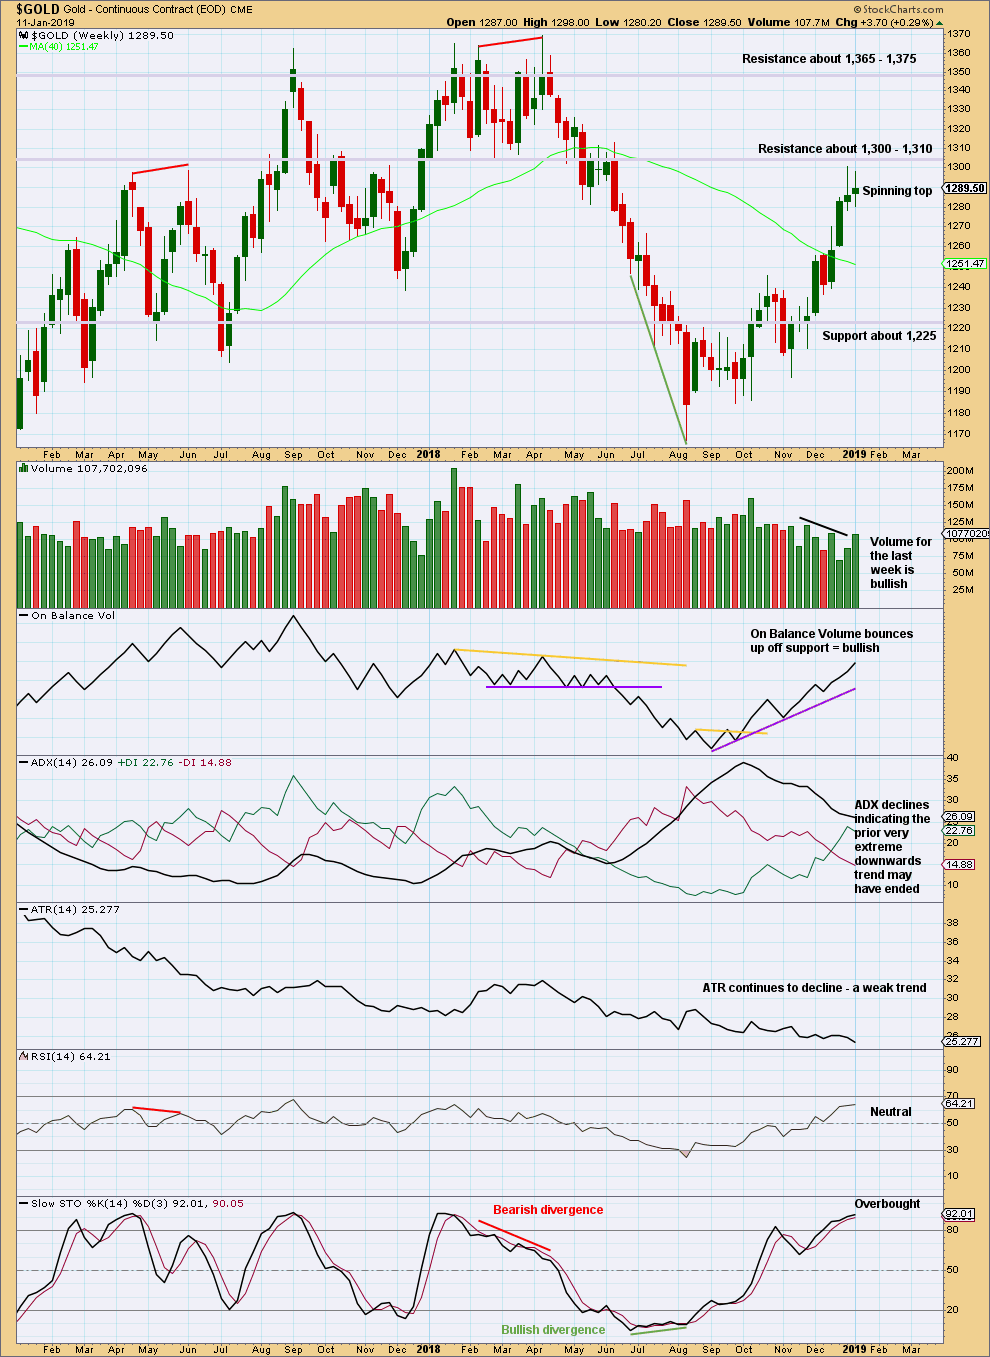
Click chart to enlarge. Chart courtesy of StockCharts.com.
The spinning top candlestick pattern is not a reversal pattern. This puts the short-term trend from up to neutral.
Volume for the last two weeks supports upwards movement. ADX indicates a potential trend change to upwards, but as yet it does not indicate a new trend at this time frame.
DAILY CHART
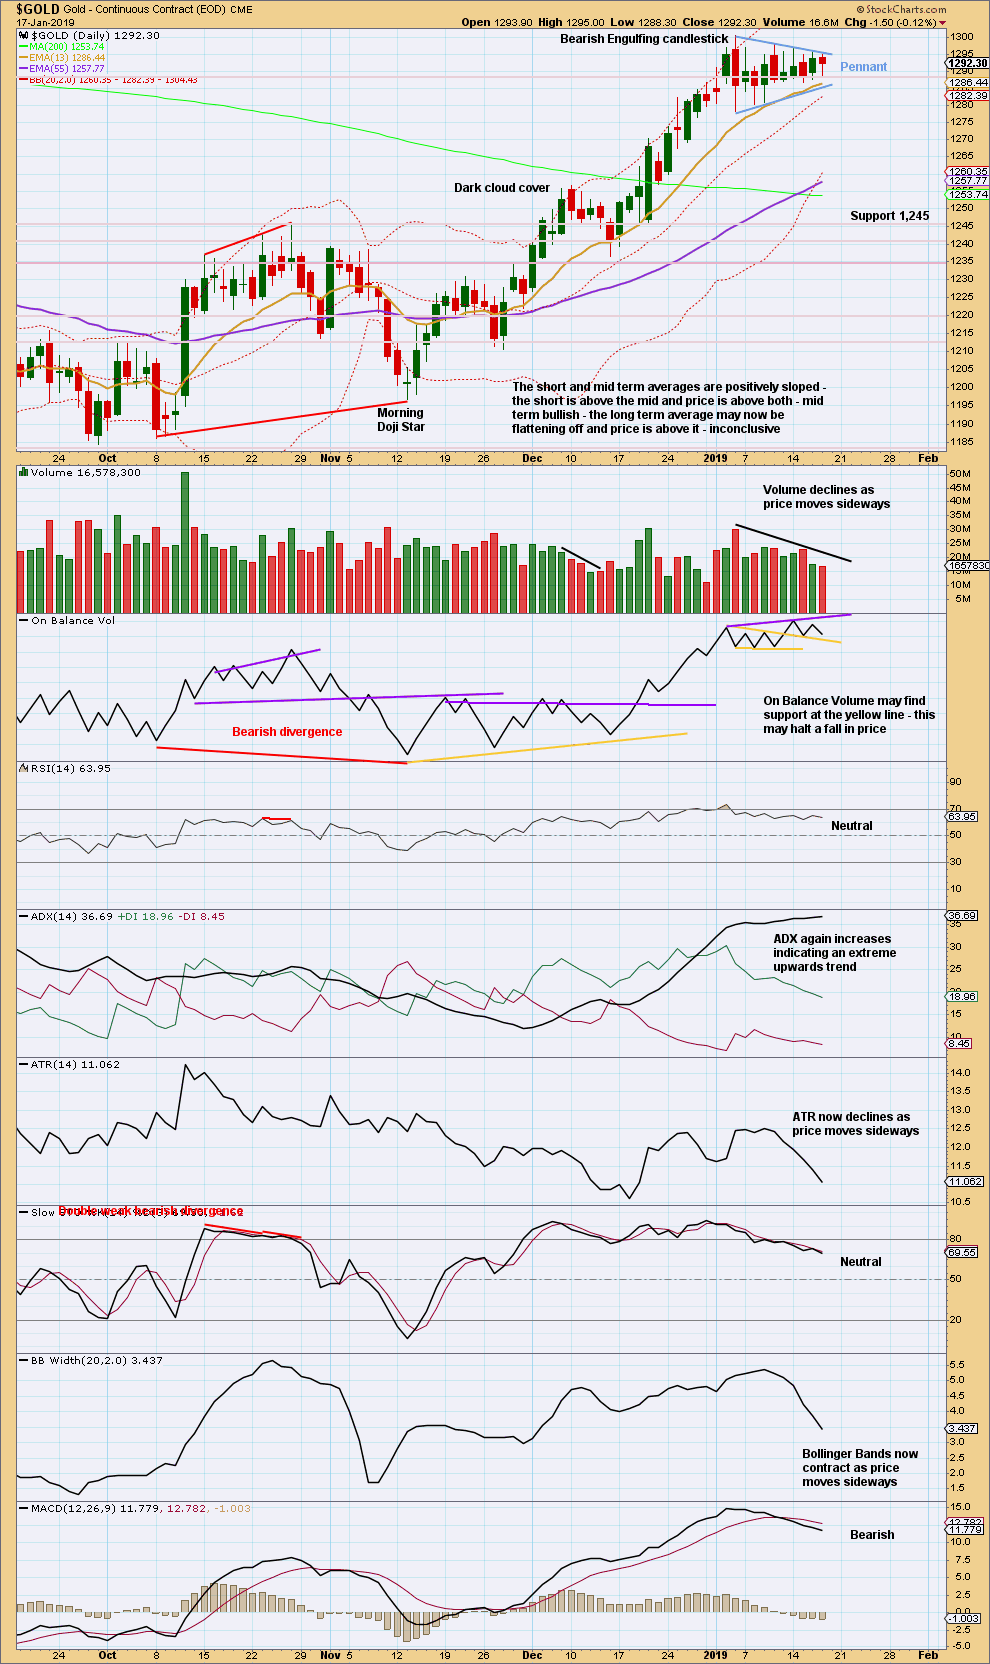
Click chart to enlarge. Chart courtesy of StockCharts.com.
A small pennant pattern may be forming. These are reliable continuation patterns. The target using the flag pole beginning at 1,236.50 on the 14th of December 2018 would be about 1,360. This is substantially higher than the Elliott wave count suggests; this target may be too optimistic.
The best pennant and flag patterns last up to 15 sessions. So far this one has lasted 10 sessions. If this is a pennant pattern, then it would most likely end soon.
GDX WEEKLY CHART
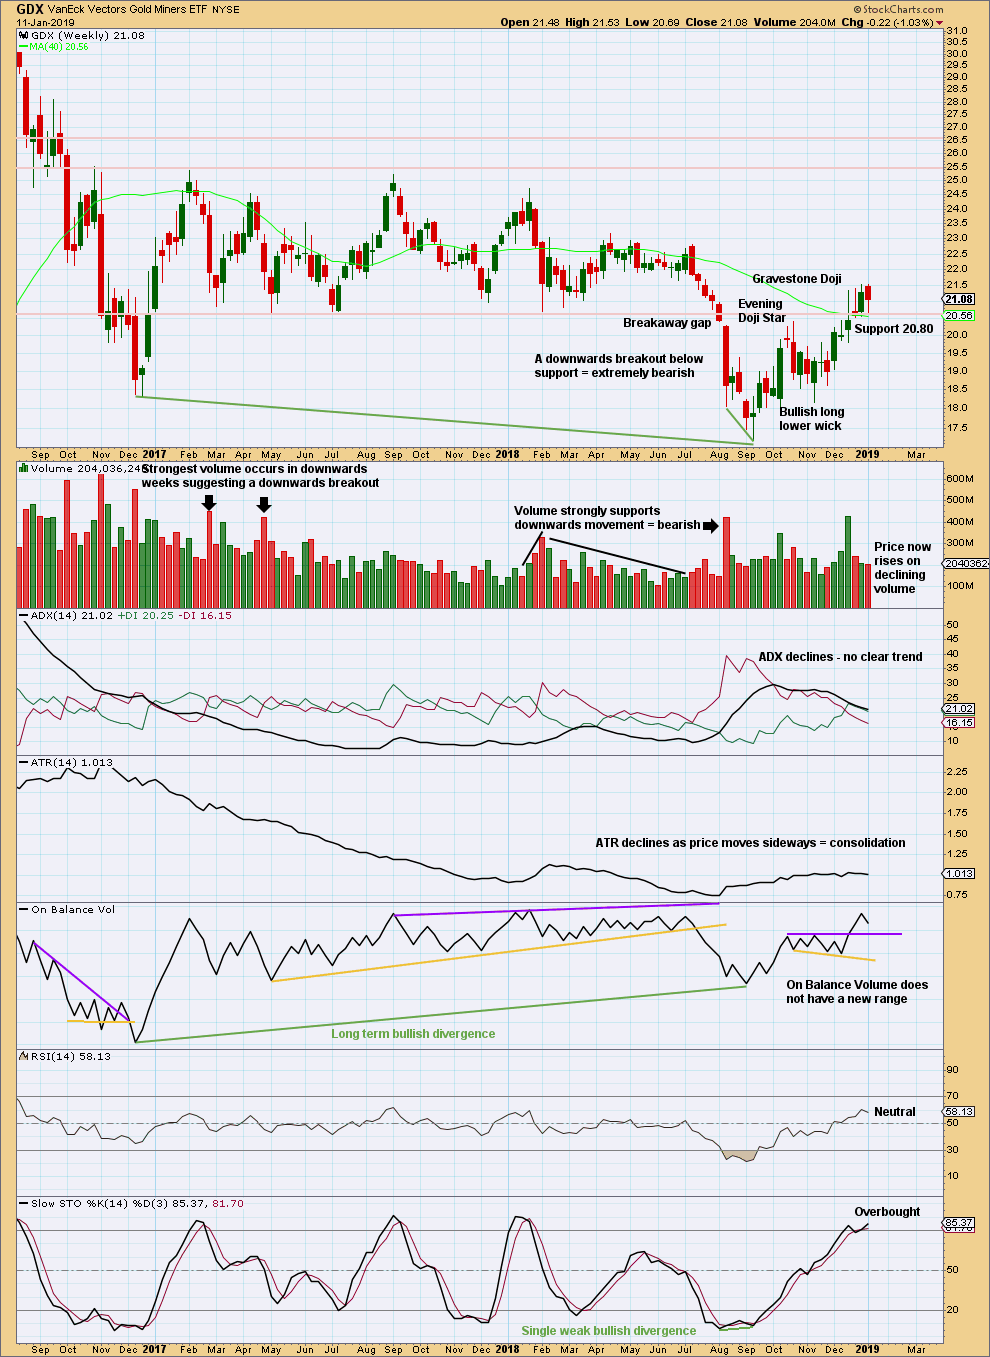
Click chart to enlarge. Chart courtesy of StockCharts.com.
GDX is now firmly back within a prior consolidation zone. Strong support may be expected again about 20.80.
GDX DAILY CHART
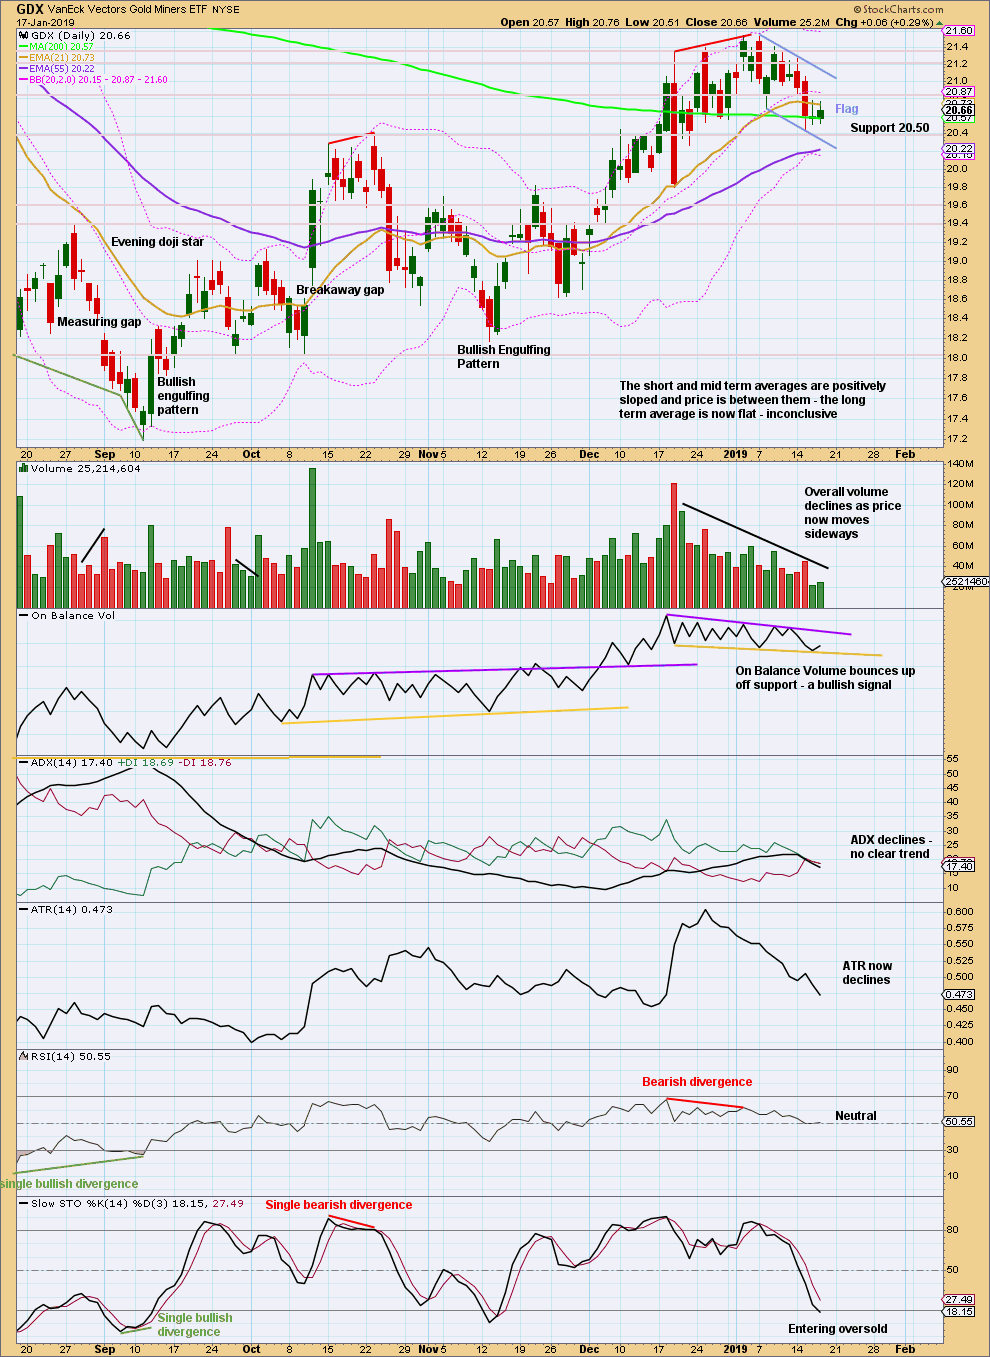
Click chart to enlarge. Chart courtesy of StockCharts.com.
A small flag pattern may be unfolding. The target using the flag pole beginning at 19.80 on the 19th of December 2018 is about 22.93.
Published @ 06:42 p.m. EST.
—
Careful risk management protects your trading account(s).
Follow my two Golden Rules:
1. Always trade with stops.
2. Risk only 1-5% of equity on any one trade.
Both hourly wave counts remain valid, and the triangle still looks the best. The lower a-c trend line is now more gently sloped, and that’s okay. This still looks like a normal Elliott wave triangle.