
Upwards movement was expected. A higher high and a higher low fits the overall expectation.
Summary: The first target for upwards movement to end is now at 1,300, which may be met within a very few days. If price keeps rising through the first target, then the next target at 1,314 may be used, and after that at 1,338.
Thereafter, a huge trend change is expected: a new wave down to last years would be expected to make new lows below 1,046.27.
New updates to this analysis are in bold.
Grand SuperCycle analysis is here.
Last historic analysis with monthly charts is here.
Only two remaining wave counts have a reasonable probability and are published below: a triangle (the preferred wave count) and a double zigzag.
MAIN ELLIOTT WAVE COUNT
WEEKLY CHART – TRIANGLE
Click chart to enlarge.
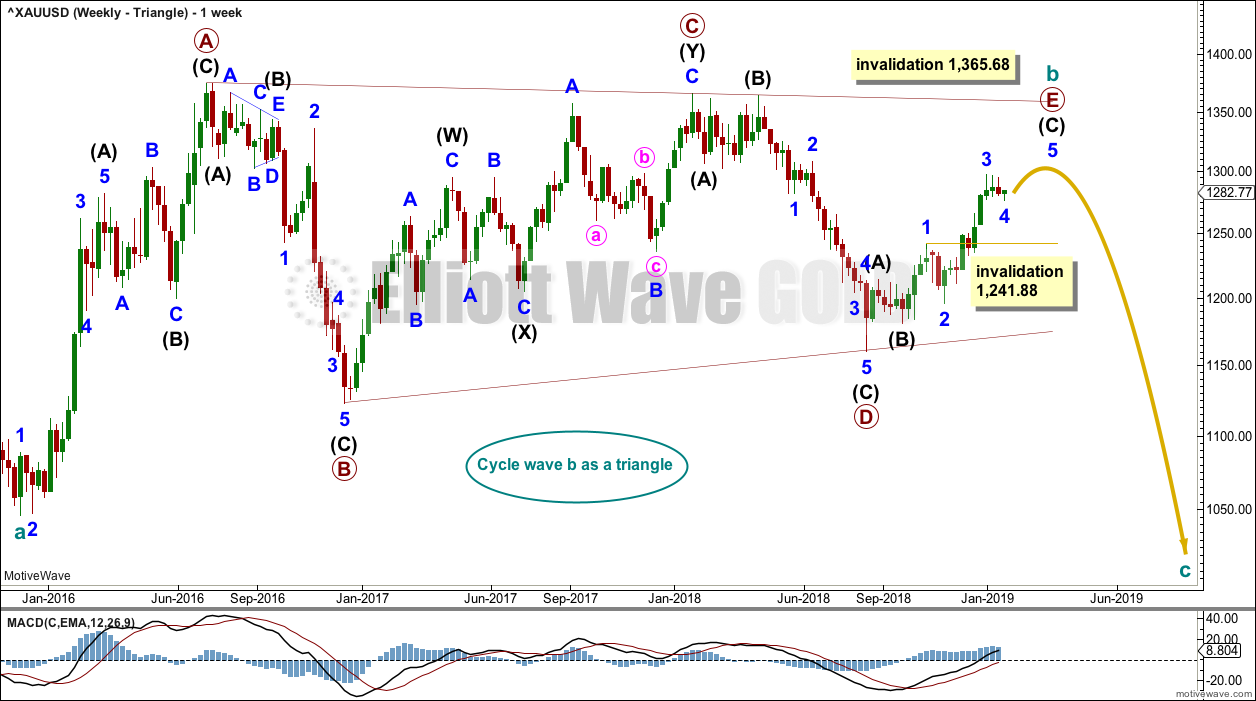
Cycle wave b may be an almost complete regular contracting triangle. Primary wave E may not move beyond the end of primary wave C above 1,365.68.
Within primary wave E, intermediate waves (A) and (B) may be complete. Intermediate wave (C) must subdivide as a five wave structure. Within intermediate wave (C), minor wave 4 may not move into minor wave 1 price territory below 1,241.88.
Four of the five sub-waves of a triangle must be zigzags, with only one sub-wave allowed to be a multiple zigzag. Wave C is the most common sub-wave to subdivide as a multiple, and this is how primary wave C for this example fits best. Primary wave E looks like it is unfolding as a single zigzag.
There are no problems in terms of subdivisions or rare structures for this wave count. It has an excellent fit and so far a typical look.
When primary wave E is a complete three wave structure, then this wave count would expect a cycle degree trend change. Cycle wave c would most likely make new lows below the end of cycle wave a at 1,046.27 to avoid a truncation.
It is possible now that primary wave E may end in January or February 2019. Some reasonable weakness should be expected at its end. Triangles often end with declining ATR, weak momentum and weak volume.
DAILY CHART – TRIANGLE
Click chart to enlarge.
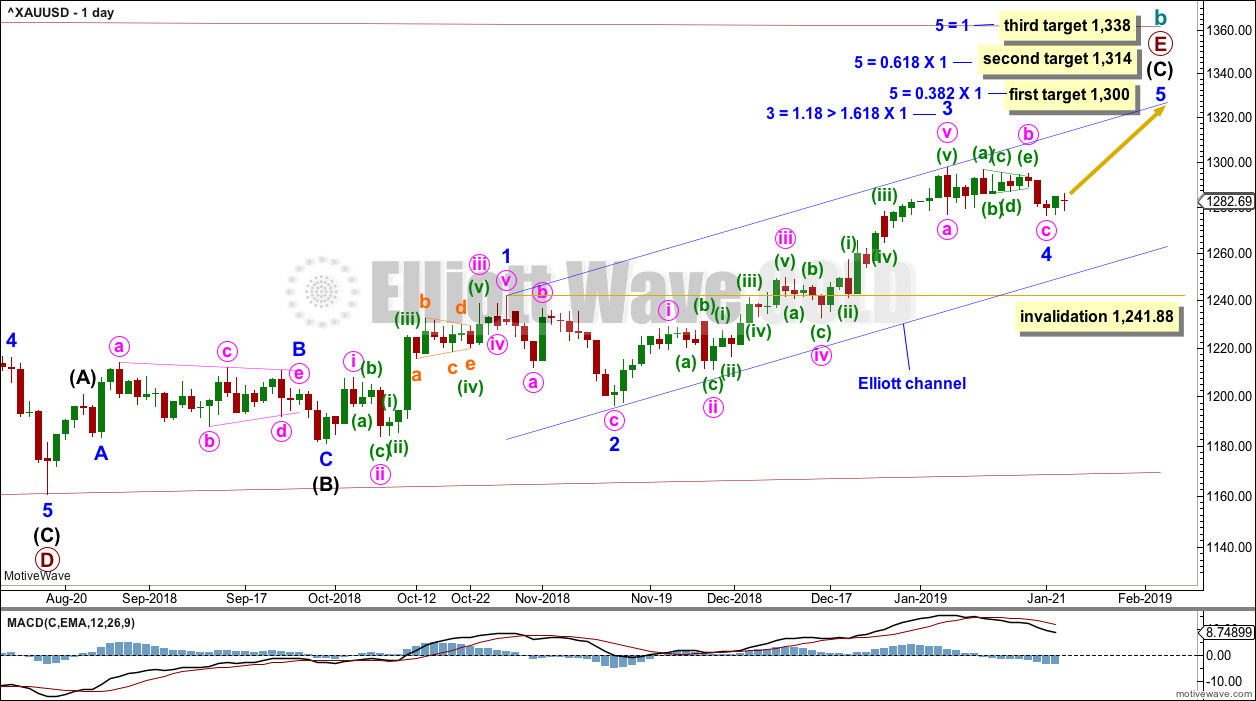
Primary wave E may now be nearing its final stages for this wave count.
Primary wave E should subdivide as a zigzag. Intermediate waves (A) and (B) may now be complete. Intermediate wave (C) may now be nearing completion.
Minor wave 2 is a deep 0.75 zigzag. Minor wave 4 may now be a complete a zigzag. Alternation is a guideline, not a rule, and is not always seen. Zigzags are the most common corrective structure. There is still alternation in depth: minor wave 2 was deep and so far minor wave 4 remains very shallow.
Minor wave 3 exhibits the most common Fibonacci ratio to minor wave 1.
If it continues further, then minor wave 4 may not move into minor wave 1 price territory below 1,241.88.
Three targets are now calculated for minor wave 5 to end. If price reaches the first target and the structure is incomplete or price just keeps on rising through it, then the second target may be used. Again, if price reaches the second target and the structure is incomplete or price just keeps rising, then the third final target may be used.
All three targets would expect primary wave E to fall short of the maroon A-C trend line. This is the most common look for E waves of Elliott wave triangles.
HOURLY CHART
Click chart to enlarge.
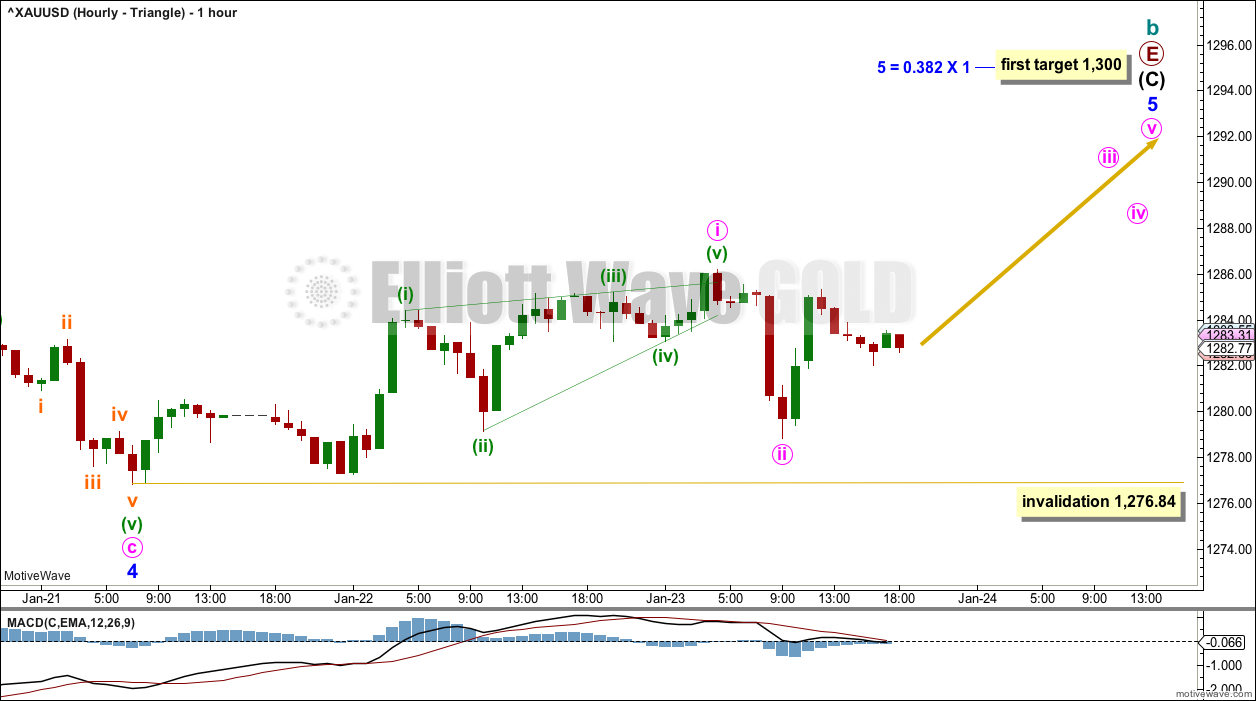
Minor wave 4 may now be complete at the last low.
Minor wave 5 must subdivide as a five wave motive structure, either an impulse or an ending diagonal. Impulses are much more common structures, so that shall be how it is labelled unless overlapping begins to suggest an ending diagonal.
Within minor wave 5, minute wave i may be a complete leading contracting diagonal.
Minute wave ii may not move beyond the start of minute wave i below 1,276.84.
WEEKLY CHART – DOUBLE ZIGZAG
Click chart to enlarge.
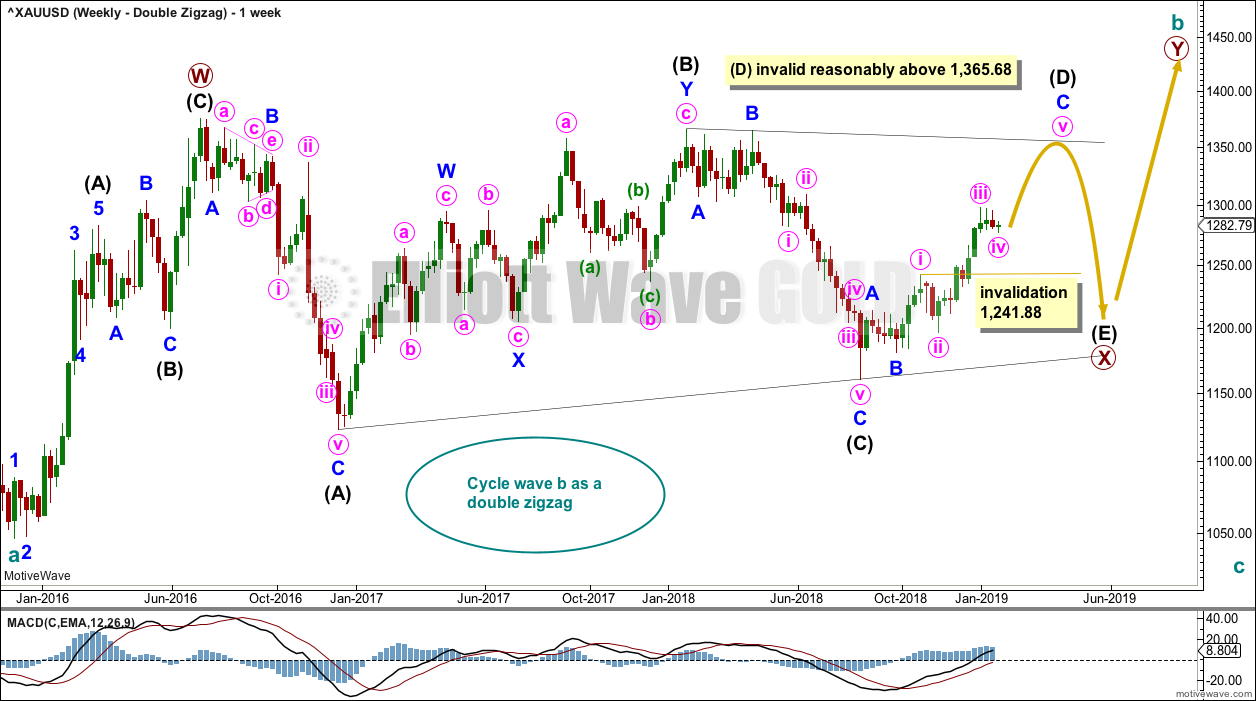
It is possible that cycle wave b may be a double zigzag or a double combination.
The first zigzag in the double is labelled primary wave W. This has a good fit.
The double may be joined by a corrective structure in the opposite direction, a triangle labelled primary wave X. The triangle would be about three quarters complete.
Within the triangle of primary wave X, intermediate wave (C) should be complete. Within intermediate wave (D), minor waves A and B may be complete. Minor wave C must subdivide as a five wave structure. Within minor wave C, minute wave iv may not move into minute wave i price territory below 1,241.88.
Intermediate wave (D) would most likely subdivide as a single zigzag.
This wave count may now expect choppy overlapping movement in an ever decreasing range for a few more months.
Primary wave Y would most likely be a zigzag because primary wave X would be shallow; double zigzags normally have relatively shallow X waves.
Primary wave Y may also be a flat correction if cycle wave b is a double combination, but combinations normally have deep X waves. This would be less likely.
This wave count has good proportions and no problems in terms of subdivisions.
TECHNICAL ANALYSIS
WEEKLY CHART
Click chart to enlarge. Chart courtesy of StockCharts.com.
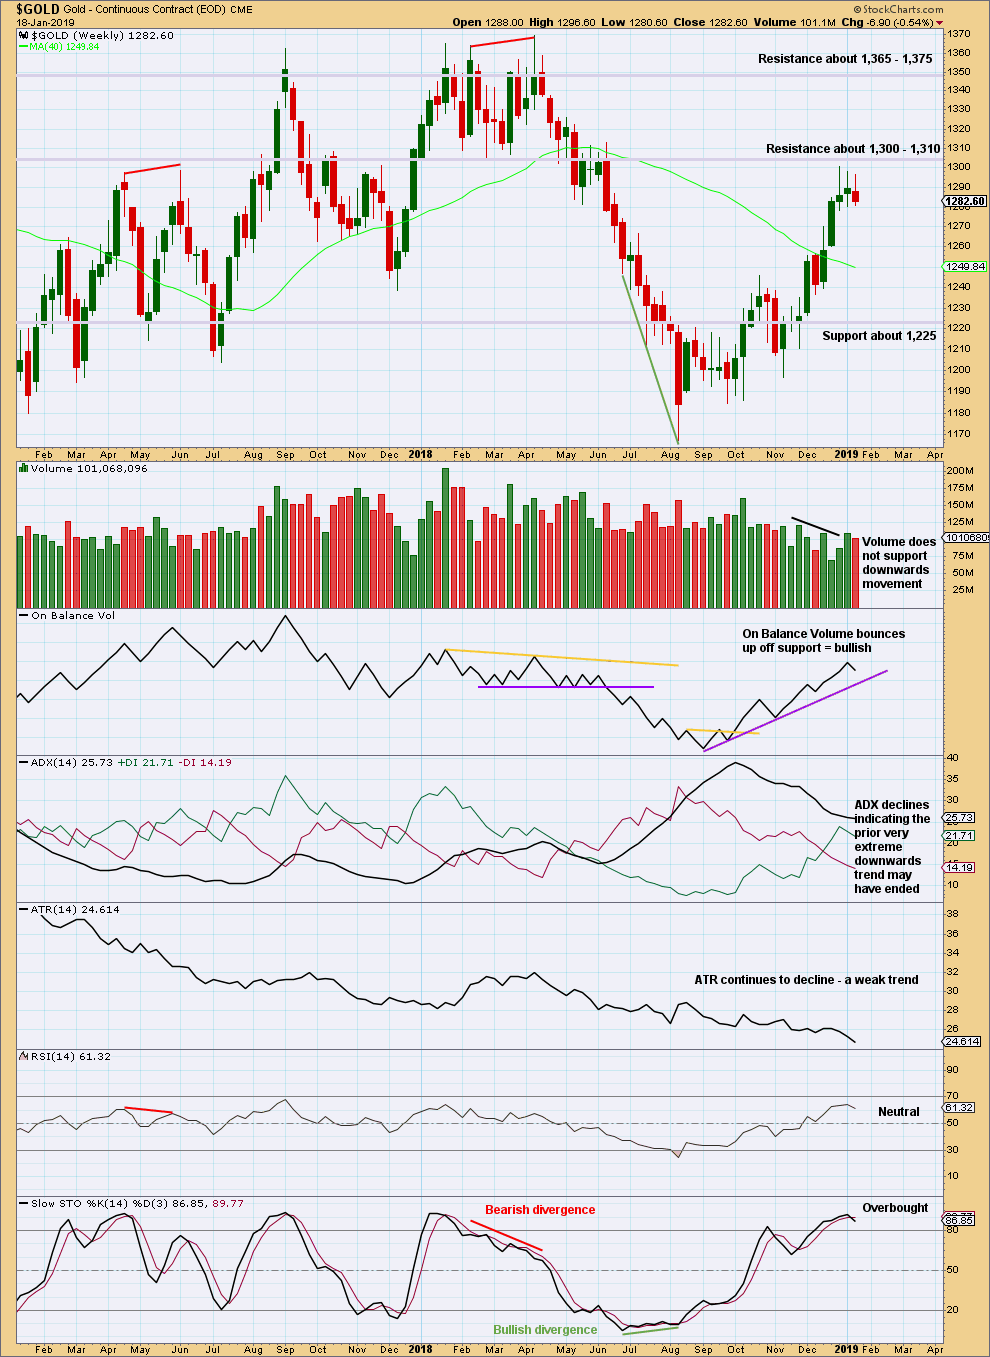
ADX indicates a potential trend change to upwards, but as yet it does not indicate a new trend at this time frame.
Last week completes an inside week with the balance of volume downwards and the candlestick closing red. Downwards movement within the week has some support from volume.
DAILY CHART
Click chart to enlarge. Chart courtesy of StockCharts.com.
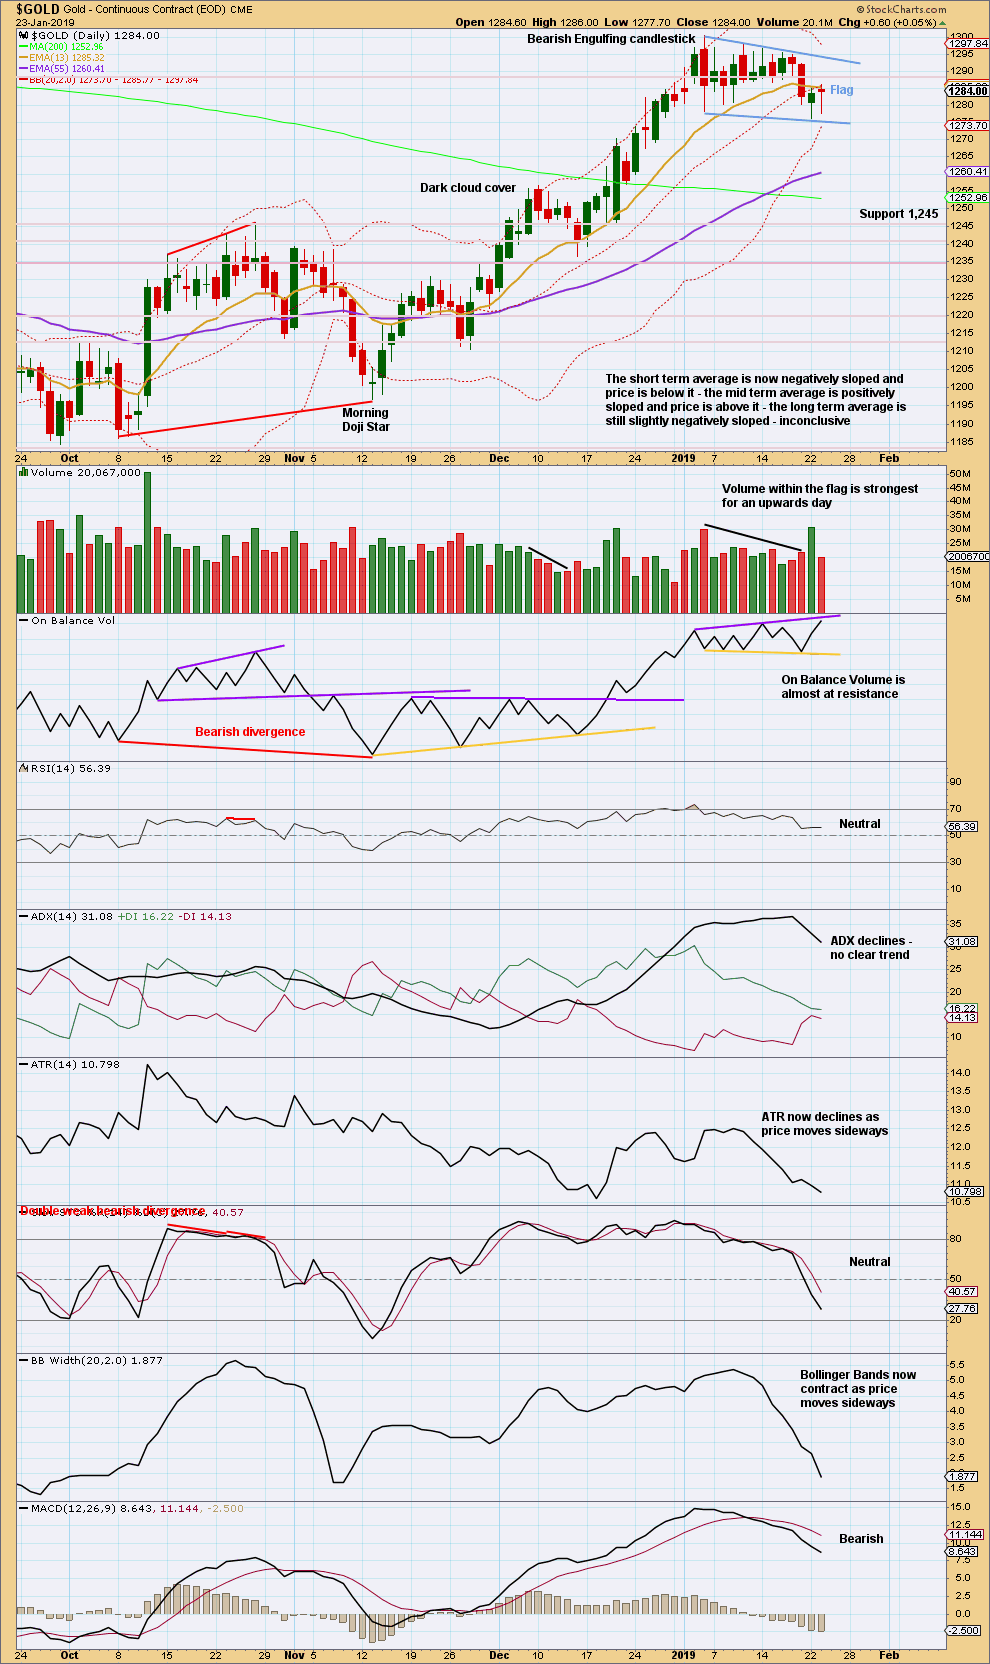
The pennant pattern may now have morphed into a flag pattern. The best flags and pennants complete within 15 days. This one has now lasted 13 days and looks normal.
Using the flag pole length, a target at 1,359 is calculated. This target looks rather optimistic.
GDX WEEKLY CHART
Click chart to enlarge. Chart courtesy of StockCharts.com.
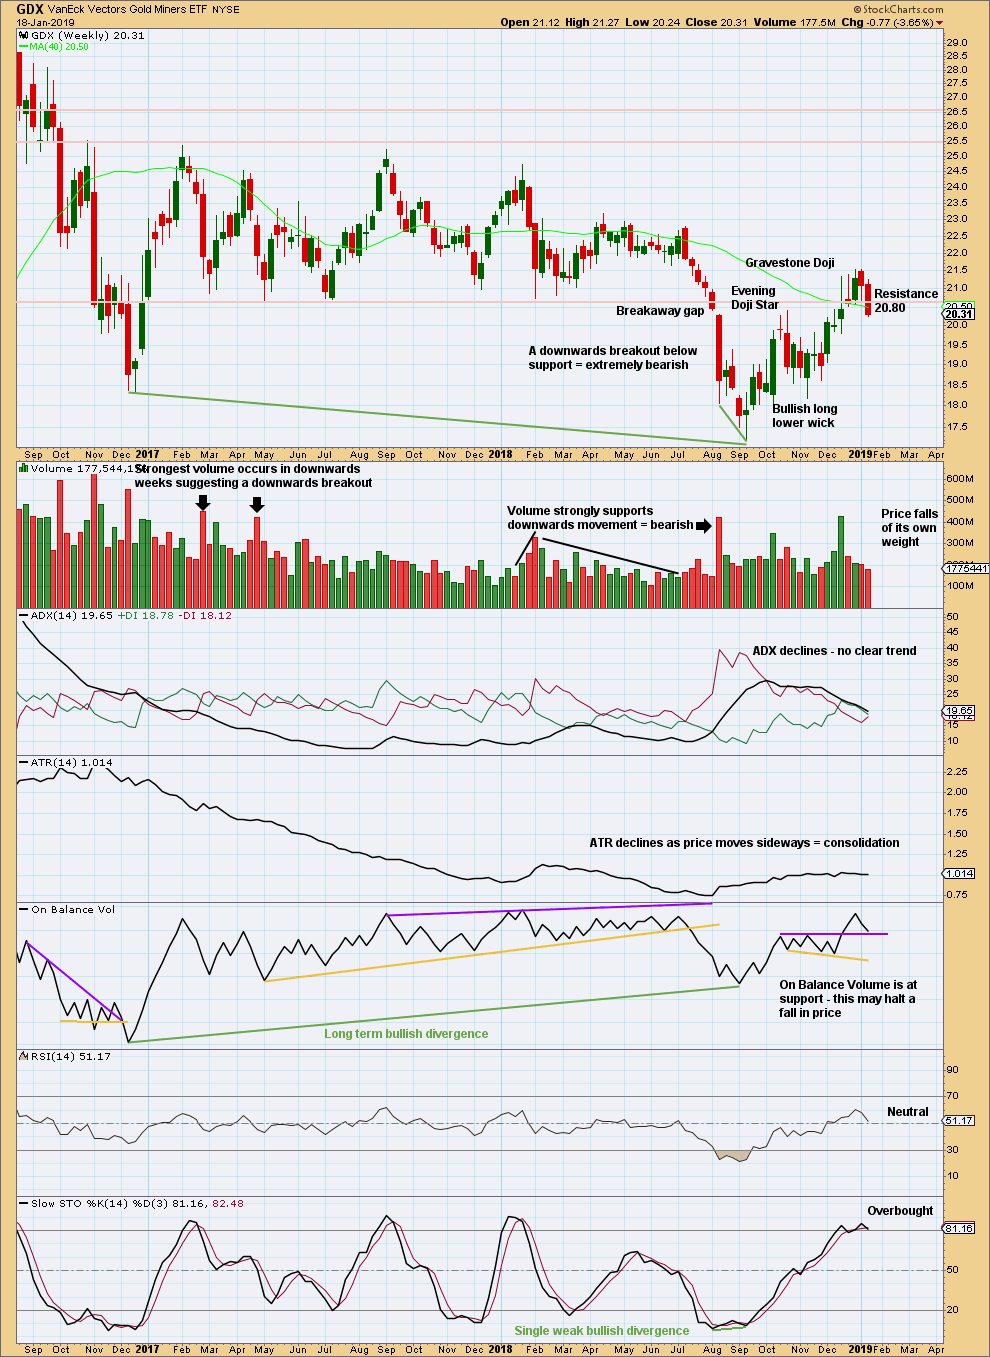
Another breakout below 20.80 is very bearish. GDX may be now ready for another strong fall in price.
GDX DAILY CHART
Click chart to enlarge. Chart courtesy of StockCharts.com.
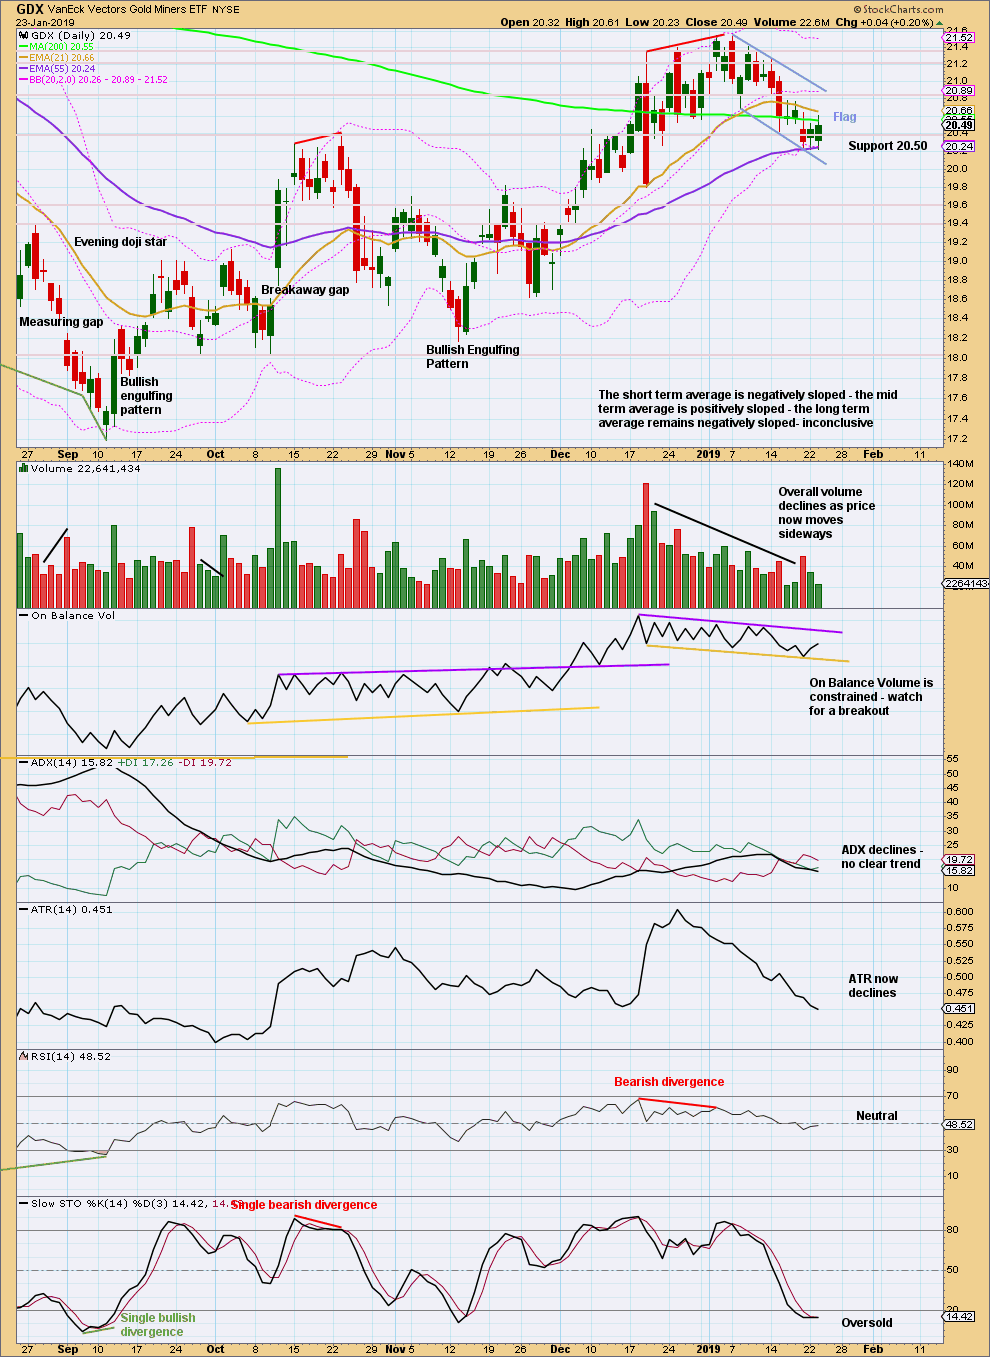
The flag pattern remains valid for GDX, which has lasted now 12 sessions. The best flags and pennants complete within 15 sessions.
Flags are continuation patterns. An upwards breakout would be expected. The target would be about 22.60.
Published @ 06:41 p.m. EST.
—
Careful risk management protects your trading account(s).
Follow my two Golden Rules:
1. Always trade with stops.
2. Risk only 1-5% of equity on any one trade.
Updated hourly chart:
Second wave corrections following first wave leading diagonals are typically very deep. This fits a common pattern.
Minute wave ii subdivides now nicely as a zigzag.
lara, could this new low 1278.45 be the actual end of minute ii?
or could triangle be valid?
1. Second wave corrections may not subdivide as triangles.
2. Within a triangle wave C may not move beyond the end of wave A.
So… no. A triangle here may not be valid.
Yes. And it subdivides neatly into 5-3-5, a zigzag.
i saw that, and thank you for your response.