
An upwards breakout from a flag pattern was expected. The first Elliott wave target at 1,300 has been met. But the Elliott wave structure is incomplete, so the second target will now be used.
Summary: For the short term, a little sideways movement may begin next week. Thereafter, a short final upwards wave may unfold.
The next target at 1,314 may be used. If price gets up to this next target and keeps on rising, or if it gets there and the Elliott wave structure is again incomplete, then the next target is at 1,338.
Thereafter, a huge trend change is expected: a new wave down to last years would be expected to make new lows below 1,046.27.
New updates to this analysis are in bold.
Grand SuperCycle analysis is here.
Last historic analysis with monthly charts is here.
Only two remaining wave counts have a reasonable probability and are published below: a triangle (the preferred wave count) and a double zigzag.
MAIN ELLIOTT WAVE COUNT
WEEKLY CHART – TRIANGLE
Click chart to enlarge.
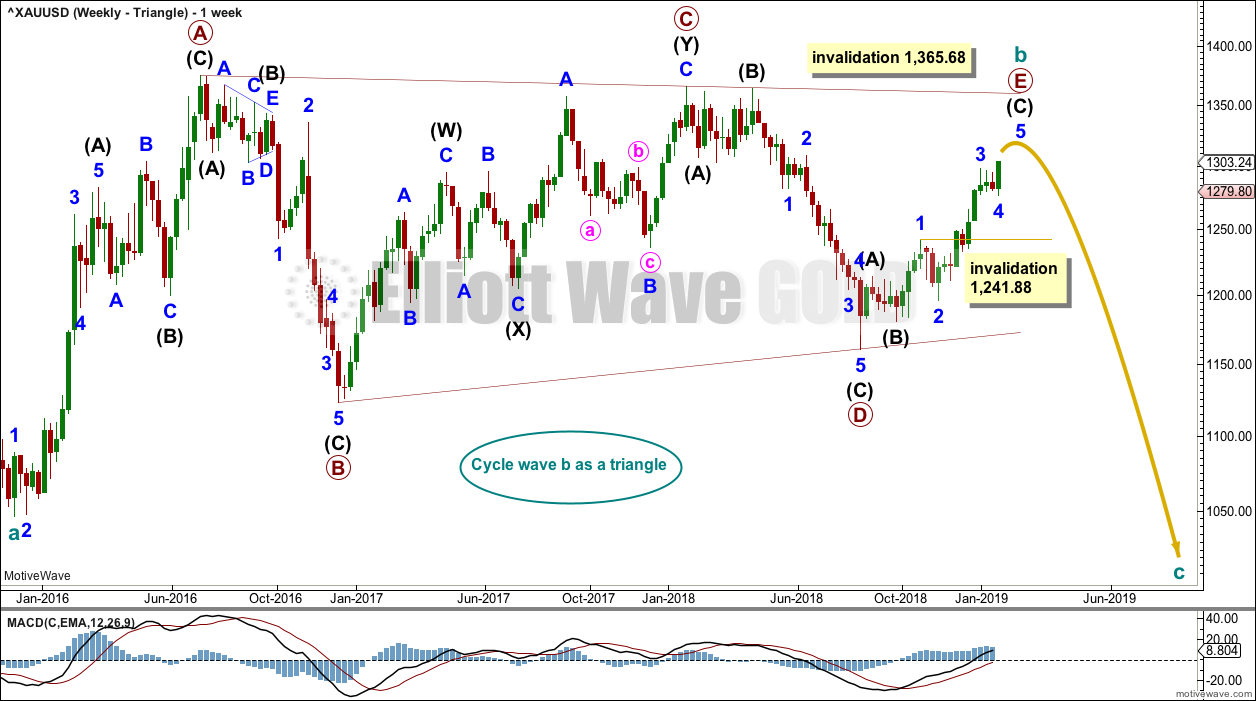
Cycle wave b may be an almost complete regular contracting triangle. Primary wave E may not move beyond the end of primary wave C above 1,365.68.
Within primary wave E, intermediate waves (A) and (B) may be complete. Intermediate wave (C) must subdivide as a five wave structure. Within intermediate wave (C), minor wave 4 may not move into minor wave 1 price territory below 1,241.88.
Four of the five sub-waves of a triangle must be zigzags, with only one sub-wave allowed to be a multiple zigzag. Wave C is the most common sub-wave to subdivide as a multiple, and this is how primary wave C for this example fits best. Primary wave E looks like it is unfolding as a single zigzag.
There are no problems in terms of subdivisions or rare structures for this wave count. It has an excellent fit and so far a typical look.
When primary wave E is a complete three wave structure, then this wave count would expect a cycle degree trend change. Cycle wave c would most likely make new lows below the end of cycle wave a at 1,046.27 to avoid a truncation.
It is possible now that primary wave E may end next week. Some reasonable weakness should be expected at its end. Triangles often end with declining ATR, weak momentum and weak volume.
DAILY CHART – TRIANGLE
Click chart to enlarge.
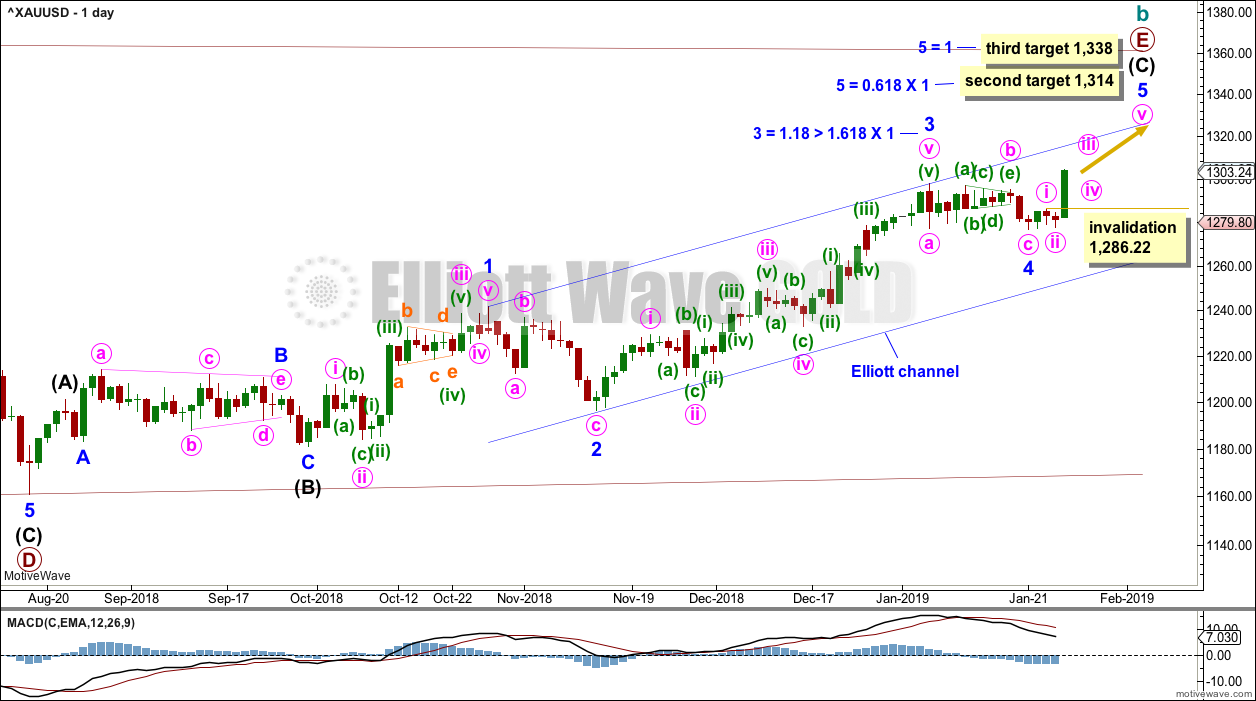
Primary wave E may now be almost complete for this wave count.
Primary wave E should subdivide as a zigzag. Intermediate waves (A) and (B) may now be complete. Intermediate wave (C) may now be almost complete.
Minor wave 2 is a deep 0.75 zigzag. Minor wave 4 may now be a complete a zigzag. Alternation is a guideline, not a rule, and is not always seen. Zigzags are the most common corrective structure. There is still alternation in depth: minor wave 2 was deep and minor wave 4 was very shallow.
Minor wave 3 exhibits the most common Fibonacci ratio to minor wave 1.
Within minor wave 5, minute wave iv may not move into minute wave i price territory below 1,286.22.
Two targets now remain for minor wave 5 to end. If price reaches the next target and the structure is incomplete or price just keeps on rising through it, then the third target may be used.
All targets would expect primary wave E to fall short of the maroon A-C trend line. This is the most common look for E waves of Elliott wave triangles.
HOURLY CHART
Click chart to enlarge.
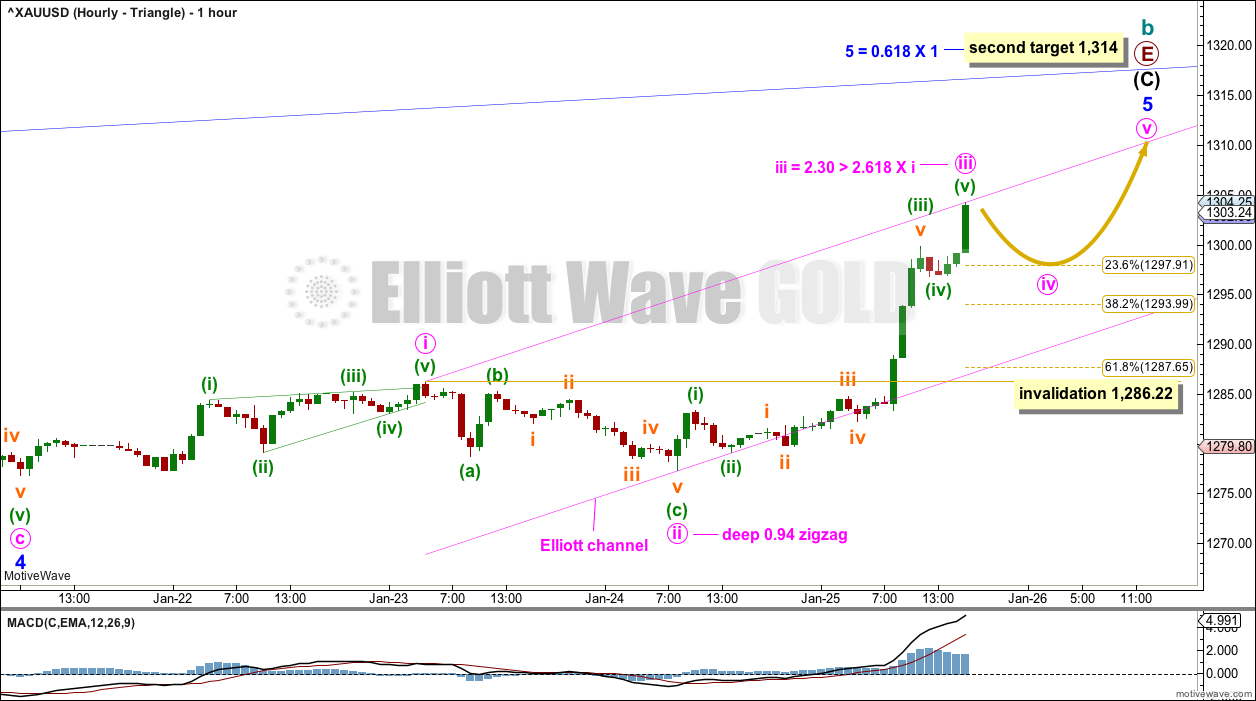
Minor wave 5 must subdivide as a five wave motive structure, either an impulse or an ending diagonal. Impulses are much more common structures, and that is how minor wave 5 is unfolding.
Within minor wave 5, minute wave i may be a complete leading contracting diagonal.
Minute wave ii subdivides as a zigzag. Zigzags are the most common corrective structure. Second wave corrections following first wave leading diagonals are most commonly very deep. This wave count follows a common pattern.
Minute wave iii may now be a complete impulse at Friday’s high. Minute wave iii exhibits a common Fibonacci ratio to minute wave i.
Minute wave iv may end within the fourth wave of one lesser degree price territory; minuette wave (iv) has its territory from 1,299.84 to 1,296.88. Within this territory is the 0.236 Fibonacci ratio of minute wave iii at 1,297.91. This is a reasonable target for minute wave iv.
Minute wave iv may be more brief than minute wave ii, which lasted 28 hours. Minute wave iv may be over within 24 hours; Gold often exhibits fourth waves that are quicker than their counterpart second waves.
Thereafter, a final wave upwards for minute wave v may be about equal in length with minute wave i at $9.38.
When the narrow pink Elliott channel is breached by downwards movement, that shall be the earliest indication that cycle wave b may be over.
A breach of the wider blue channel on the daily chart would be the next indication that cycle wave b may be over. Some reasonable confidence may be had at that stage that cycle wave c has begun, and a target may then be calculated for it.
WEEKLY CHART – DOUBLE ZIGZAG
Click chart to enlarge.
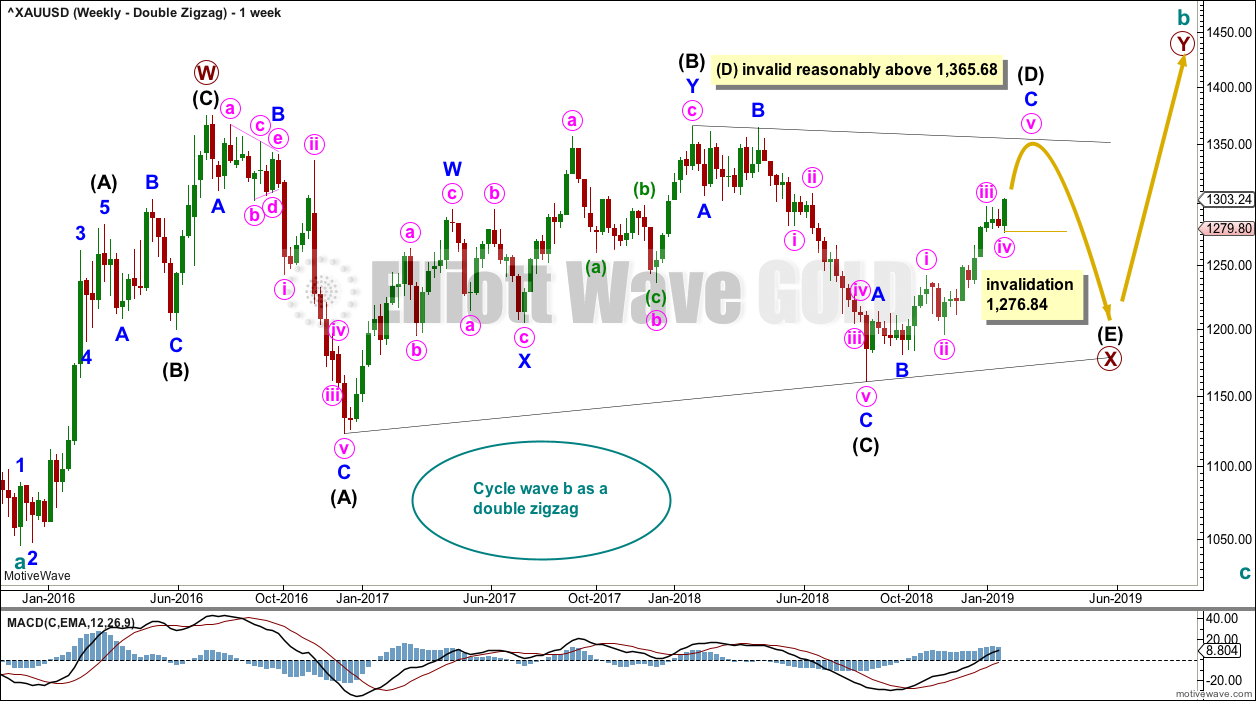
It is possible that cycle wave b may be a double zigzag or a double combination.
The first zigzag in the double is labelled primary wave W. This has a good fit.
The double may be joined by a corrective structure in the opposite direction, a triangle labelled primary wave X. The triangle would be about three quarters complete.
Within the triangle of primary wave X, intermediate wave (C) should be complete. Within intermediate wave (D), minor waves A and B may be complete. Minor wave C must subdivide as a five wave structure. Within minor wave C, minute wave iv should now be over. Within minute wave v, no second wave correction may move beyond its start below 1,276.84.
Intermediate wave (D) would most likely subdivide as a single zigzag. Intermediate wave (D) should end at the upper (B)-(D) trend line for this wave count, so that the triangle adheres neatly to this trend line. That price point is about 1,354.
This wave count may now expect choppy overlapping movement in an ever decreasing range for a few more months.
Primary wave Y would most likely be a zigzag because primary wave X would be shallow; double zigzags normally have relatively shallow X waves.
Primary wave Y may also be a flat correction if cycle wave b is a double combination, but combinations normally have deep X waves. This would be less likely.
This wave count has good proportions and no problems in terms of subdivisions.
TECHNICAL ANALYSIS
WEEKLY CHART
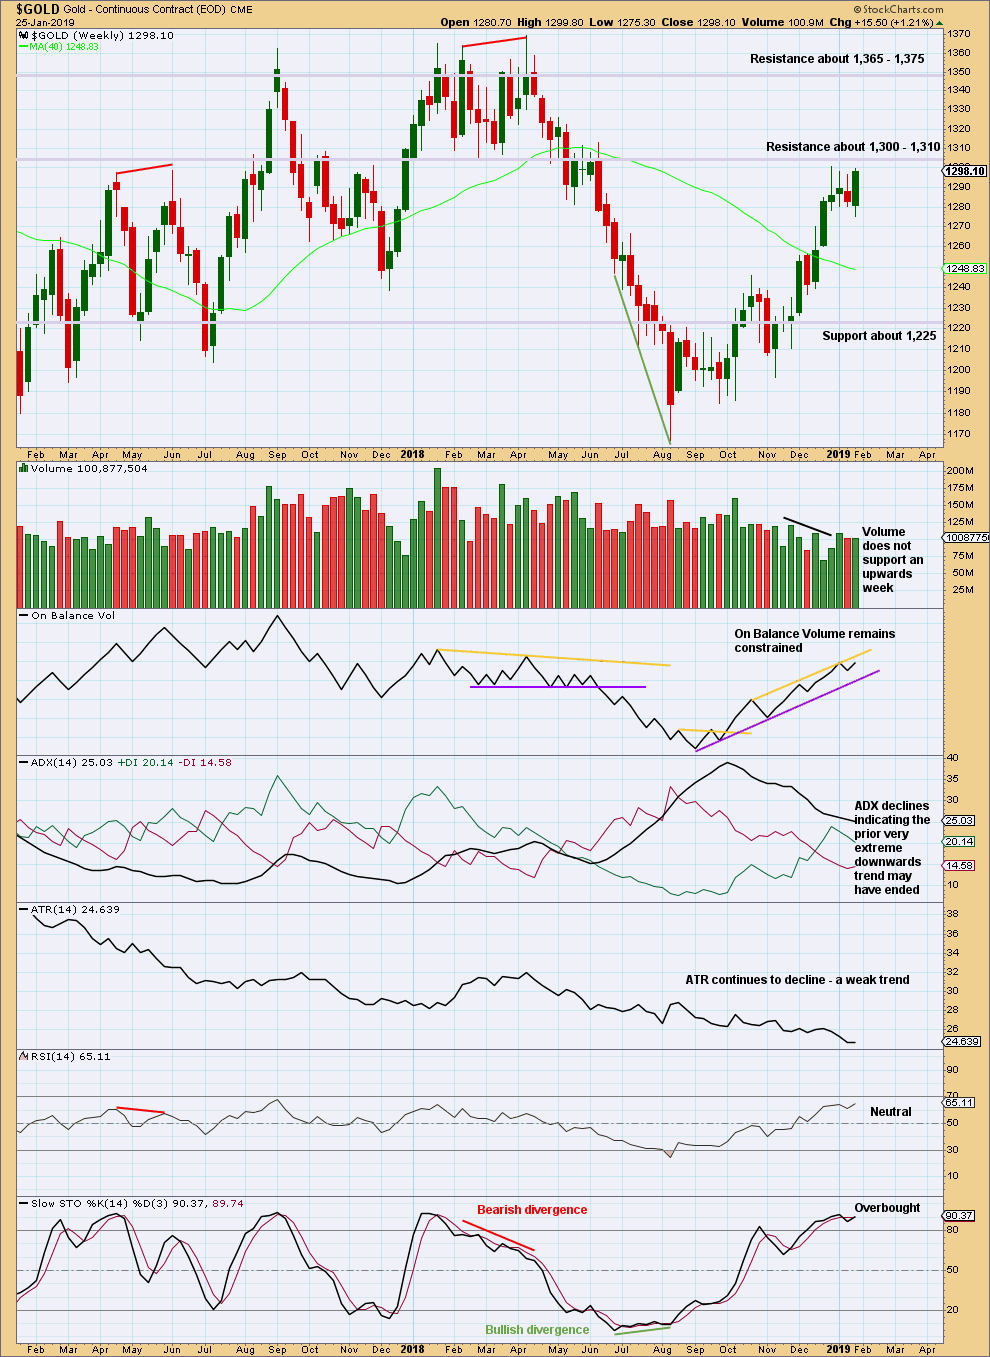
Click chart to enlarge. Chart courtesy of StockCharts.com.
ADX indicates a potential trend change to upwards, but as yet it does not indicate a new trend at this time frame.
DAILY CHART
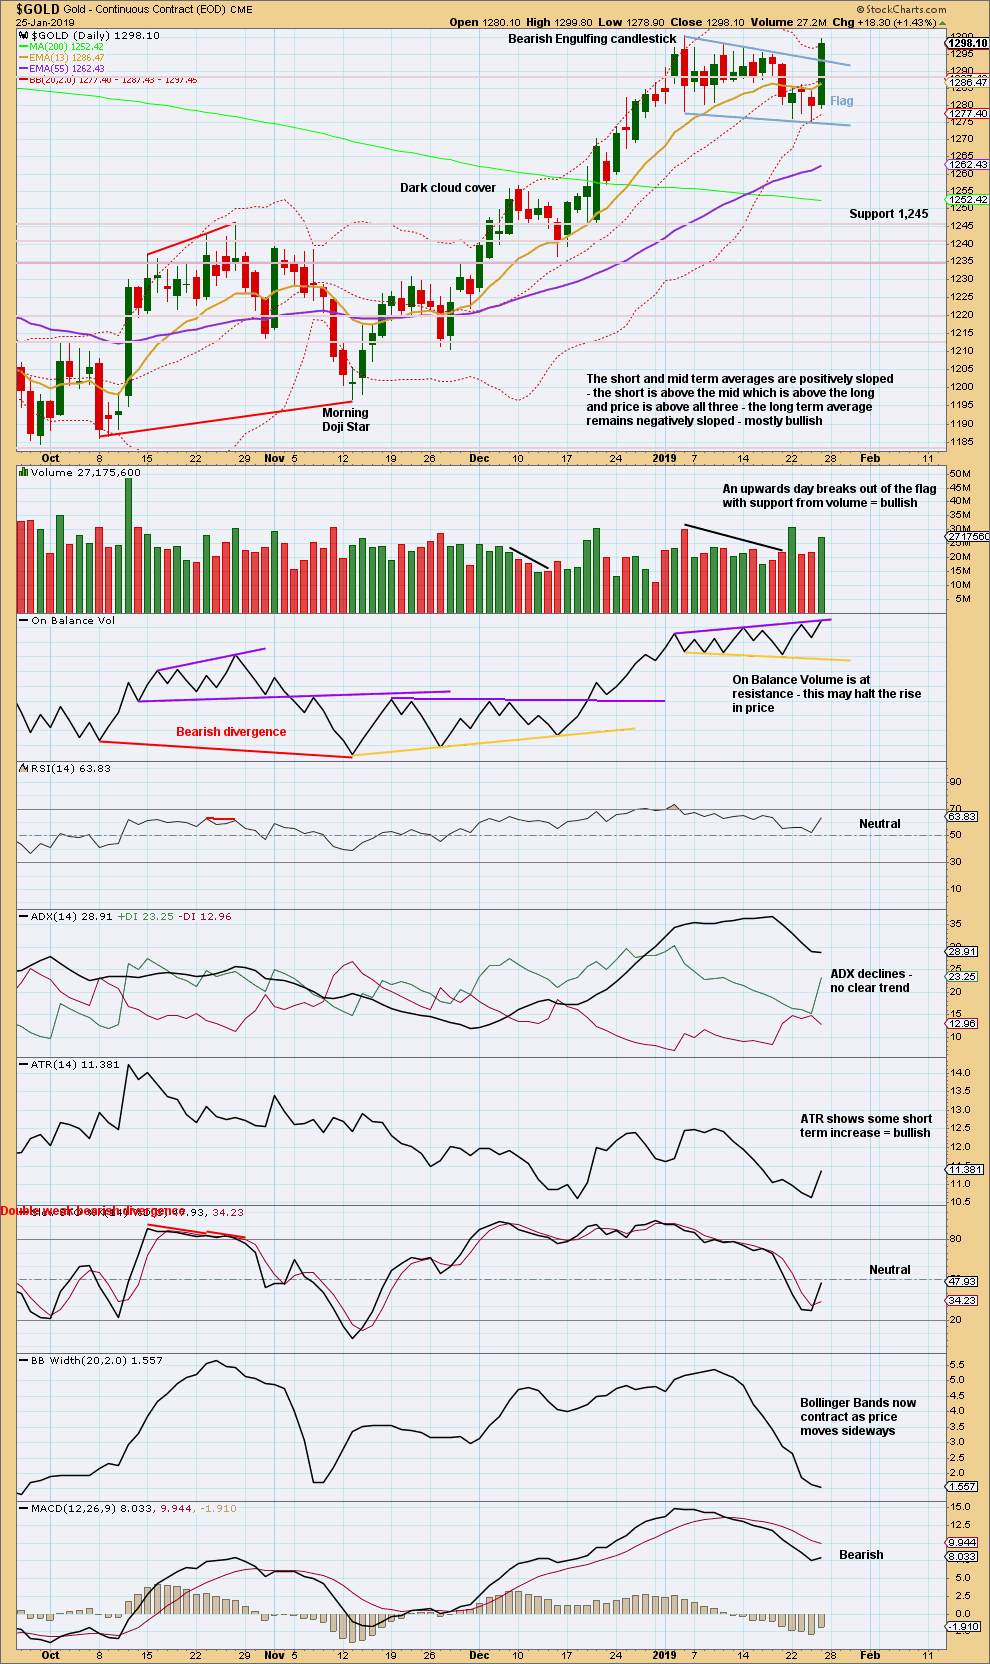
Click chart to enlarge. Chart courtesy of StockCharts.com.
Friday completes a strong bullish candlestick. The close above the upper flag trend line with support from volume is a classic upwards breakout.
Using the flag pole length, a target at 1,359 is calculated. This target looks rather optimistic.
GDX WEEKLY CHART
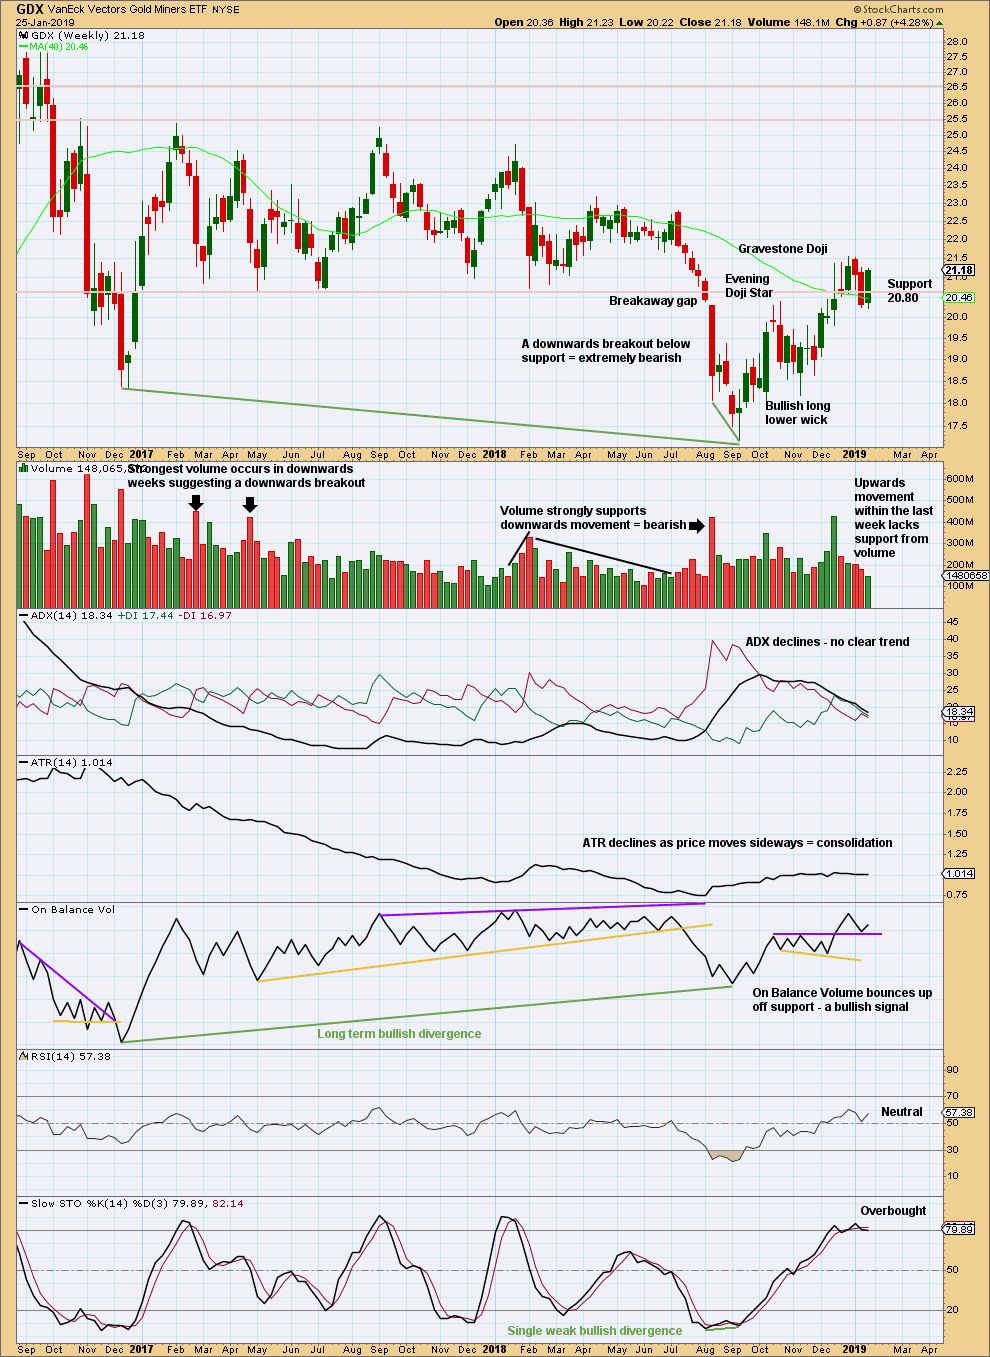
Click chart to enlarge. Chart courtesy of StockCharts.com.
A close back above 20.80 switches the short-term outlook from bearish to neutral or bullish. The short-term daily chart may be more indicative here.
GDX DAILY CHART
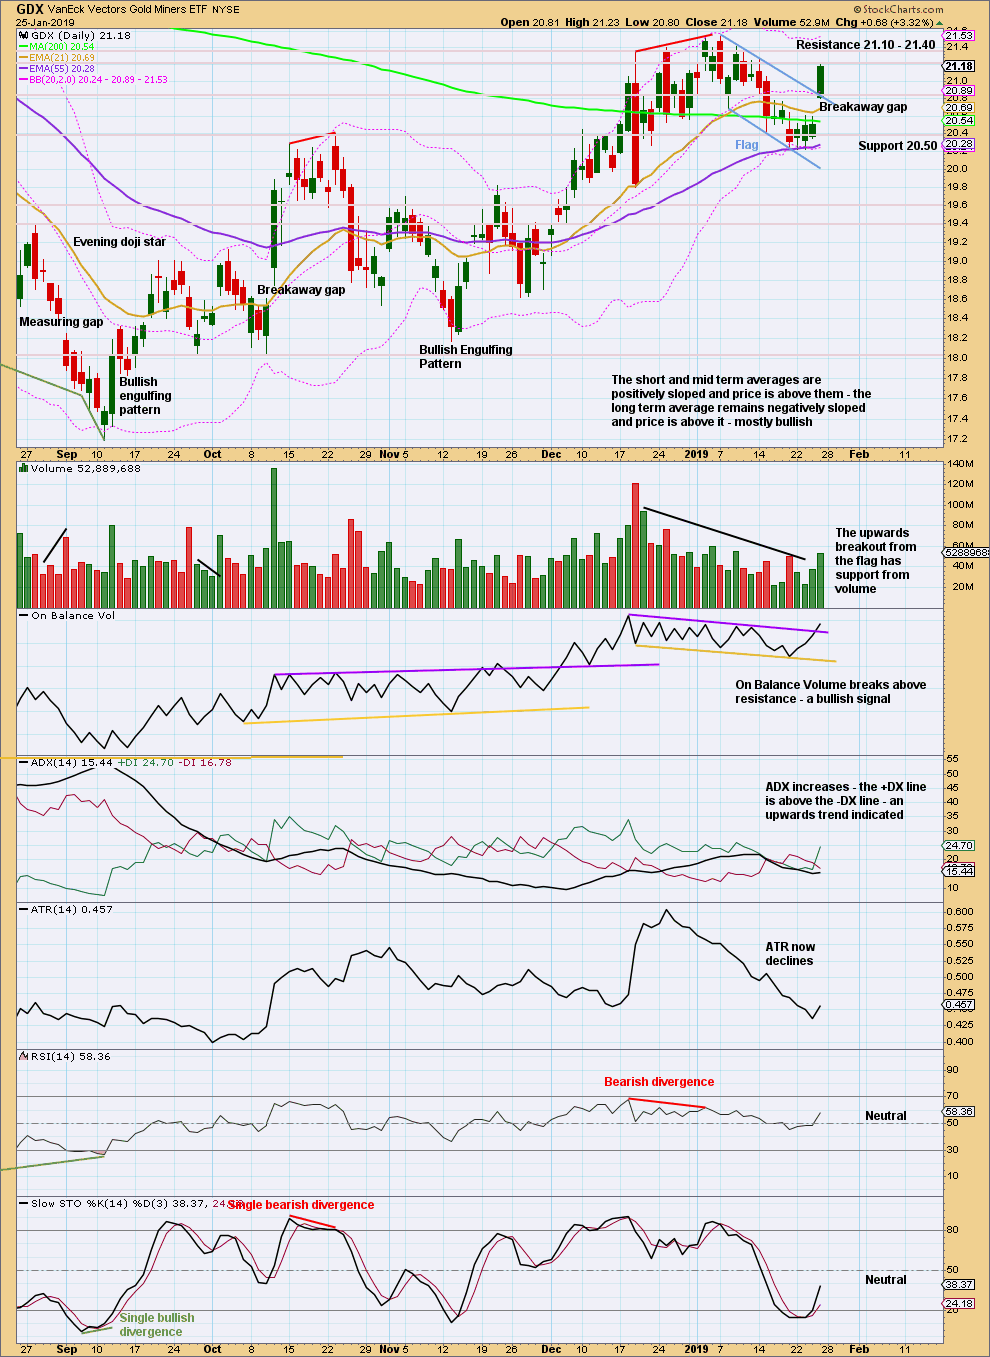
Click chart to enlarge. Chart courtesy of StockCharts.com.
The flag pattern remains valid for GDX. It lasted 14 sessions and now looks complete with an upwards breakout on Friday.
Flags are continuation patterns. The target would be about 22.60.
Published @ 09:13 p.m. EST.
—
Careful risk management protects your trading account(s).
Follow my two Golden Rules:
1. Always trade with stops.
2. Risk only 1-5% of equity on any one trade.
Hourly chart updated:
Minute iv may be over. It may also continue sideways as a shallow flat, triangle or combination. If it does that I would expect it to remain contained within the pink Elliott channel.
If minute iv is over, then it is now possible that minute v could end within the next 24 hours.
Finally CYCLE WAVE b is coming to end.
Looking at other PM sector indicators it appears final wave count may be the bullish ZZ- ???
Other indicators are ; Yield spread between long dated treasury vs short dated treasury, Real price of gold ( ratio of Gold to commodity), credit spread ( ratio of junk bond etf and TLT) and Gold to silver ratio.
They all turn up bullish for gold except for GSR which needs to turn down below 80 for confirmation.
Gold to silver ratio has been massive up trend since bottoming in 1980 at historical low of 15.
Miners to gold ratio (BGMI/GOLD ) followed GSR to bottom in 2016 since topping in 1966. A 55 years long bear trend.
Interesting times ahead!!!
Since this following post yield spread has turn up so as gold and miners.
https://goldtadise.com/?p=438587
Interesting how things work out. The timing for an EW top this week coincides with the Fed Meeting ending On Wed, Jan 30th…