
Upwards movement continues towards the target.
Summary: The next Elliott wave target is at 1,338. The next classic analysis target is at 1,349.
Assume the trend remains the same until proven otherwise.
For confidence in a trend change the following things may be seen:
1. A candlestick reversal pattern on the daily chart.
2. A new low below 1,276.84.
3. A breach of the blue channel on the daily chart.
Once a trend change is indicated, then a new wave down to last years would be expected to make new lows below 1,046.27.
New updates to this analysis are in bold.
Grand SuperCycle analysis is here.
Last historic analysis with monthly charts is here.
Only two remaining wave counts have a reasonable probability and are published below: a triangle (the preferred wave count) and a double zigzag.
MAIN ELLIOTT WAVE COUNT
WEEKLY CHART – TRIANGLE
Click chart to enlarge.
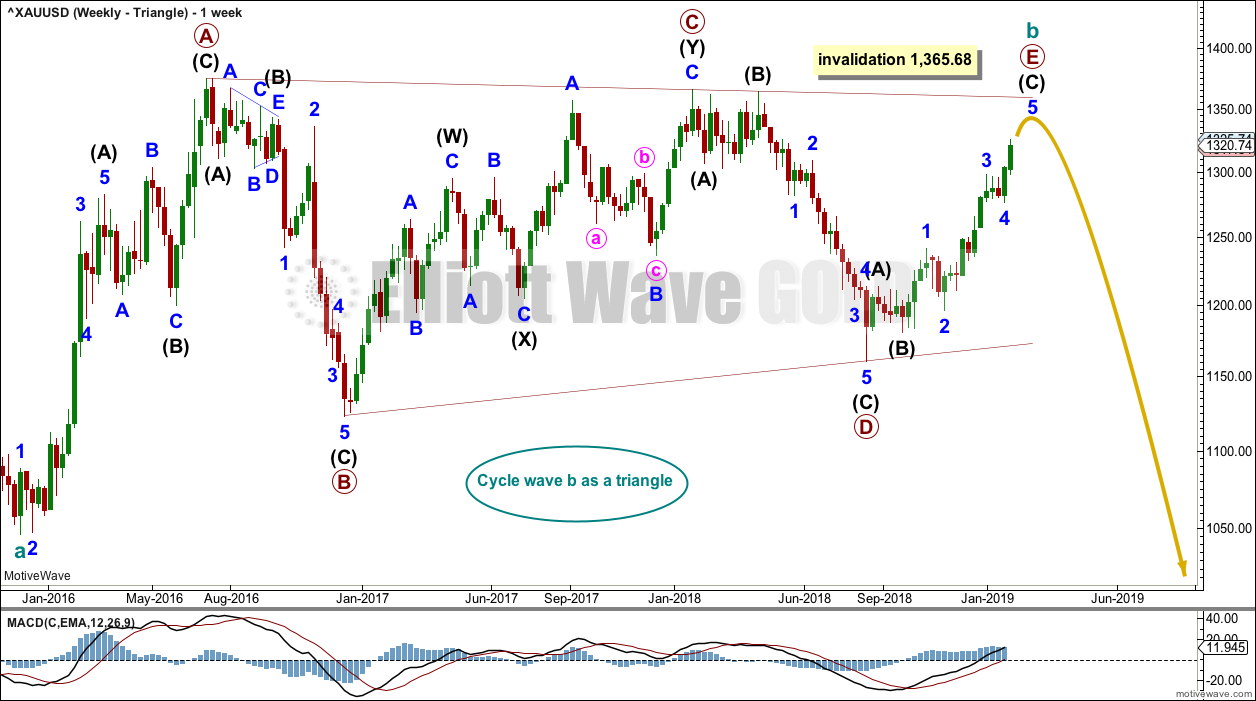
Cycle wave b may be an almost complete regular contracting triangle. Primary wave E may not move beyond the end of primary wave C above 1,365.68.
Within primary wave E, intermediate waves (A) and (B) may be complete. Intermediate wave (C) must subdivide as a five wave structure. This structure is now almost complete.
Four of the five sub-waves of a triangle must be zigzags, with only one sub-wave allowed to be a multiple zigzag. Wave C is the most common sub-wave to subdivide as a multiple, and this is how primary wave C for this example fits best. Primary wave E looks like it is unfolding as a single zigzag.
There are no problems in terms of subdivisions or rare structures for this wave count. It has an excellent fit and so far a typical look.
When primary wave E is a complete three wave structure, then this wave count would expect a cycle degree trend change. Cycle wave c would most likely make new lows below the end of cycle wave a at 1,046.27 to avoid a truncation.
It is possible now that primary wave E may end this week or maybe next week. Some reasonable weakness should be expected at its end. Triangles often end with declining ATR, weak momentum and weak volume.
DAILY CHART – TRIANGLE
Click chart to enlarge.
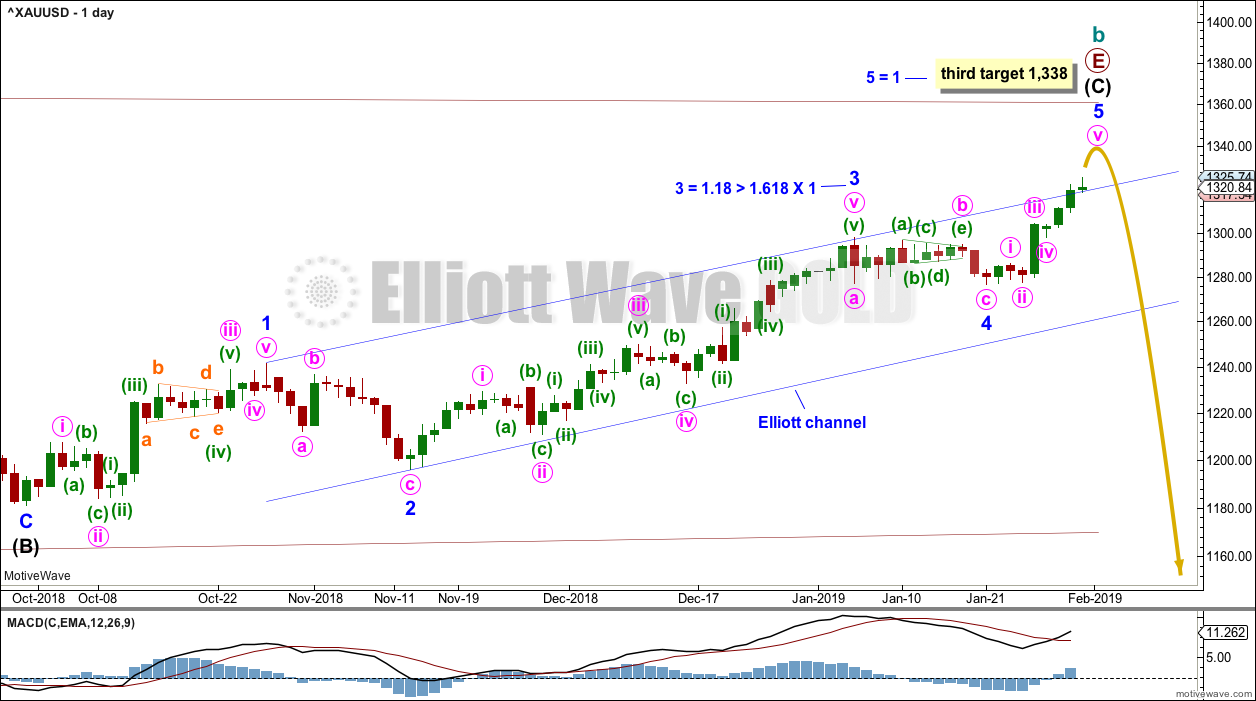
Primary wave E may now be almost complete for this wave count.
Primary wave E should subdivide as a zigzag. Intermediate waves (A) and (B) may now be complete. Intermediate wave (C) may now be almost complete.
Minor wave 2 is a deep 0.75 zigzag. Minor wave 4 may now be a complete a zigzag. Alternation is a guideline, not a rule, and is not always seen. Zigzags are the most common corrective structure. There is still alternation in depth: minor wave 2 was deep and minor wave 4 was very shallow.
Minor wave 3 exhibits the most common Fibonacci ratio to minor wave 1.
It is now possible to see minor wave 5 complete at the daily and hourly chart level. However, it is always safest to assume the trend remains the same until proven otherwise. For any confidence in a trend change it needs to be indicated by one or more of the following:
1. A candlestick reversal pattern on the daily chart.
2. A new low below 1,276.84.
3. A breach of the blue channel on the daily chart.
One target now remains for minor wave 5 to end.
The target would expect primary wave E to fall short of the maroon A-C trend line. This is the most common look for E waves of Elliott wave triangles.
Two hourly charts are given for two different ways to label minor wave 5.
MAIN HOURLY CHART
Click chart to enlarge.
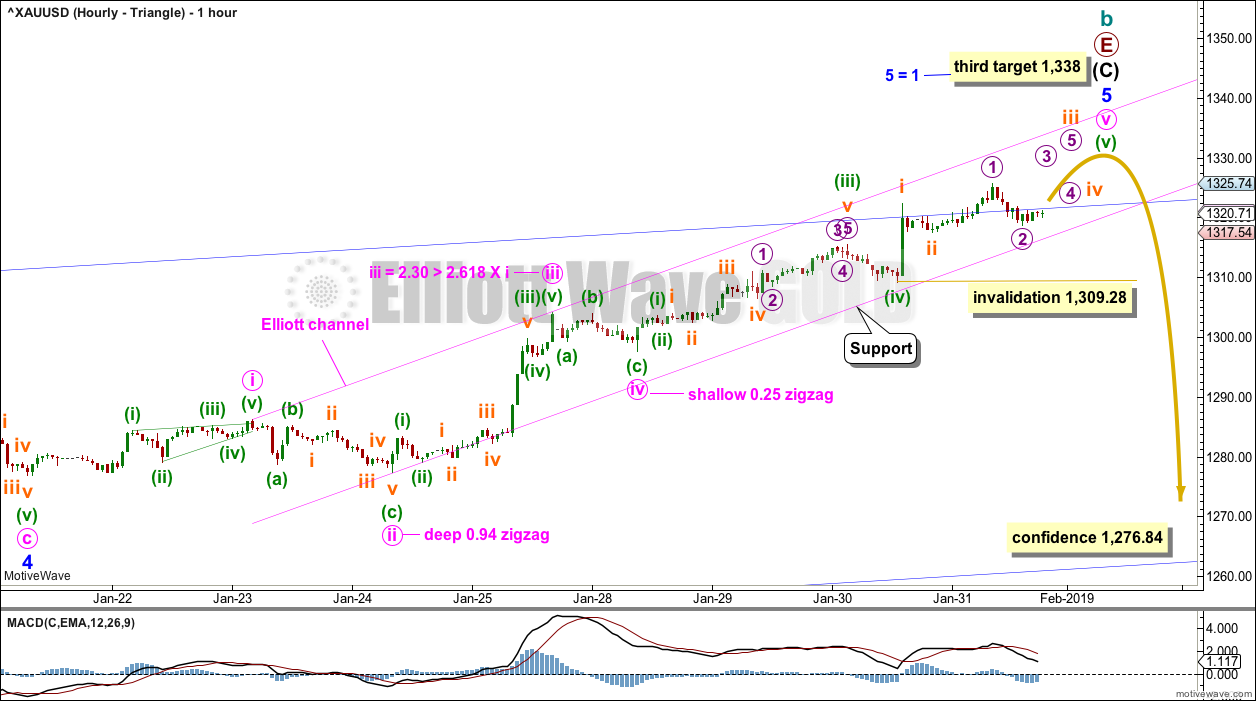
There is more than one way to label minor wave 5. This labelling agrees with MACD and so has a higher probability. The strongest momentum is at minute wave iii. Minute wave v shows weaker momentum.
Within the final fifth wave of minuette wave (v), no second wave correction may move beyond its start below 1,309.28.
This wave count expects possibly another one to two days of upwards movement. When the structure of minuette wave (v) may be complete, then the short term invalidation point no longer applies and a trend change would be expected.
ALTERNATE HOURLY CHART
Click chart to enlarge.
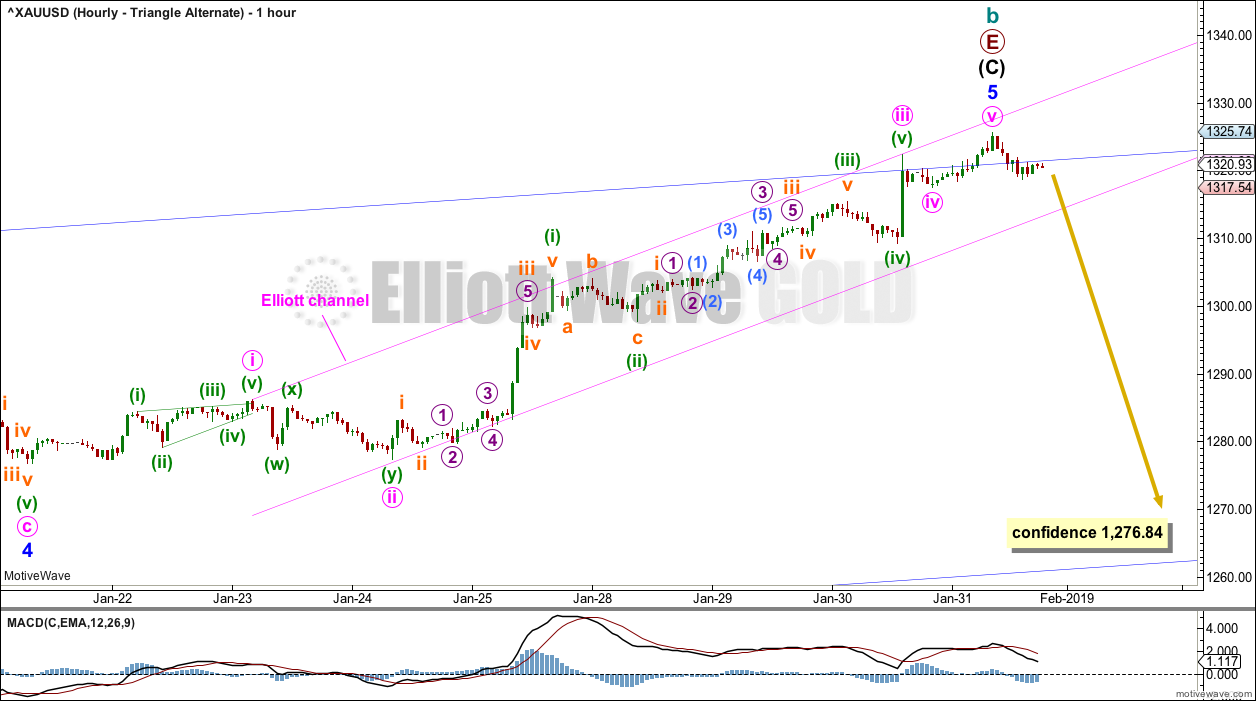
It is possible that minor wave 5 may be complete. However, this labelling does not agree with MACD. Strongest momentum is within a first wave within minute wave iii.
There are no adequate Fibonacci ratios between minute waves i, iii and v.
The first indication that this wave count may be correct would be a breach of the narrow pink Elliott channel by downwards (not sideways) movement.
A new low below 1,276.84 would add further confidence. A breach of the blue channel on the daily chart would add reasonable confidence.
WEEKLY CHART – DOUBLE ZIGZAG
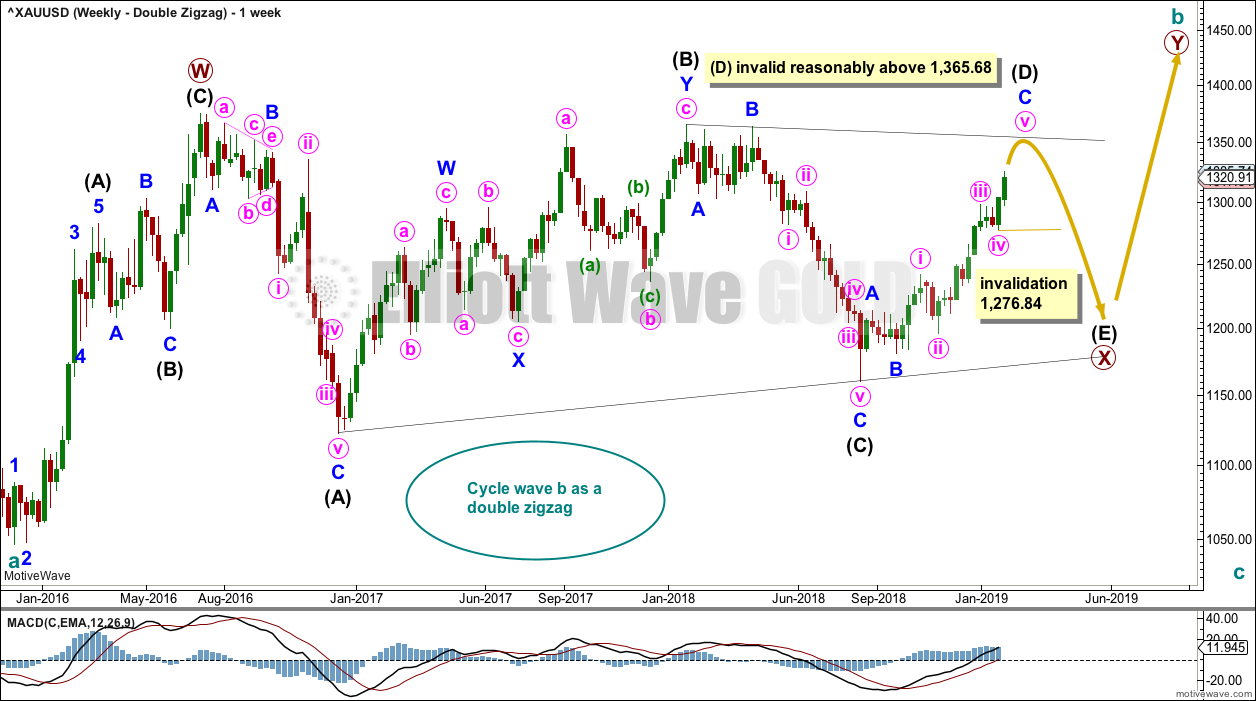
Click chart to enlarge.
It is possible that cycle wave b may be a double zigzag or a double combination.
The first zigzag in the double is labelled primary wave W. This has a good fit.
The double may be joined by a corrective structure in the opposite direction, a triangle labelled primary wave X. The triangle would be about three quarters complete.
Within the triangle of primary wave X, intermediate wave (C) should be complete. Within intermediate wave (D), minor waves A and B may be complete. Minor wave C must subdivide as a five wave structure. Within minor wave C, minute wave iv should now be over. Within minute wave v, no second wave correction may move beyond its start below 1,276.84.
Intermediate wave (D) would most likely subdivide as a single zigzag. Intermediate wave (D) should end at the upper (B)-(D) trend line for this wave count, so that the triangle adheres neatly to this trend line. That price point is about 1,354. This wave count now requires upwards movement to continue. It would not be acceptable for the upper (B)-(D) trend line to have breaches or substantial overshoots. Elliott wave triangles almost always adhere very neatly to their trend lines.
This wave count may now expect choppy overlapping movement in an ever decreasing range for a few more months.
Primary wave Y would most likely be a zigzag because primary wave X would be shallow; double zigzags normally have relatively shallow X waves.
Primary wave Y may also be a flat correction if cycle wave b is a double combination, but combinations normally have deep X waves. This would be less likely.
This wave count has good proportions and no problems in terms of subdivisions.
TECHNICAL ANALYSIS
WEEKLY CHART
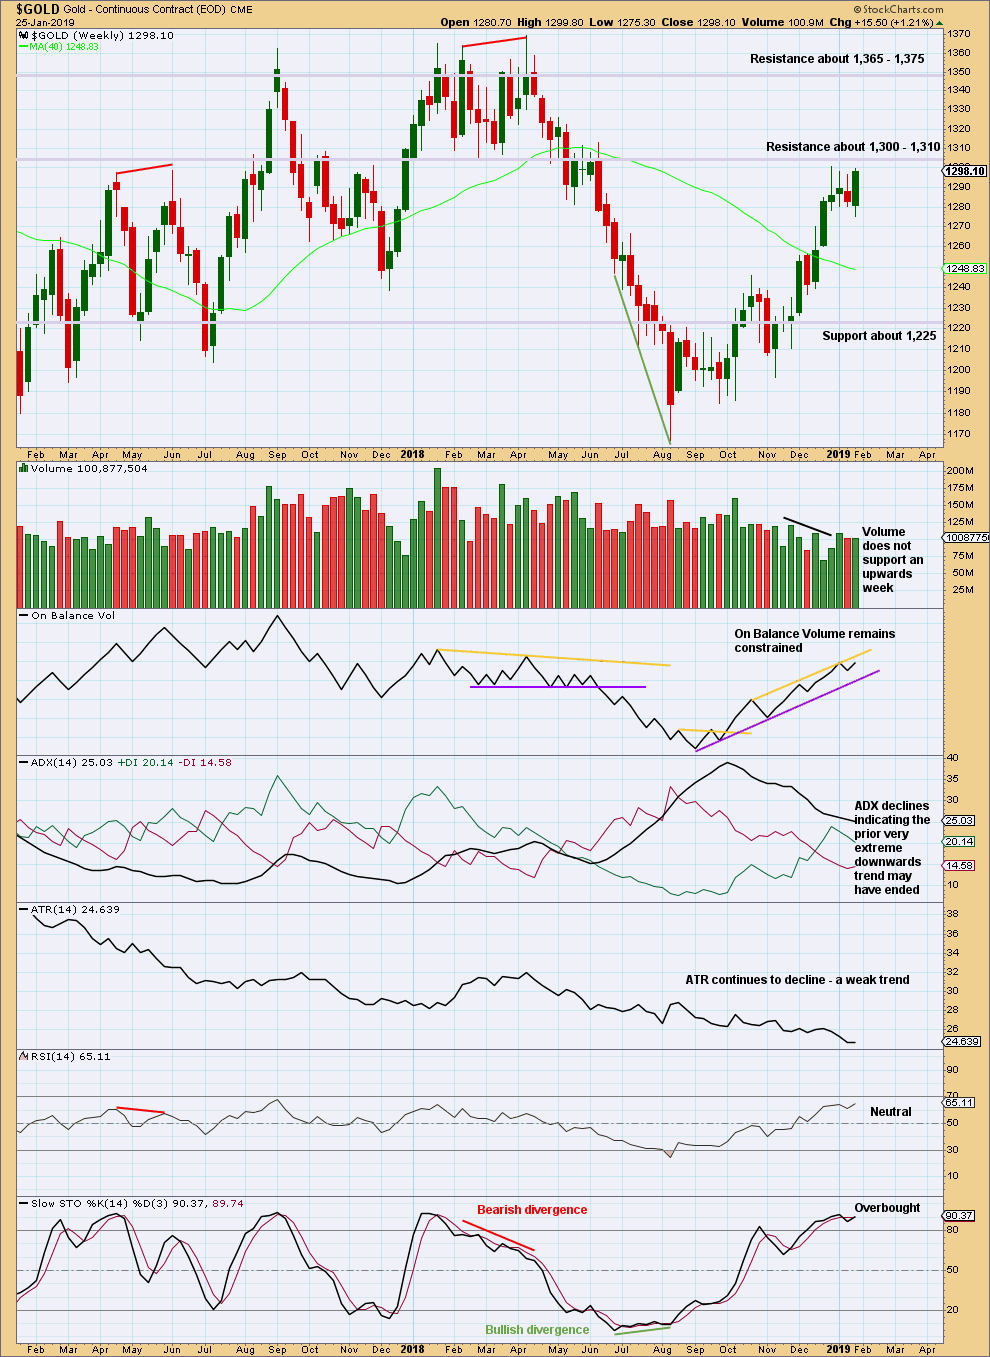
Click chart to enlarge. Chart courtesy of StockCharts.com.
ADX indicates a potential trend change to upwards, but as yet it does not indicate a new trend at this time frame.
DAILY CHART
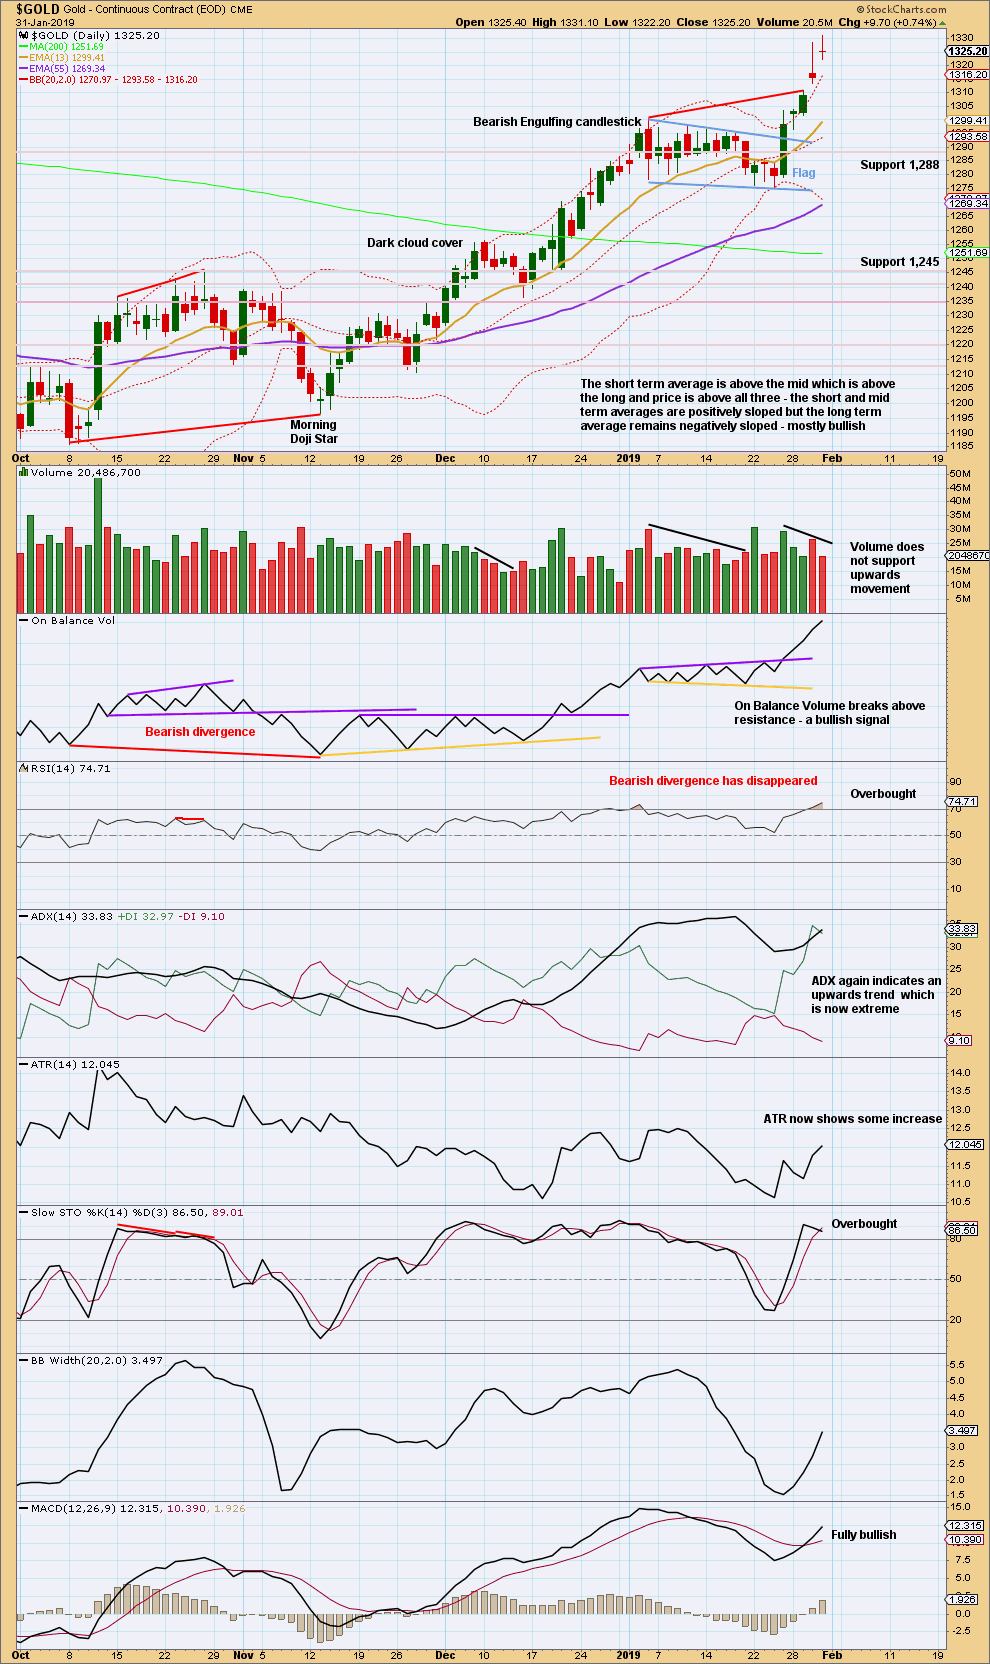
Click chart to enlarge. Chart courtesy of StockCharts.com.
The close above the upper flag trend line with support from volume is a classic upwards breakout.
Using the flag pole length, a target at 1,359 is calculated. This target looks rather optimistic.
The last gap may be a measuring gap. A shorter-term target calculated using this gap is at 1,349.
The trend is extreme, but there is still room for it to continue. There is no sign yet of a trend reversal. The doji signals caution today; expectations may be moved from bullish to neutral, at least temporarily.
GDX WEEKLY CHART
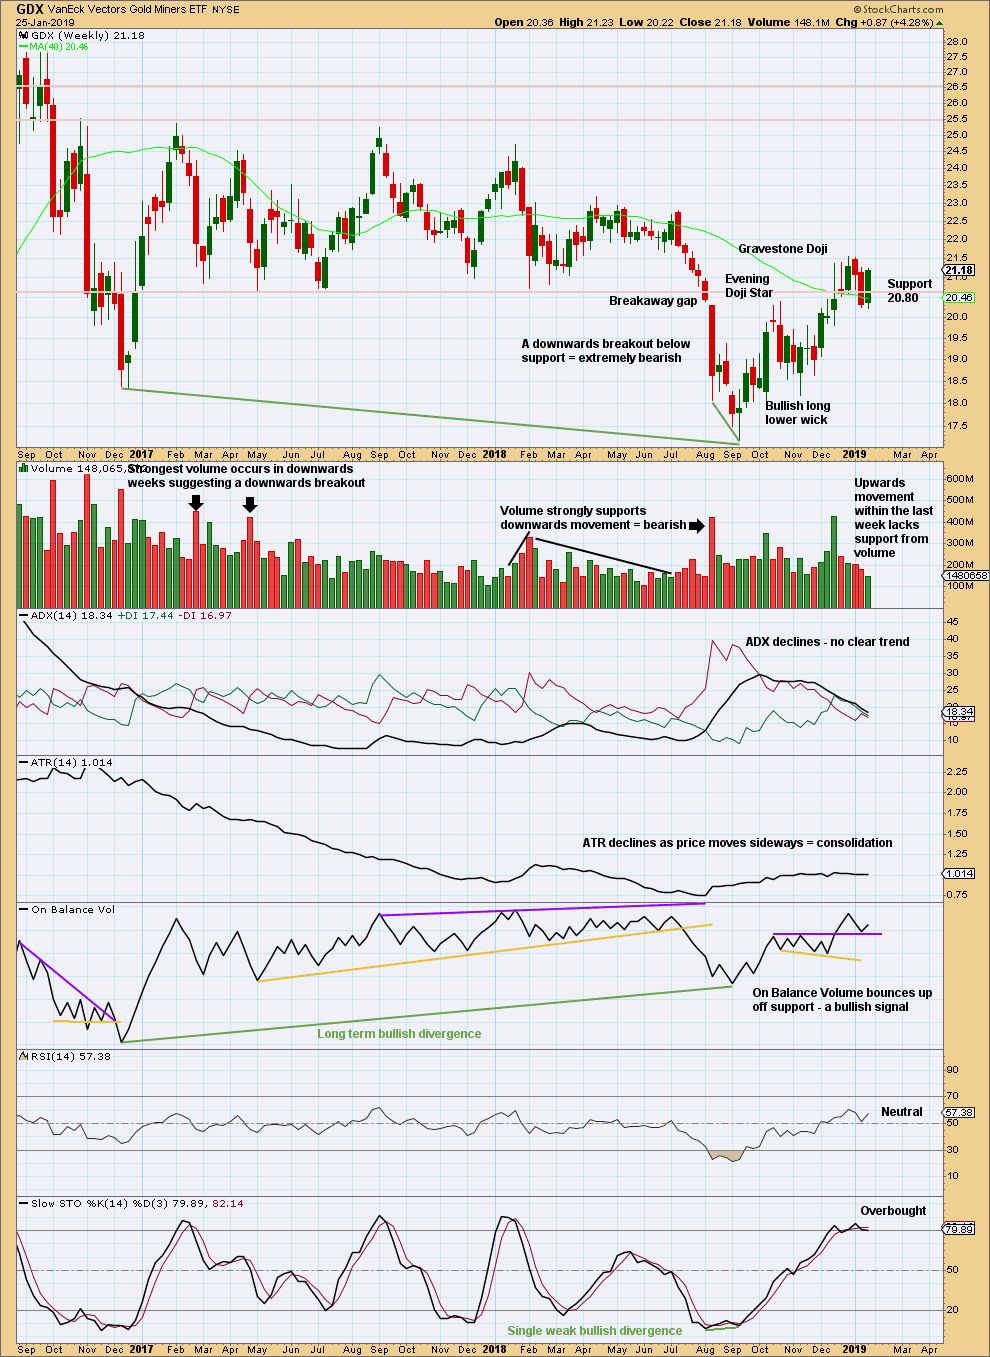
Click chart to enlarge. Chart courtesy of StockCharts.com.
A close back above 20.80 switches the short-term outlook from bearish to neutral or bullish. The short-term daily chart may be more indicative here.
GDX DAILY CHART
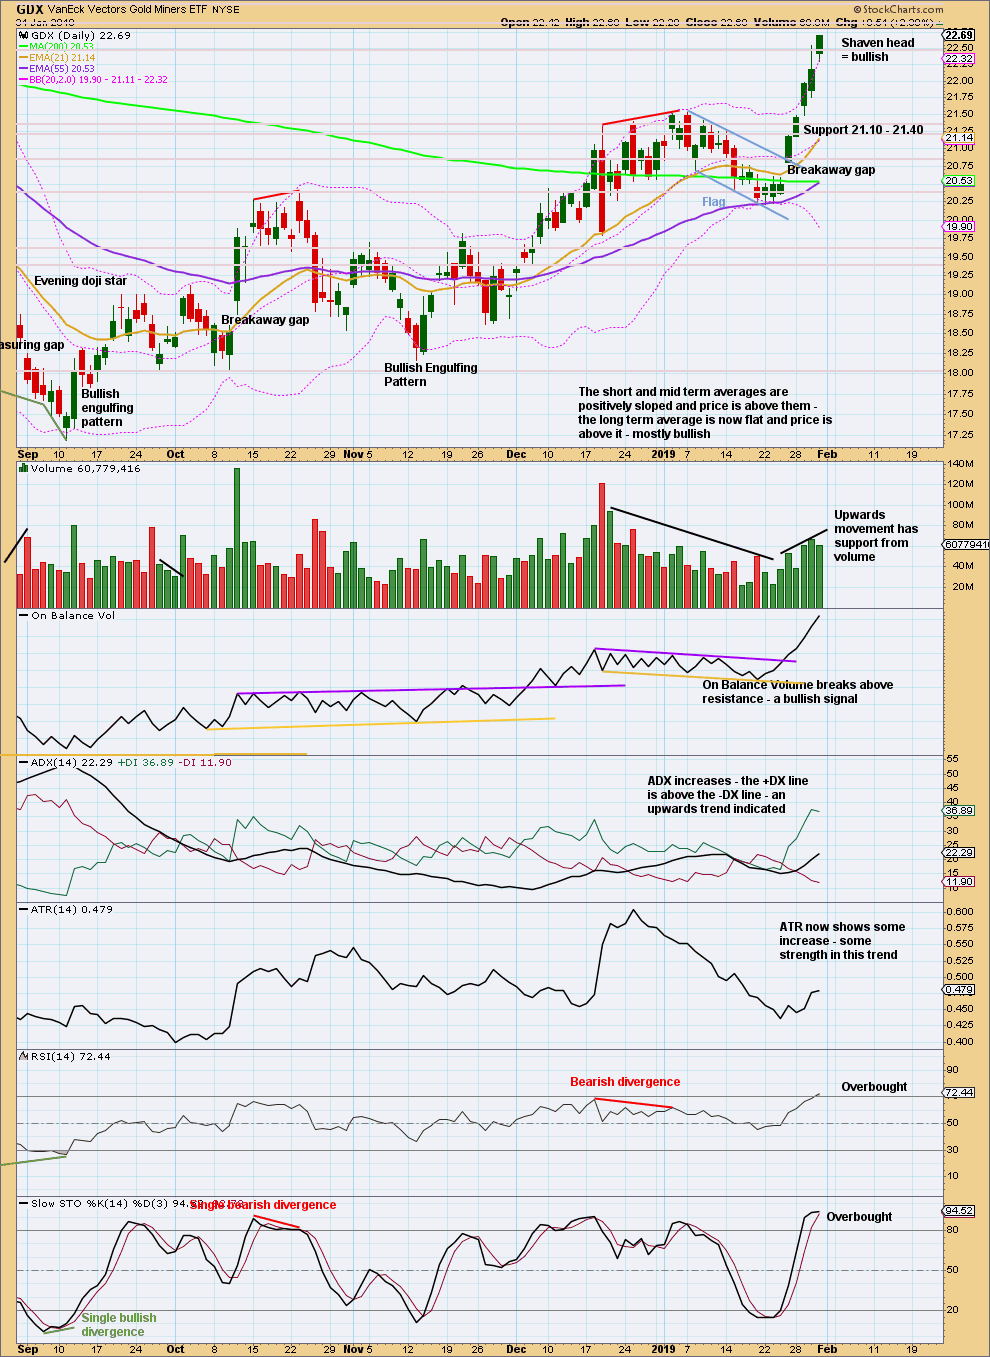
Click chart to enlarge. Chart courtesy of StockCharts.com.
The flag pattern remains valid for GDX. It lasted 14 sessions and now looks complete with an upwards breakout on Friday.
Flags are continuation patterns. The target would be about 22.60.
There is room still for price to continue higher. The shaven head on today’s candlestick strongly suggests more upwards movement ahead.
Published @ 08:23 p.m. EST.
—
Careful risk management protects your trading account(s).
Follow my two Golden Rules:
1. Always trade with stops.
2. Risk only 1-5% of equity on any one trade.
This is the main hourly chart, somewhat adjusted for most recent movement. I’m now having difficulty seeing minute v as incomplete. The size and structure of submineutte wave ii within minuette wave (v) doesn’t fit.
I’ll try a different way of labelling this, it won’t be published like this for your end of week analysis, but I wanted to illustrate how this is not working. I hope that makes sense?
Gold may be in a topping process.
The alternate on the other hand has no new problems today. It still doesn’t agree with MACD.
I’ll take some time to see if there’s another way to label minor wave 5 which agrees with MACD and sees it as complete. If I can find a solution today I’ll publish it.
For now, if minor 5 is complete, this is the best I’ve got.
Note that for both wave counts the most narrow pink Elliott channels are both now breached to the downside.
That’s the earliest indication that cycle wave b just might be over.
Thank you, Lara. This is exactly what I was going to ask for (a solution that agrees with MACD). Thank you for your fine work.
You’re welcome 🙂
Can anyone make out the wave count for Oil? Seems very confusing.
Oil is still likely in Minor B. Minor B started with a “3” down, then a “3” up to new highs. Now expecting a move down. I think Minor B might be an expanded Flat. If so, the move down should be a “5” and end around 50-51 which is lower than the 1st leg down of the expanded flat. It’s also possible that Minor B could turn into a triangle or combination. Time will tell.
Expecting a strong move up to start likely next week once Minor B is complete.
Thanks Dreamer,
Yes I thought Minor B was morphing into a flat.
Minor B may still be continuing. But I’m going to base that decision on the strength of Friday’s upwards movement. If volume supports it and there are any bullish signals, then I’ll label minor B as complete.
But if there’s weakness, this may be minute b within minor B.
Minor B may be an expanded flat.
B waves should exhibit weakness.
Screw you Lara screw you for your crazy analysis I made almost 40% profit for my mini managed fund, just January alone. Keep it up and happy Chinese New Year, if you do celebrate it in your country.
Hmmm, this comment doesn’t start well, but it seems to be a compliment?
Yes, and happy CNY to you too 😀
Oooooookaaaay…..
Yeah, I started reading your comment and my stomach twisted… then I read the end and realised you were happy.
I’ll take that as a compliment. I’m pleased you’ve been able to profit from my analysis.
Just FYI, “screw you” is a rather aggressive negative comment here in NZ. I realise you don’t mean it that way, but here that’s what it is.
“Just FYI…….”
Ahh alright, my bad. Thought wanna make it sounds cooler that way 🙁
Will watch my words from now on. Thanks again for your hard work and excellent analysis 😀
It’s okay. I understand how it was meant 🙂