
The target for upwards movement to end was at 1,295. Friday’s high at 1,295.98 almost perfectly met expectations. Members were warned to look out for a sharp reversal after the upwards wave ended.
Summary: A sideways consolidation is now expected for a fourth wave to last about 2 to 4 weeks. It may find support about 1,259 and resistance about 1,300.
The final target for this bounce to end is about 1,305 – 1,310.
New updates to this analysis are in bold.
Grand SuperCycle analysis is here.
Last historic analysis with monthly charts is here.
Only two remaining wave counts have a reasonable probability and are published below: a triangle (the preferred wave count) and a double zigzag. The combination wave count is discarded this week based upon a very low probability.
MAIN ELLIOTT WAVE COUNT
WEEKLY CHART – TRIANGLE
Click chart to enlarge.
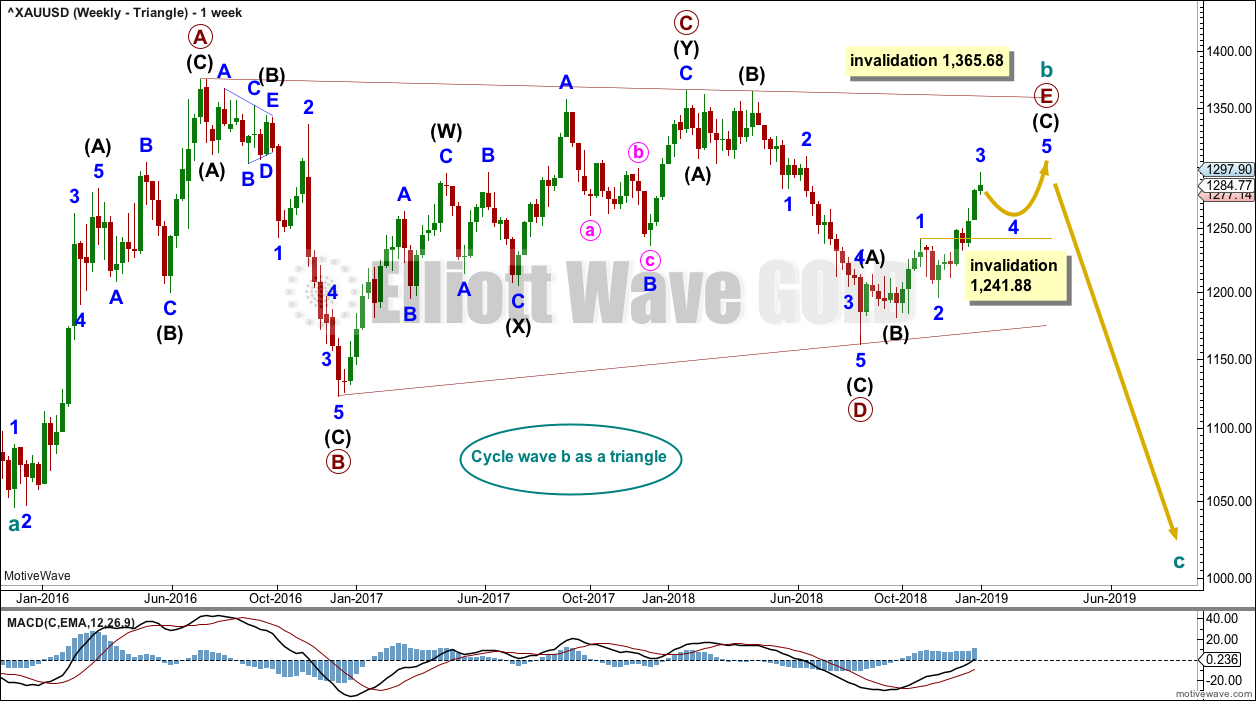
Cycle wave b may be an incomplete regular contracting triangle. Primary wave E may not move beyond the end of primary wave C above 1,365.68.
Within primary wave E, intermediate waves (A) and (B) may be complete. Intermediate wave (C) must subdivide as a five wave structure. Within intermediate wave (C), minor wave 4 may not move into minor wave 1 price territory below 1,241.88.
Four of the five sub-waves of a triangle must be zigzags, with only one sub-wave allowed to be a multiple zigzag. Wave C is the most common sub-wave to subdivide as a multiple, and this is how primary wave C for this example fits best. Primary wave E would most likely be a single zigzag. It is also possible that it may subdivide as a triangle to create a rare nine wave triangle.
There are no problems in terms of subdivisions or rare structures for this wave count. It has an excellent fit and so far a typical look.
When primary wave E is a complete three wave structure, then this wave count would expect a cycle degree trend change. Cycle wave c would most likely make new lows below the end of cycle wave a at 1,046.27 to avoid a truncation.
It is possible now that primary wave E may end in January or February 2019. Some reasonable weakness should be expected at its end. Triangles often end with declining ATR, weak momentum and weak volume.
DAILY CHART – TRIANGLE
Click chart to enlarge.
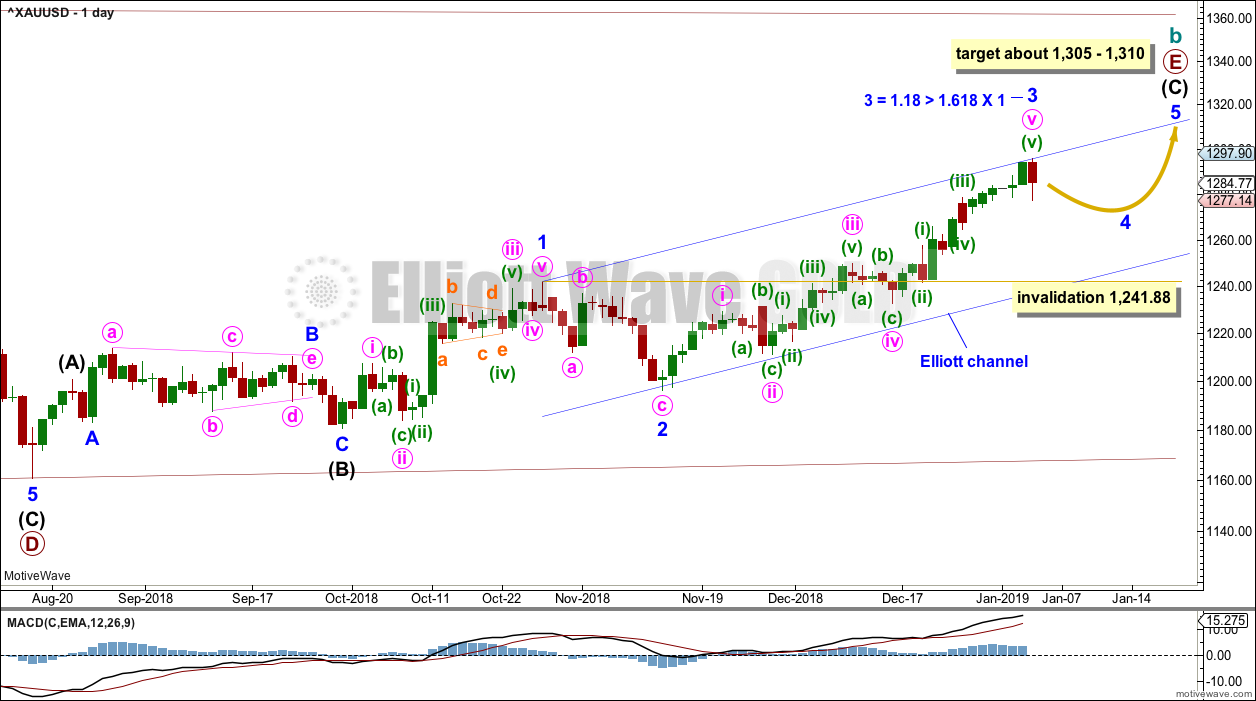
Primary wave E may now be nearing its final stages for this wave count.
Primary wave E should subdivide as a zigzag. Intermediate waves (A) and (B) may now be complete. Intermediate wave (C) may now be nearing completion.
Minor wave 2 is a deep 0.75 zigzag. Minor wave 4 may be expected to most likely be a shallow sideways flat, triangle or combination.
Minor wave 3 exhibits the most common Fibonacci ratio to minor wave 1.
Minor wave 4 may not move into minor wave 1 price territory below 1,241.88.
A target for primary wave E is the strong zone of resistance about 1,305 to 1,310. Primary wave E is most likely to subdivide as a zigzag (although it may also subdivide as a triangle to create a rare nine wave triangle). It may last a total Fibonacci 21 or 34 weeks. So far it has lasted 20 weeks. Primary wave E may not move beyond the end of primary wave C above 1,365.68.
HOURLY CHART – TRIANGLE
Click chart to enlarge.
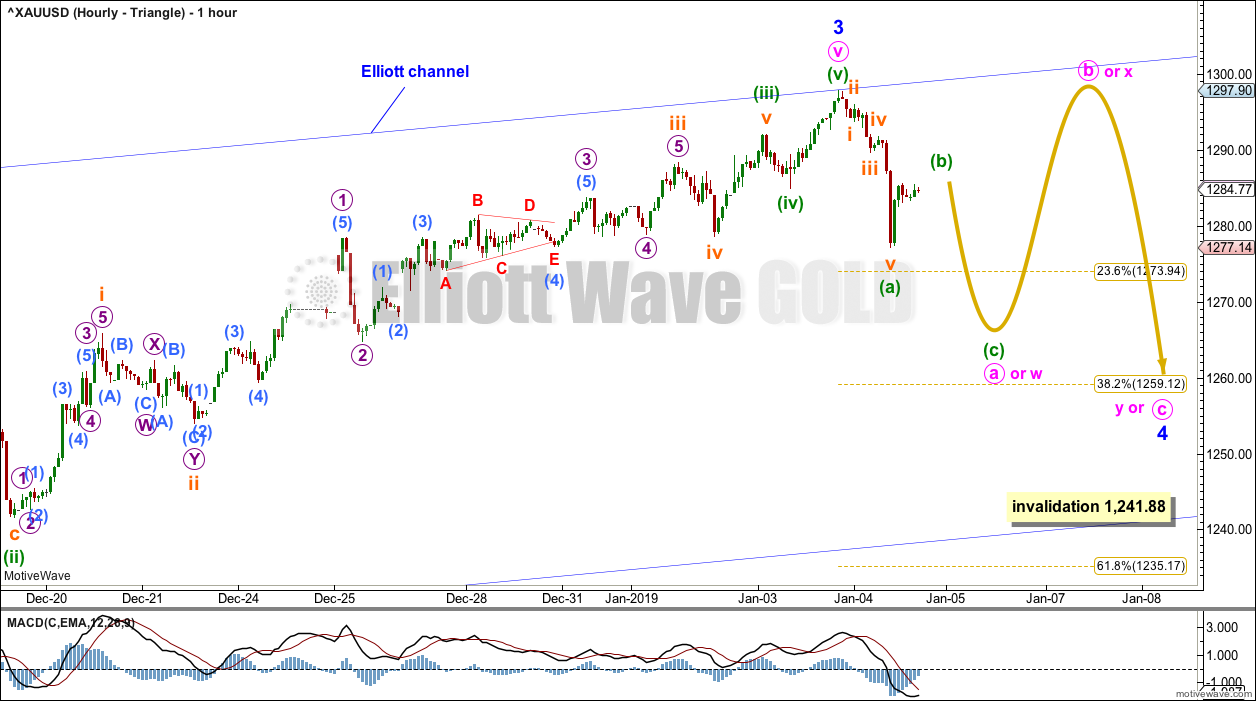
The hourly chart focusses on the end of minor wave 3 and the start of minor wave 4.
Minor wave 4 would most likely to subdivide as a flat, triangle or combination to exhibit alternation with the zigzag of minor wave 2. All of a flat, triangle or combination begin with a three wave structure for minute wave a or w, which is usually a zigzag.
It will be essential over the next few weeks to be flexible because there are several possible structures for minor wave 4, so the labelling within it will probably change as it unfolds; alternate wave counts may be required. The focus should not be on identifying each small swing within minor wave 4. The focus should be on identifying when its structure may be complete and then the trend may resume.
WEEKLY CHART – DOUBLE ZIGZAG
Click chart to enlarge.
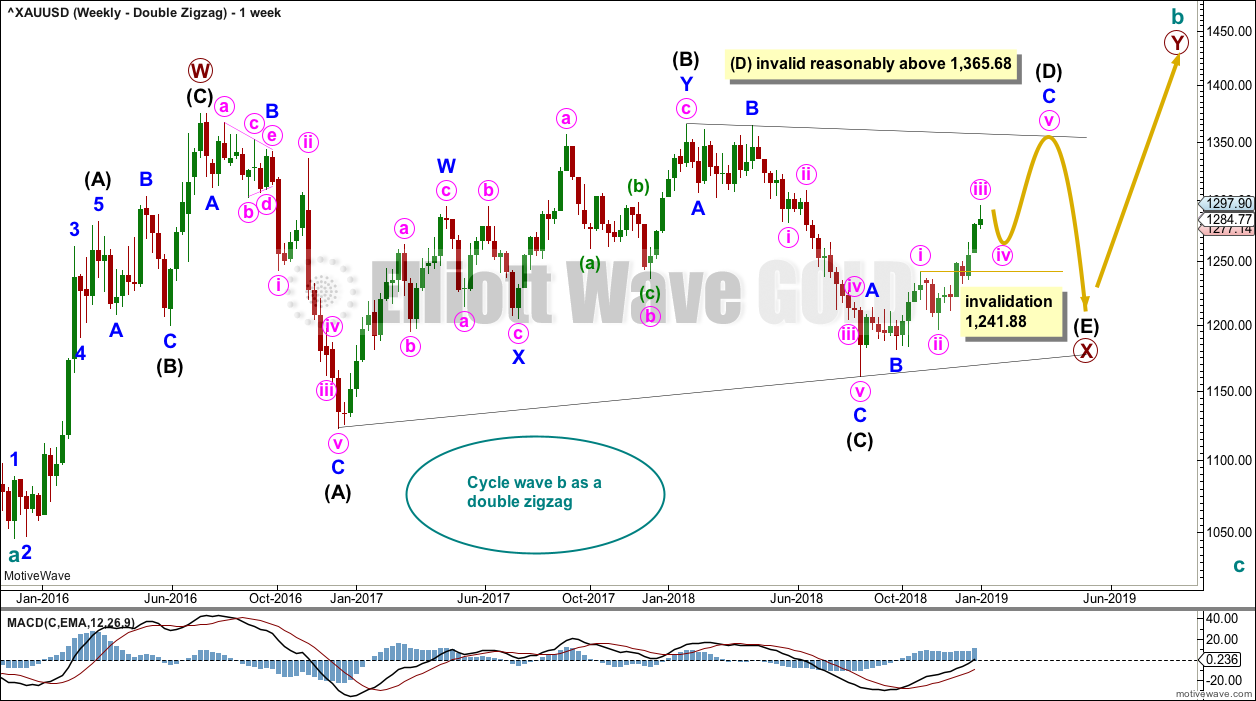
It is possible that cycle wave b may be a double zigzag or a double combination.
The first zigzag in the double is labelled primary wave W. This has a good fit.
The double may be joined by a corrective structure in the opposite direction, a triangle labelled primary wave X. The triangle would be about three quarters complete.
Within the triangle of primary wave X, intermediate wave (C) should be complete. Within intermediate wave (D), minor waves A and B may be complete. Minor wave C must subdivide as a five wave structure. Within minor wave C, minute wave iv may not move into minute wave i price territory below 1,241.88.
Intermediate wave (D) would most likely subdivide as a single zigzag.
This wave count may now expect choppy overlapping movement in an ever decreasing range for several more months.
Primary wave Y would most likely be a zigzag because primary wave X would be shallow; double zigzags normally have relatively shallow X waves.
Primary wave Y may also be a flat correction if cycle wave b is a double combination, but combinations normally have deep X waves. This would be less likely.
This wave count has good proportions and no problems in terms of subdivisions.
TECHNICAL ANALYSIS
WEEKLY CHART
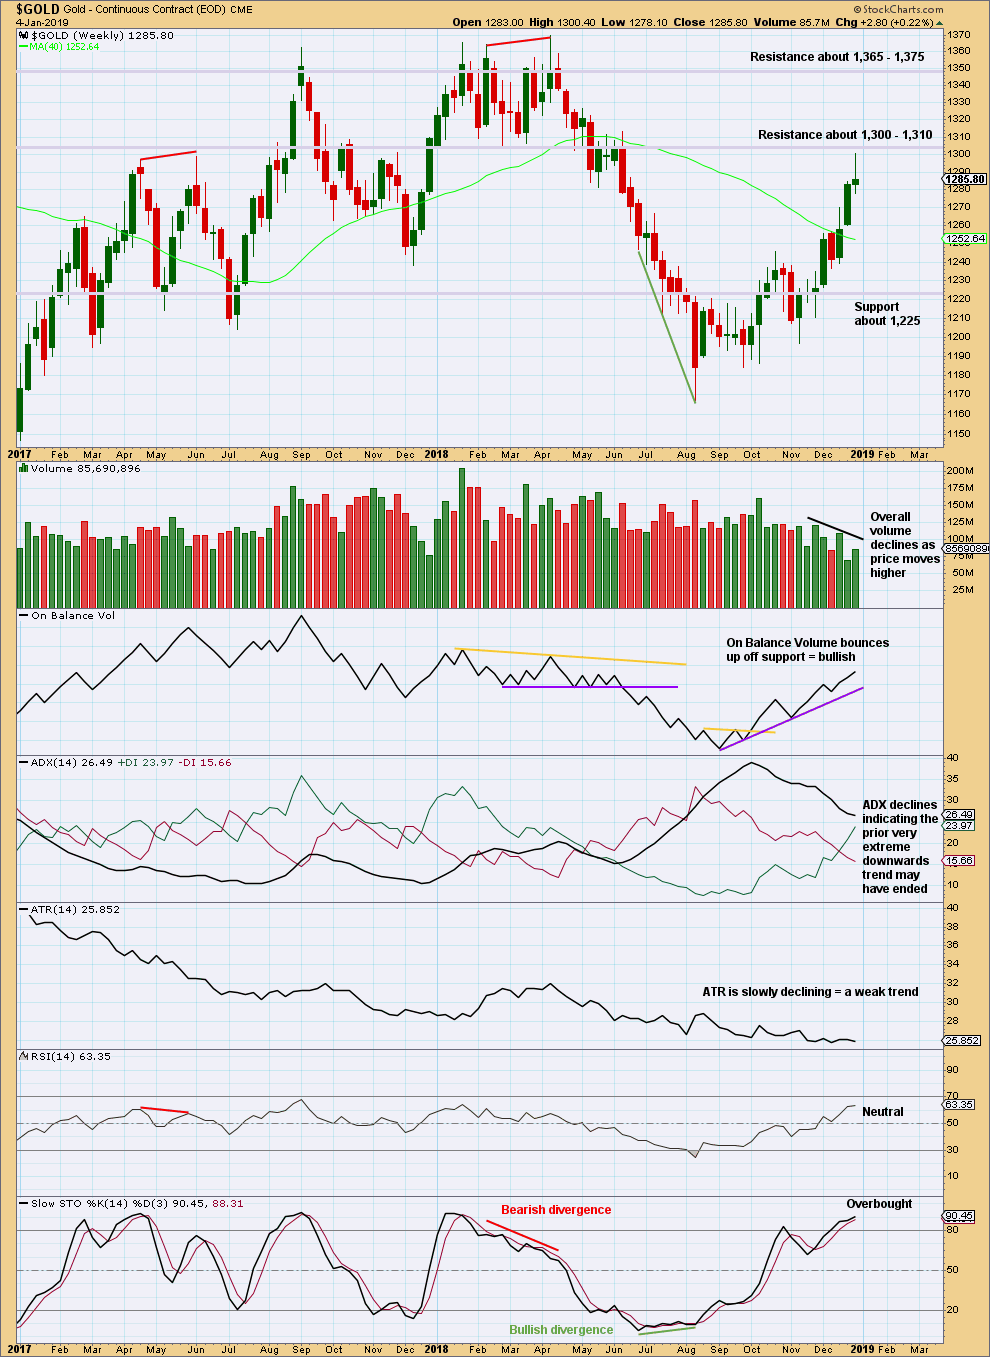
Click chart to enlarge. Chart courtesy of StockCharts.com.
This upwards movement lacks some strength. Volume is overall not supporting it. The long upper wick on this weekly candlestick at an area of strong resistance indicates some sideways movement may result here.
DAILY CHART
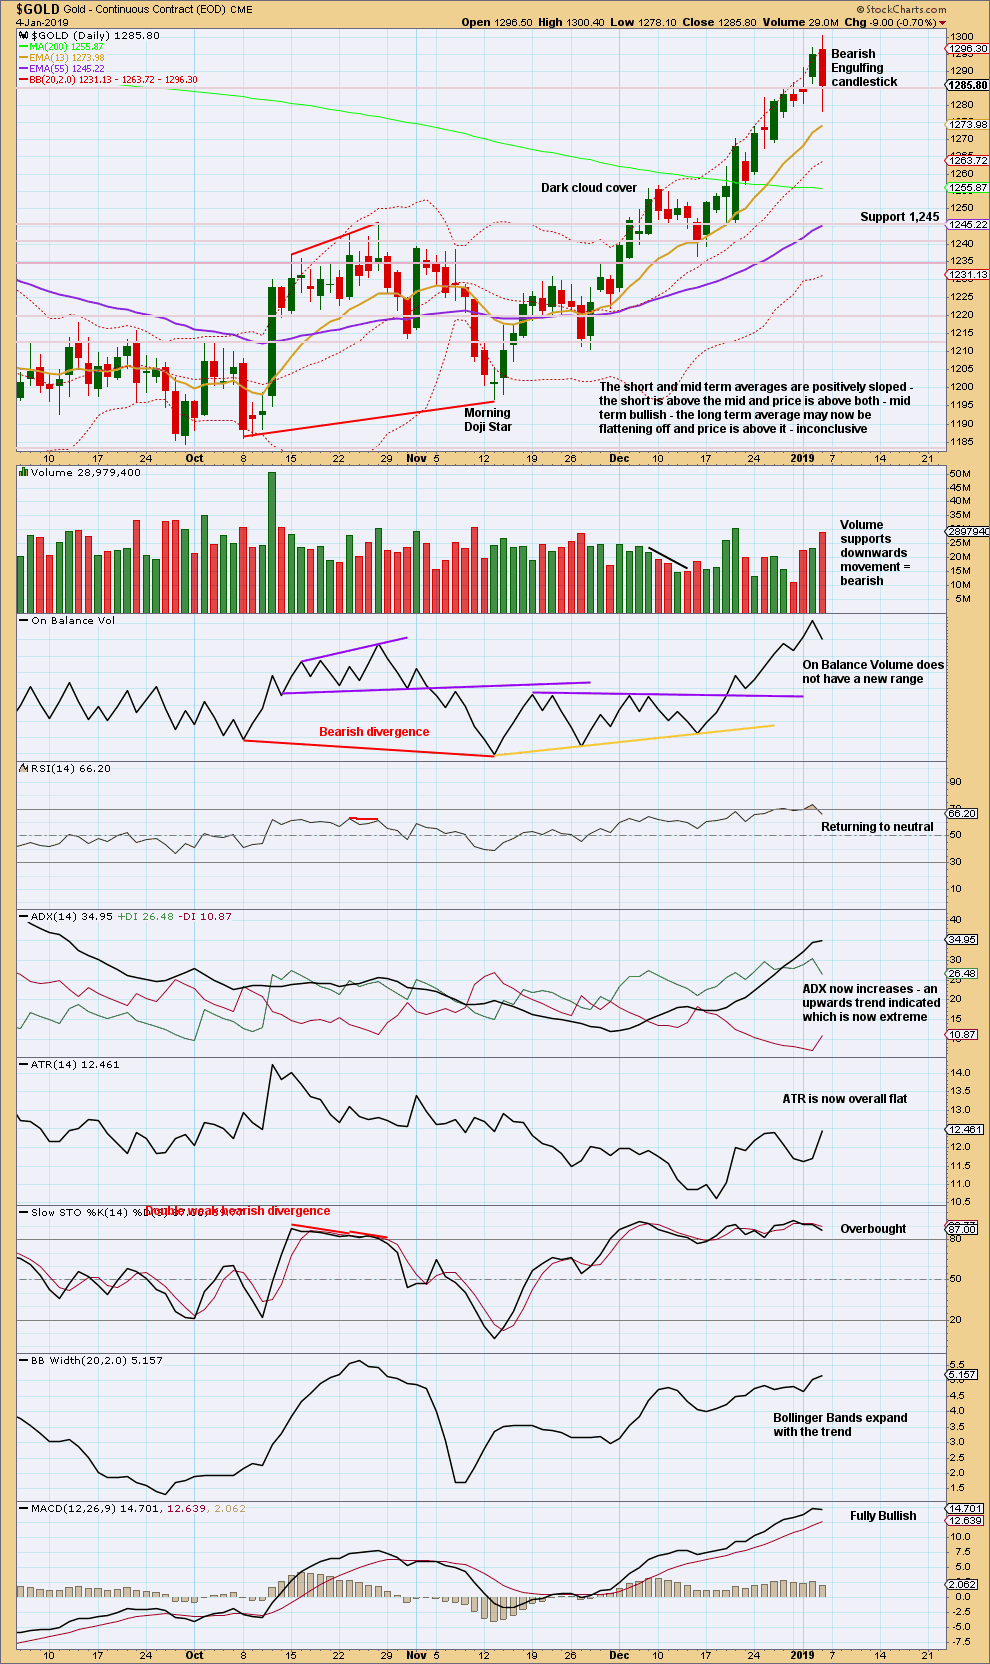
Click chart to enlarge. Chart courtesy of StockCharts.com.
The Bearish Engulfing reversal pattern has support from volume. After ADX reached extreme, this now signals an end to the upwards trend and either a reversal or a sideways consolidation.
GDX WEEKLY CHART
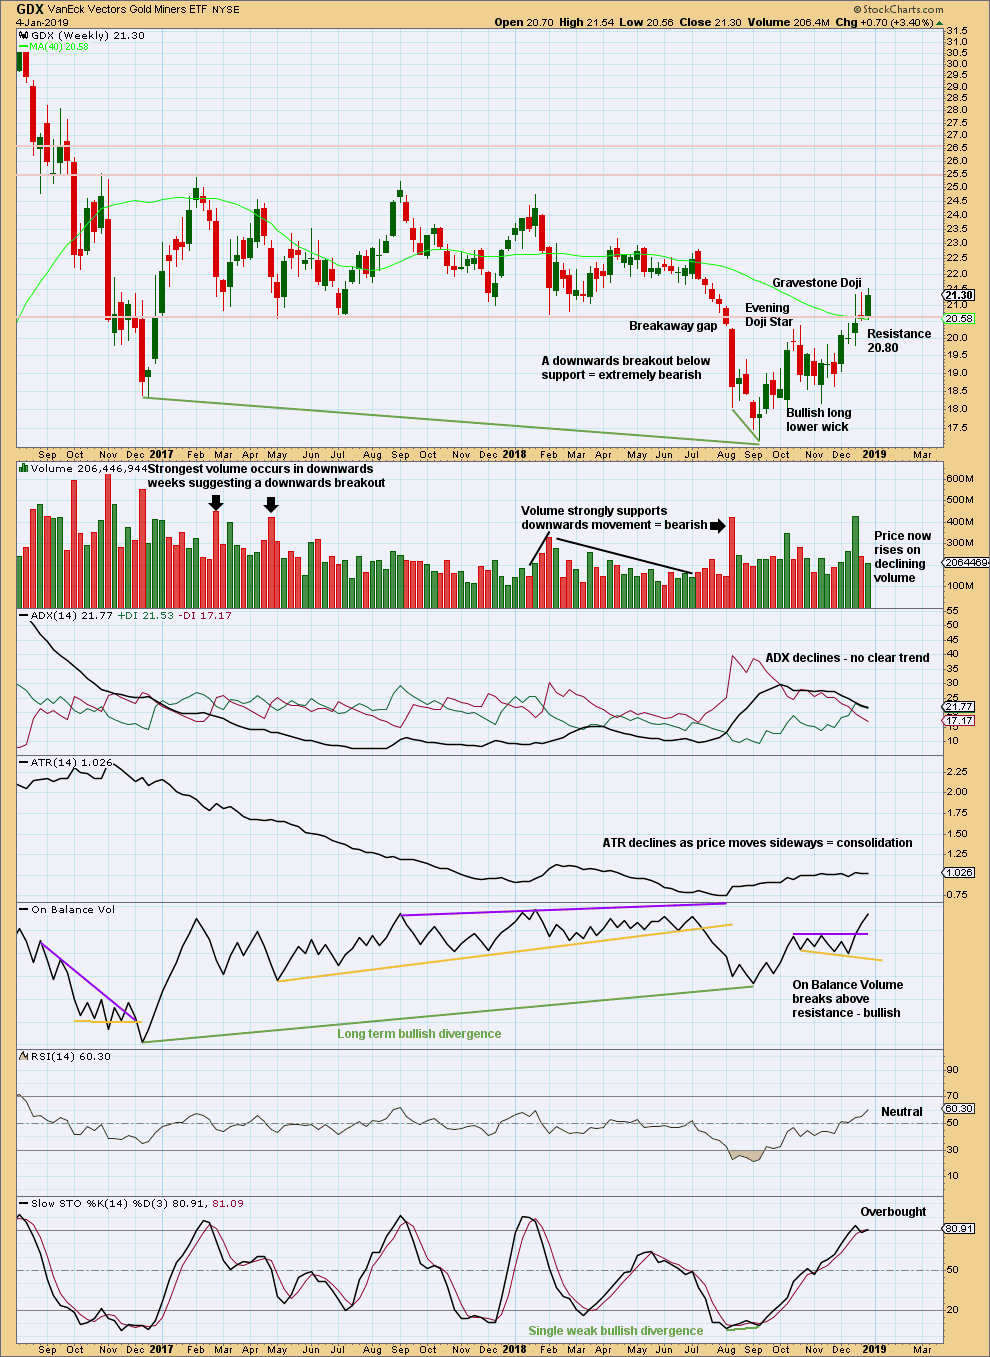
Click chart to enlarge. Chart courtesy of StockCharts.com.
The Gravestone Doji for last week’s candlestick has failed to signal a high. Price has moved a little higher, but the Gravestone Doji may still be a warning of a final high coming very soon.
GDX DAILY CHART
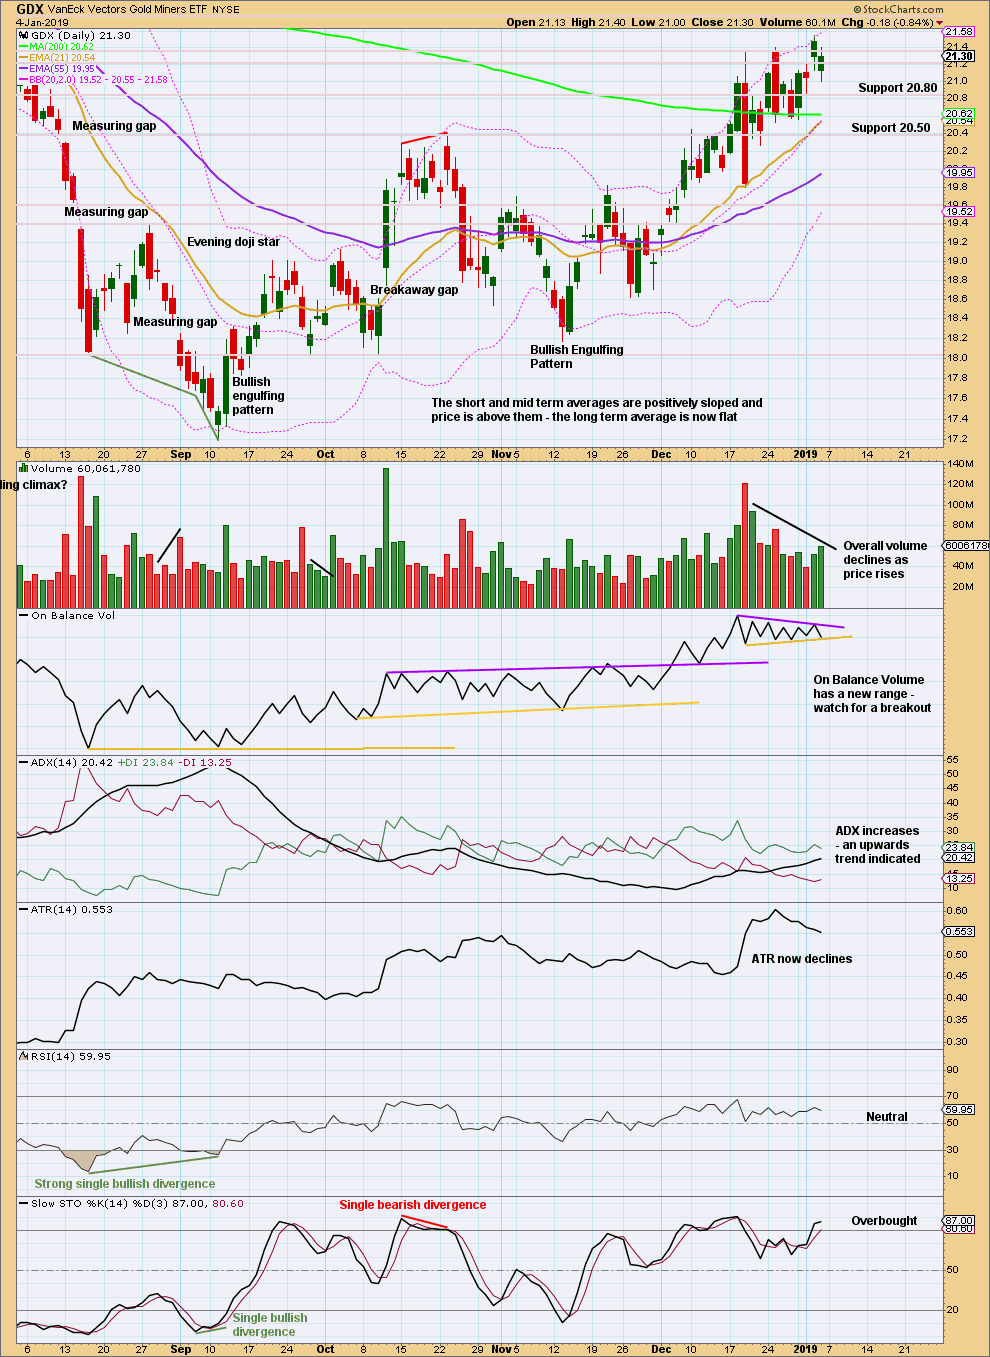
Click chart to enlarge. Chart courtesy of StockCharts.com.
The last two Bearish Engulfing patterns have not come at a high. Price continues higher. There is some weakness with declining volume and ATR.
Published @ 8:08 p.m. EST.
—
Careful risk management protects your trading account(s).
Follow my two Golden Rules:
1. Always trade with stops.
2. Risk only 1-5% of equity on any one trade.
Hourly chart for the triangle count updated:
Just in case any members are wondering, both weekly charts would have the same hourly chart at this stage. Because both weekly wave counts see a zigzag unfolding higher; the triangle wave count sees primary wave E zigzag unfolding higher, and the double zigzag count sees intermediate wave (D) zigzag unfolding higher.
So the hourly charts would be essentially the same, only the degree of labelling would be different.
So only one hourly chart is needed to count all the little subdivisions as this zigzag unfolds higher.
Minor wave 4 looks to be underway, and it’s still not possible to tell what Elliott wave structure it will unfold as. It’s not quite time yet to produce alternate hourly charts, that may be coming towards the end of this week.
For now, a zigzag unfolding lower will be expected as most likely. This would be incomplete. It is labelled minute wave a or w on this chart.