

S&P 500
Analysis has expected upwards movement, which has continued all week.
Today’s analysis looks at measures of internal strength of the market to determine if this bounce should continue or if it could be complete.
Summary: For the short term, now expect more upwards movement as most likely. This may be the dominant view while price remains above 2,562.02.
A new low below 2,562.02 would indicate a deeper pullback may continue towards 2,537.50.
The bigger picture still expects that a low may now be in place. Confidence in this view may be had if price makes a new high above 2,631.09. The target is at 3,045 with a limit at 3,477.39. This primary view has support from strongly rising market breadth and a 90% up day on the 4th of January.
The alternate wave count expects one more low before cycle wave IV is complete. Targets are either 2,269 or 2,242 – 2,240, although when intermediate wave (4) may be complete the target would be recalculated.
The biggest picture, Grand Super Cycle analysis, is here.
The monthly chart was last published here.
MAIN ELLIOTT WAVE COUNT
WEEKLY CHART
Click chart to enlarge.
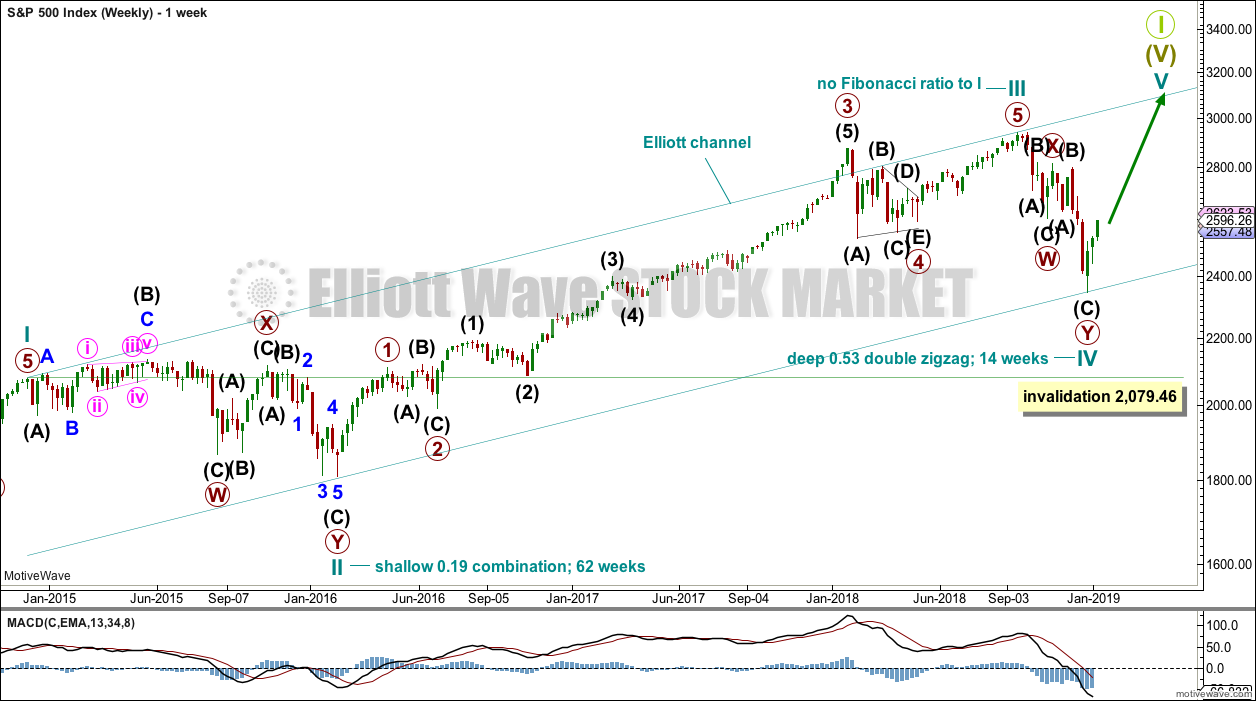
This weekly chart shows all of cycle waves II, III and IV so far.
Cycle wave II fits as a time consuming double combination: flat – X – zigzag. Combinations tend to be more time consuming corrective structures than zigzags. If cycle wave IV completes as a single or multiple zigzag, then it should be expected to be more brief than cycle wave II.
Cycle wave IV may have ended at the lower edge of the Elliott channel. Fourth waves are not always contained within Elliott channels. If the alternate daily wave count below is correct, then cycle wave IV may breach this channel.
Cycle wave IV may not move into cycle wave I price territory below 2,079.46.
Although both cycle waves II and IV are labelled W-X-Y, they are different corrective structures. There are two broad groups of Elliott wave corrective structures: the zigzag family, which are sharp corrections, and all the rest, which are sideways corrections. Multiple zigzags belong to the zigzag family and combinations belong to the sideways family. There is perfect alternation between the possible double zigzag of cycle wave IV and the combination of cycle wave II.
Although there is gross disproportion between the duration of cycle waves II and IV, the size of cycle wave IV in terms of price makes these two corrections look like they should be labelled at the same degree. Proportion is a function of either or both of price and time.
Draw the Elliott channel about Super Cycle wave (V) as shown. Cycle wave V may find resistance about the upper edge.
DAILY CHART
Click chart to enlarge.
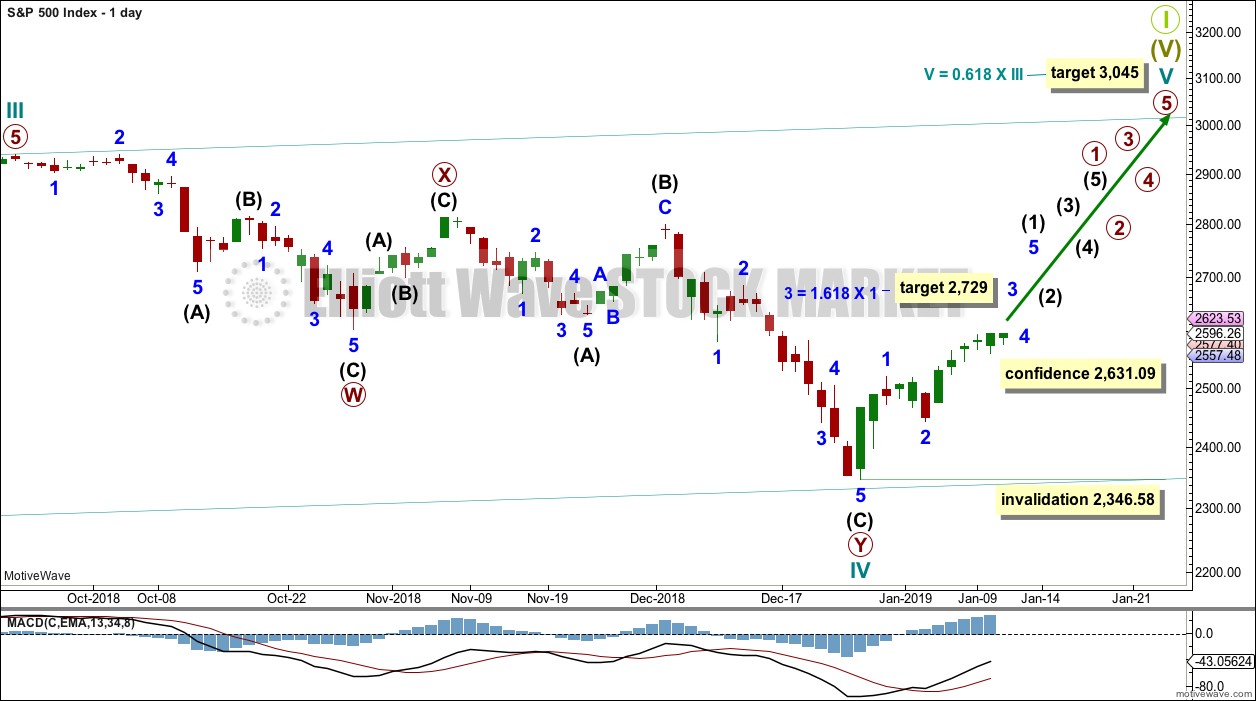
The daily chart will focus on the structure of cycle wave IV.
Cycle wave IV may be a complete double zigzag. This would provide perfect alternation with the combination of cycle wave II. Double zigzags are fairly common corrective structures.
Within Super Cycle wave (V), cycle wave III may not be the shortest actionary wave. Because cycle wave III is shorter than cycle wave I, this limits cycle wave V to no longer than equality in length with cycle wave III at 3,477.39. A target is calculated for cycle wave V to end prior to this point.
Cycle wave V must subdivide as a five wave motive structure, either an impulse or an ending diagonal. An impulse is much more common and that will be how it is labelled. A diagonal would be considered if overlapping suggests it.
Within the five wave structure for cycle wave V, primary wave 1 would be incomplete. Within primary wave 1, intermediate wave (1) may be incomplete. The degree of labelling within cycle wave V may need to be adjusted as it unfolds further.
Within cycle wave V, no second wave correction may move beyond the start of its first wave below 2,346.58.
At this stage, a new high by any amount at any time frame above 2,631.09 would invalidate the alternate wave count below and provide confidence in this main wave count.
ALTERNATE DAILY CHART
Click chart to enlarge.
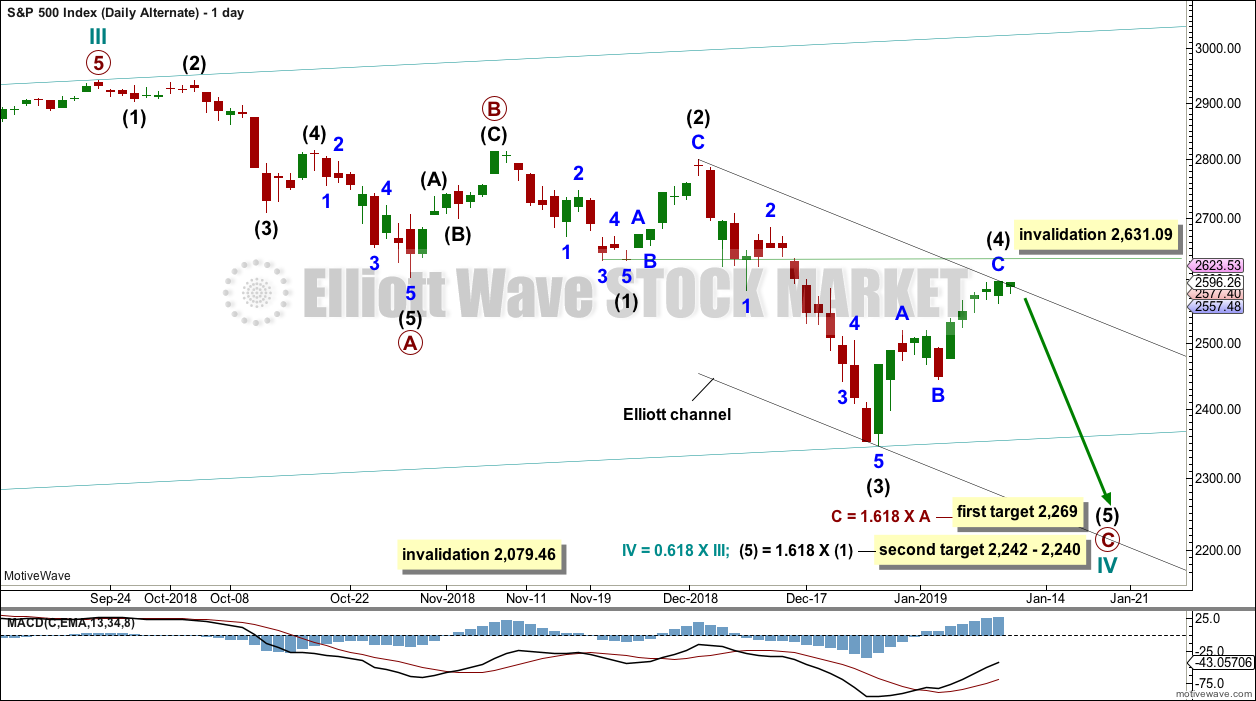
Cycle wave IV may be a an incomplete single zigzag. This would provide perfect alternation with the combination of cycle wave II. Zigzags are the most common corrective structures.
Within this zigzag, primary wave C may be completing as a five wave impulse.
Intermediate wave (2) shows up on the weekly and daily charts. Intermediate wave (4) now also shows on weekly and daily charts. This wave count has the right look.
Intermediate wave (4) may not move into intermediate wave (1) price territory above 2,631.09.
Targets are calculated for cycle wave IV to end. If price gets to the first target and the structure is incomplete, or if price falls through the first target, then the second target may be used.
Redraw the channel about primary wave C using Elliott’s second technique. Draw the first trend line from the high of intermediate wave (2) to the high of intermediate wave (4), then place a parallel copy on the low of intermediate wave (3). If intermediate wave (4) continues higher, then redraw the channel using the same technique. The lower edge may then provide support for intermediate wave (5).
TECHNICAL ANALYSIS
WEEKLY CHART
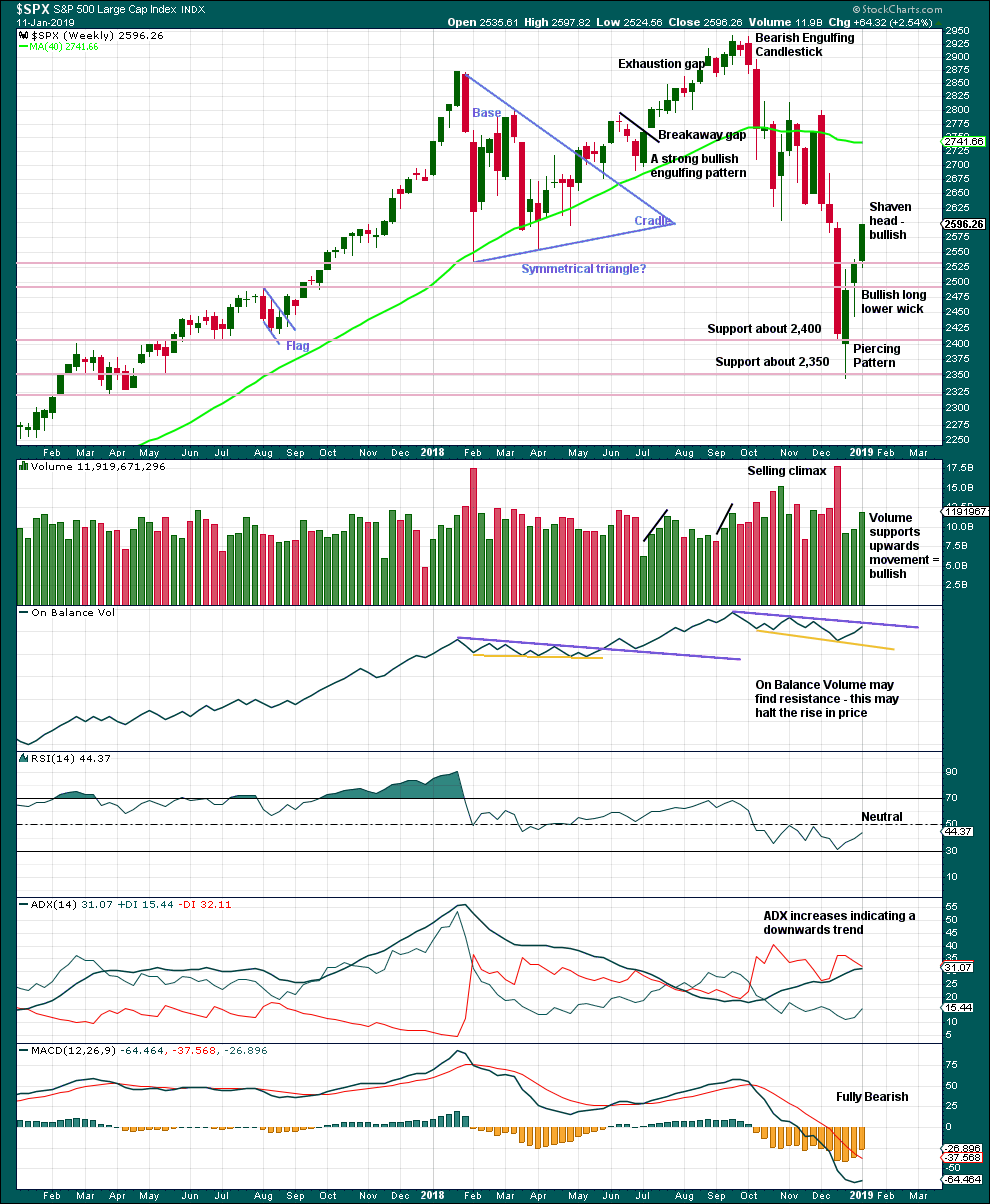
Click chart to enlarge. Chart courtesy of StockCharts.com.
From the all time high to the low of last week, price moved lower by 20.2% of market value meeting the definition for a bear market.
It should be noted that the large fall in price from May 2011 to October 2011 also met this definition of a bear market, yet it was only a very large pullback within a bull market, which so far has lasted almost 10 years.
This weekly candlestick with a shaven head and good support from volume strongly suggests more upwards movement next week.
DAILY CHART
Click chart to enlarge. Chart courtesy of StockCharts.com.
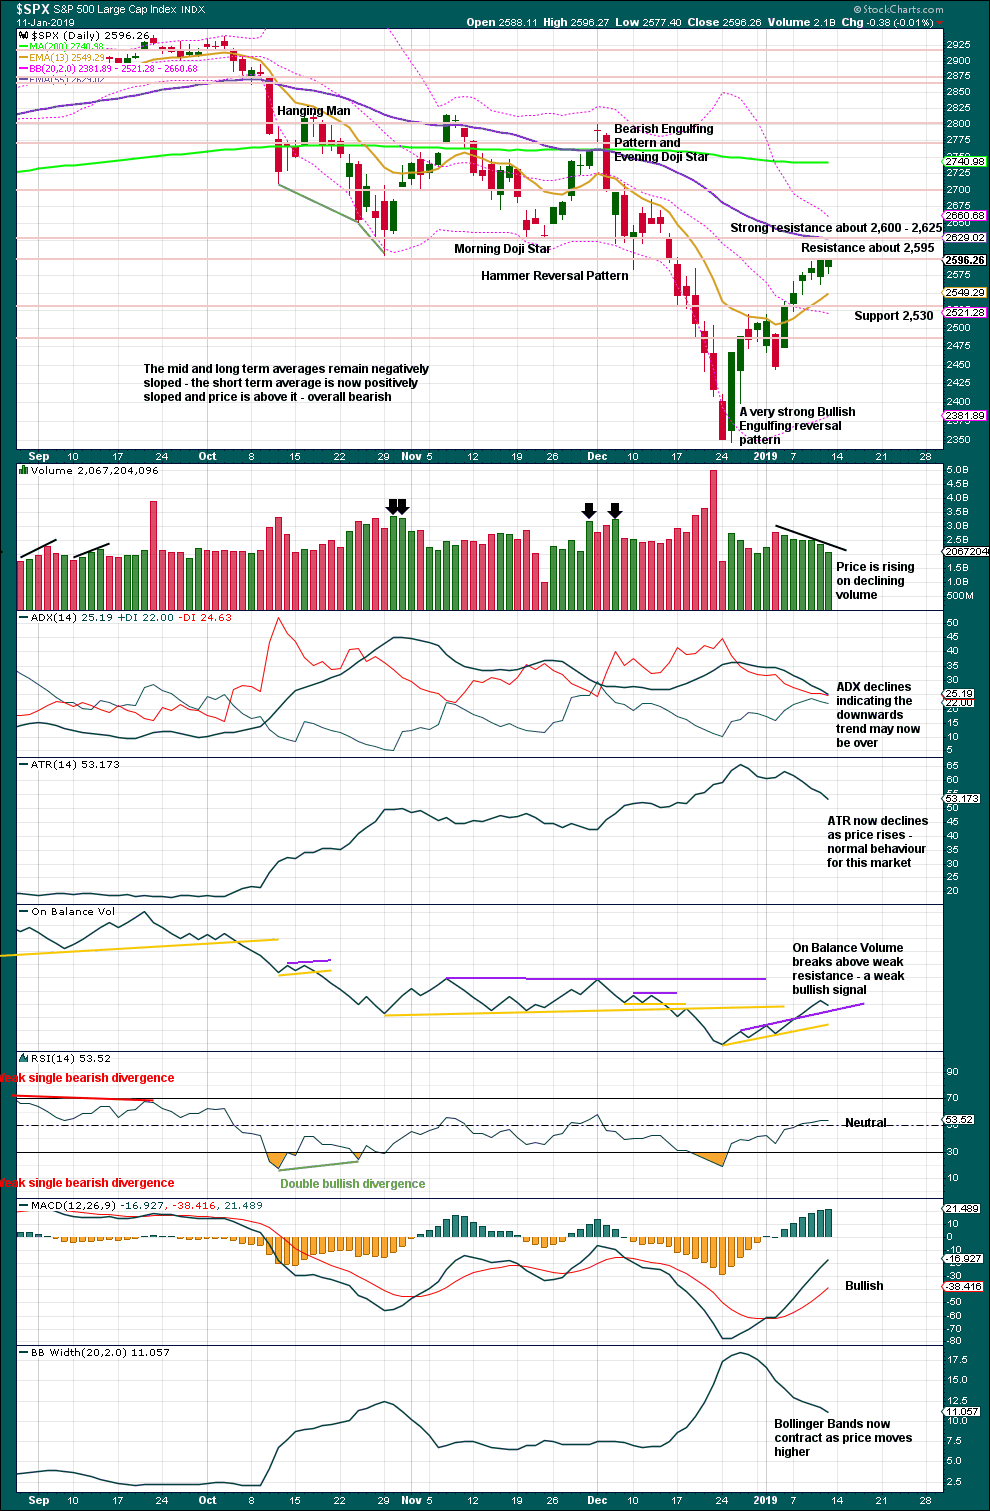
Over a fairly long period of time this ageing bull market has been characterised by upwards movement on light and declining volume and low ATR. For the short to mid term, little concern may be had if price now rises again on declining volume. Current market conditions have allowed for this during a sustained rise in price.
It is also normal for this market to have lower ATR during bullish phases, and strongly increasing ATR during bearish phases. Currently, declining ATR is normal and not of a concern.
Considering the larger picture from the Elliott wave count, some weakness approaching the end of Grand Super Cycle wave I is to be expected.
From Kirkpatrick and Dhalquist, “Technical Analysis” page 152:
“A 90% downside day occurs when on a particular day, the percentage of downside volume exceeds the total of upside and downside volume by 90% and the percentage of downside points exceeds the total of gained points and lost points by 90%. A 90% upside day occurs when both the upside volume and points gained are 90% of their respective totals”…
and “A major reversal is singled when an NPDD is followed by a 90% upside day or two 80% upside days back-to-back”.
The current situation saw two 80% downside days on December 20th and 21st, then a near 90% downside day with 88.97% downside on December 24th. This very heavy selling pressure on three sessions very close together may be sufficient to exhibit the pressure observed in a 90% downside day.
This has now been followed by two 90% upside days: on December 26th and again on 4th January.
The current situation looks very much like a major low has been found.
BREADTH – AD LINE
WEEKLY CHART
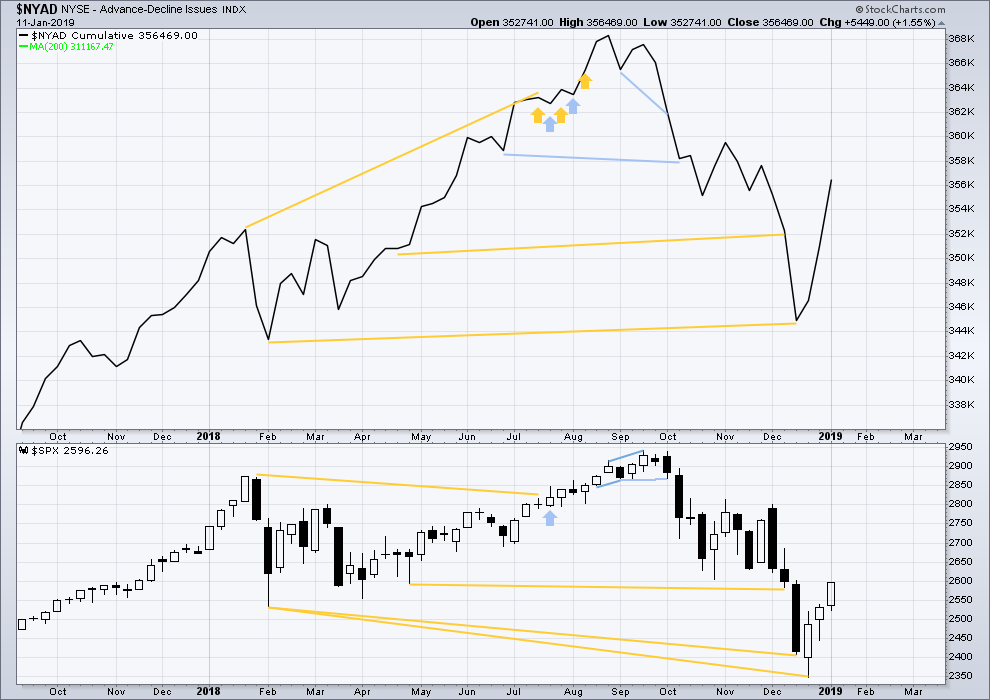
Click chart to enlarge. Chart courtesy of StockCharts.com. So that colour blind members are included, bearish signals
will be noted with blue and bullish signals with yellow.
Upwards movement has support from rising market breadth.
DAILY CHART
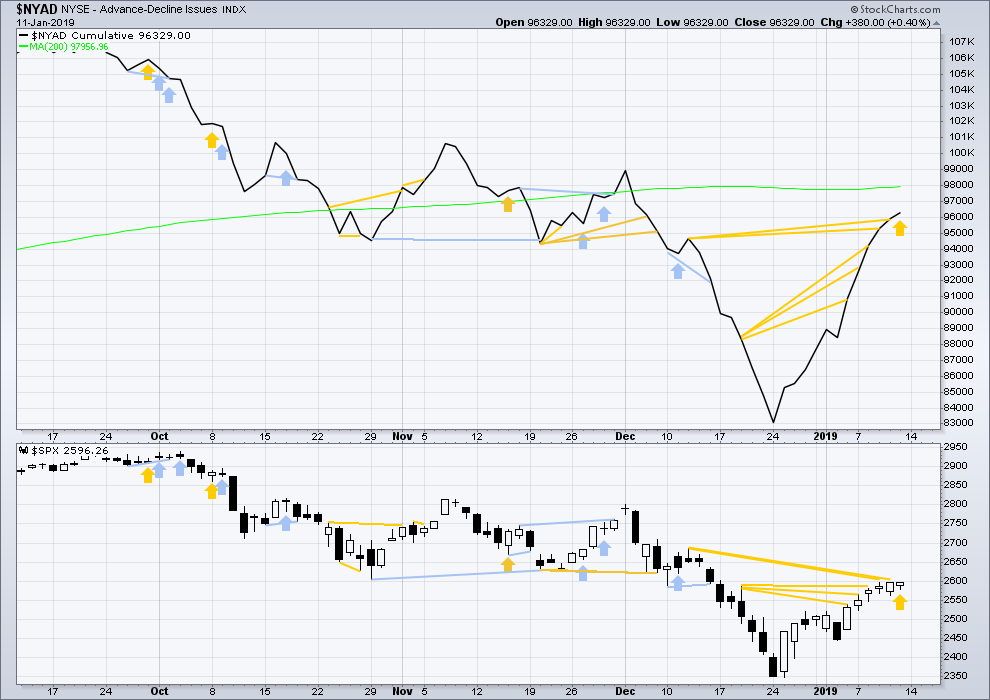
Click chart to enlarge. Chart courtesy of StockCharts.com. So that colour blind members are included, bearish signals
will be noted with blue and bullish signals with yellow.
Breadth should be read as a leading indicator.
Bullish divergence continues on Friday. The AD line has moved higher although price did not quite make a new high. The AD line is rising faster than price. This upwards movement has support from underlying rising market breadth.
Both mid and small caps have made new highs on Friday.
VOLATILITY – INVERTED VIX CHART
WEEKLY CHART
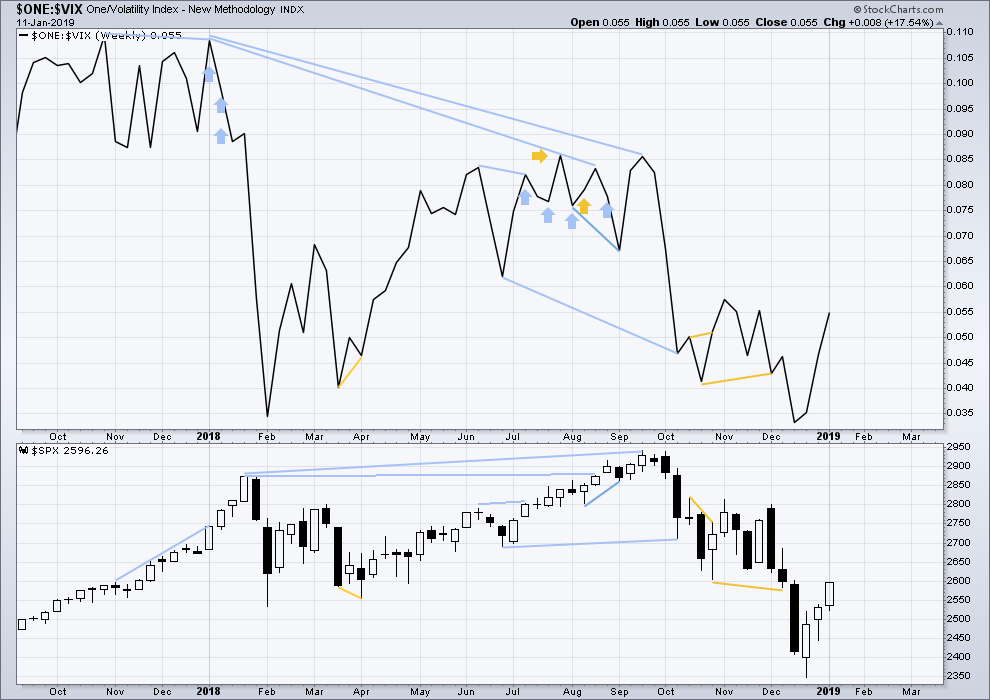
Click chart to enlarge. Chart courtesy of StockCharts.com. So that colour blind members are included, bearish signals
will be noted with blue and bullish signals with yellow.
Upwards movement has support from a corresponding decline in VIX. There is no divergence.
DAILY CHART
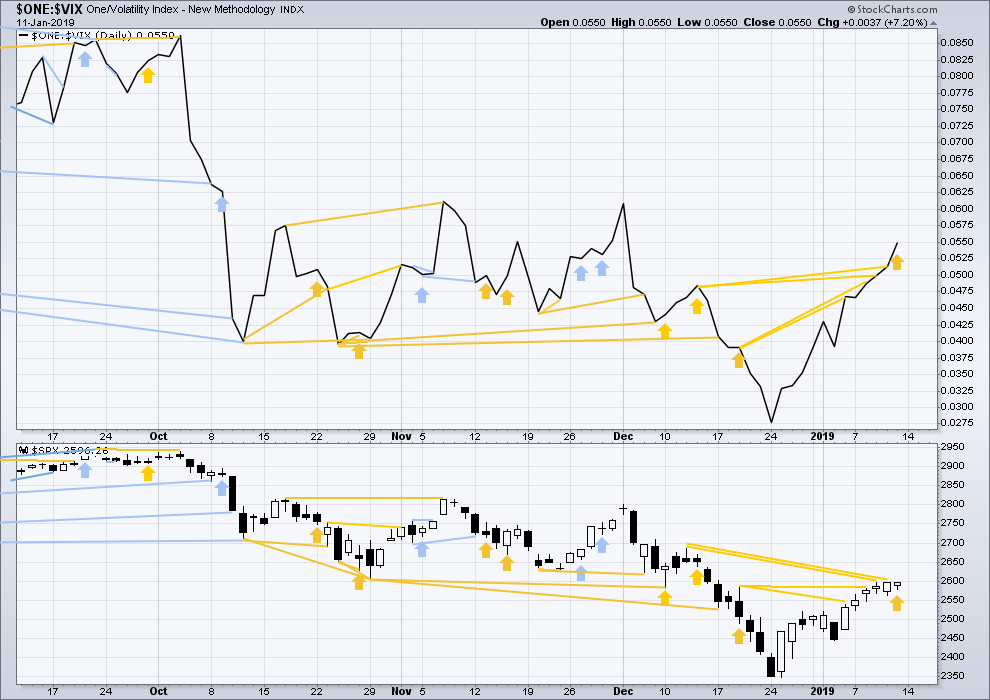
Click chart to enlarge. Chart courtesy of StockCharts.com. So that colour blind members are included, bearish signals
will be noted with blue and bullish signals with yellow.
Inverted VIX moved strongly higher on Friday, but price did not quite make a new high. This is another instance of bullish divergence; volatility is declining faster than price is rising.
DOW THEORY
Dow Theory confirms a bear market. This does not necessarily mean a bear market at Grand Super Cycle degree though; Dow Theory makes no comment on Elliott wave counts. On the 25th of August 2015 Dow Theory also confirmed a bear market. The Elliott wave count sees that as part of cycle wave II. After Dow Theory confirmation of a bear market in August 2015, price went on to make new all time highs and the bull market continued.
DJIA: 23,344.52 – a close on the 19th of December at 23,284.97 confirms a bear market.
DJT: 9,806.79 – price has closed below this point on the 13th of December.
S&P500: 2,532.69 – a close on the 19th of December at 2,506.96 provides support to a bear market conclusion.
Nasdaq: 6,630.67 – a close on the 19th of December at 6,618.86 provides support to a bear market conclusion.
GOLD
Sideways movement for this week has continued exactly as expected from the Elliott wave count and classic technical analysis. The short-term structure is analysed this week to determine if the correction may be complete or not.
Summary: A sideways consolidation is now expected for a fourth wave to continue for another one to two weeks. It may be very shallow, with support about 1,277 and resistance about 1,297.
At this stage, a complete corrective structure cannot be seen, and it is expected that minor wave 4 should continue further sideways to have better proportion to minor wave 2.
The final target for this bounce to end is about 1,305 – 1,310.
Grand SuperCycle analysis is here.
Last historic analysis with monthly charts is here.
Only two remaining wave counts have a reasonable probability and are published below: a triangle (the preferred wave count) and a double zigzag. The combination wave count is discarded this week based upon a very low probability.
MAIN ELLIOTT WAVE COUNT
WEEKLY CHART – TRIANGLE
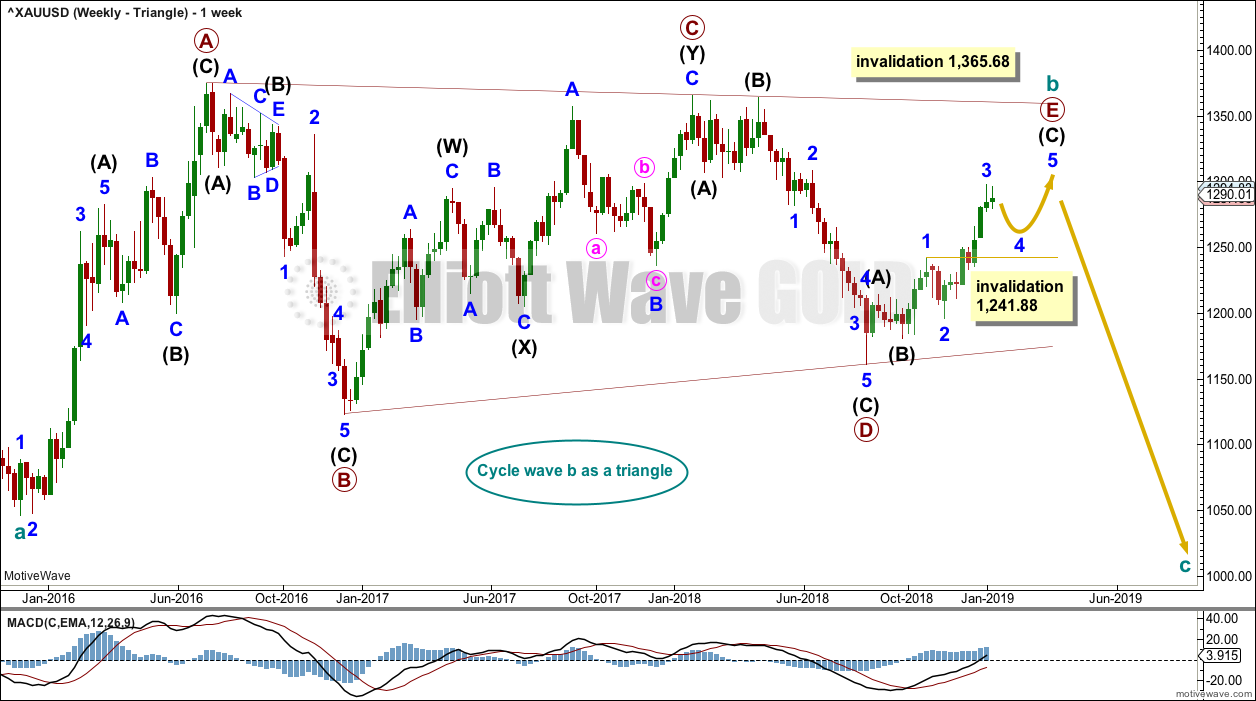
Click chart to enlarge.
Cycle wave b may be an incomplete regular contracting triangle. Primary wave E may not move beyond the end of primary wave C above 1,365.68.
Within primary wave E, intermediate waves (A) and (B) may be complete. Intermediate wave (C) must subdivide as a five wave structure. Within intermediate wave (C), minor wave 4 may not move into minor wave 1 price territory below 1,241.88.
Four of the five sub-waves of a triangle must be zigzags, with only one sub-wave allowed to be a multiple zigzag. Wave C is the most common sub-wave to subdivide as a multiple, and this is how primary wave C for this example fits best. Primary wave E would most likely be a single zigzag. It is also possible that it may subdivide as a triangle to create a rare nine wave triangle.
There are no problems in terms of subdivisions or rare structures for this wave count. It has an excellent fit and so far a typical look.
When primary wave E is a complete three wave structure, then this wave count would expect a cycle degree trend change. Cycle wave c would most likely make new lows below the end of cycle wave a at 1,046.27 to avoid a truncation.
It is possible now that primary wave E may end in January or February 2019. Some reasonable weakness should be expected at its end. Triangles often end with declining ATR, weak momentum and weak volume.
DAILY CHART – TRIANGLE
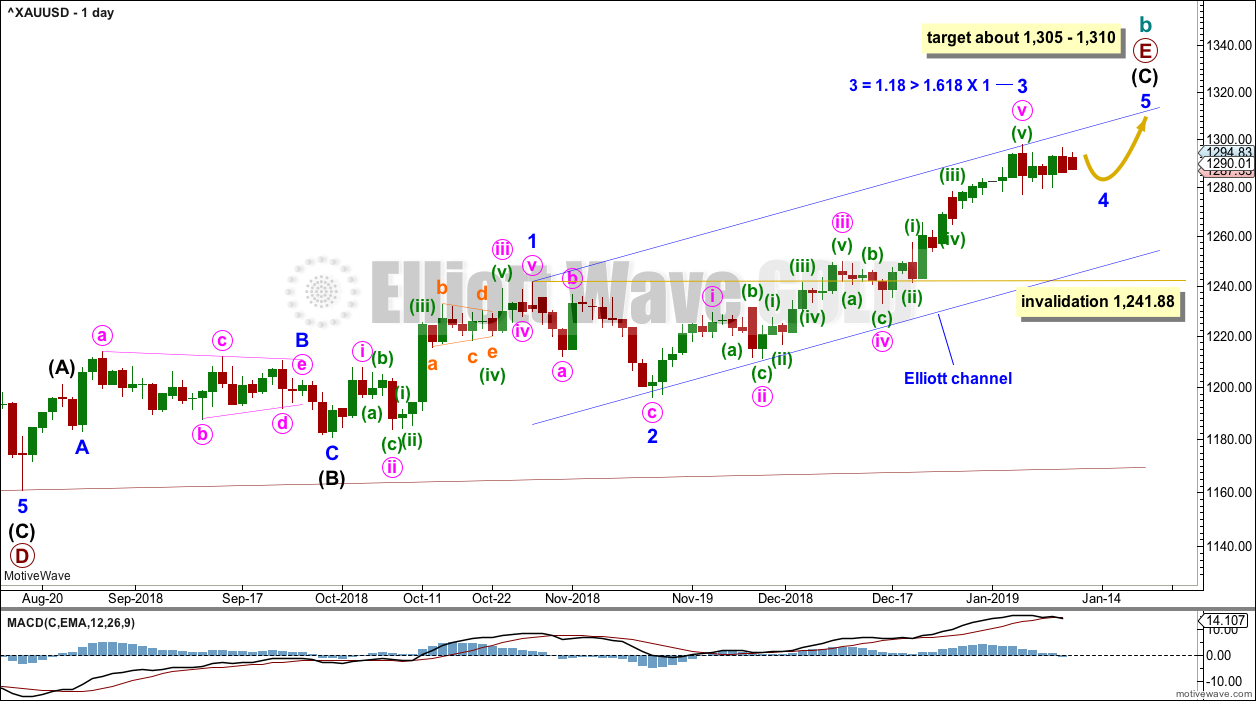
Click chart to enlarge.
Primary wave E may now be nearing its final stages for this wave count.
Primary wave E should subdivide as a zigzag. Intermediate waves (A) and (B) may now be complete. Intermediate wave (C) may now be nearing completion.
Minor wave 2 is a deep 0.75 zigzag. Minor wave 4 may be expected to most likely be a shallow sideways flat, triangle or combination.
Minor wave 3 exhibits the most common Fibonacci ratio to minor wave 1.
Minor wave 4 may not move into minor wave 1 price territory below 1,241.88.
A target for primary wave E is the strong zone of resistance about 1,305 to 1,310. Primary wave E is most likely to subdivide as a zigzag (although it may also subdivide as a triangle to create a rare nine wave triangle). It may last a total Fibonacci 21 or 34 weeks. So far it has lasted 20 weeks. Primary wave E may not move beyond the end of primary wave C above 1,365.68.
WEEKLY CHART – DOUBLE ZIGZAG
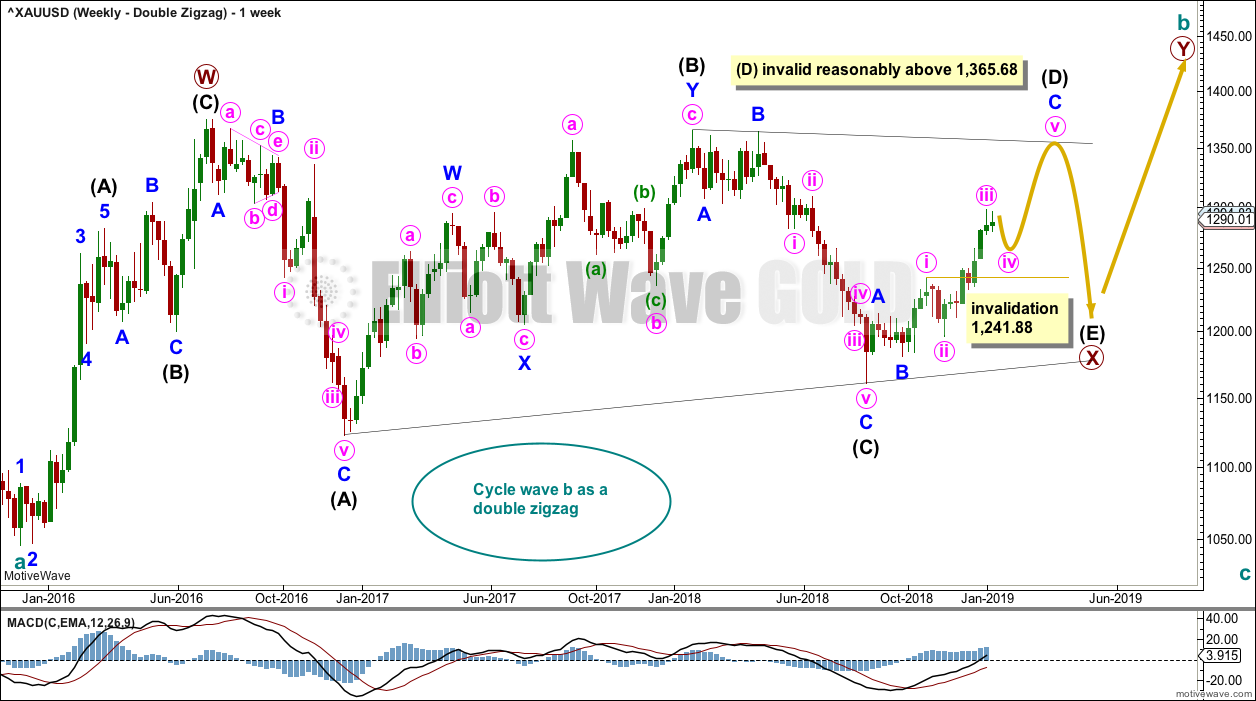
Click chart to enlarge.
It is possible that cycle wave b may be a double zigzag or a double combination.
The first zigzag in the double is labelled primary wave W. This has a good fit.
The double may be joined by a corrective structure in the opposite direction, a triangle labelled primary wave X. The triangle would be about three quarters complete.
Within the triangle of primary wave X, intermediate wave (C) should be complete. Within intermediate wave (D), minor waves A and B may be complete. Minor wave C must subdivide as a five wave structure. Within minor wave C, minute wave iv may not move into minute wave i price territory below 1,241.88.
Intermediate wave (D) would most likely subdivide as a single zigzag.
This wave count may now expect choppy overlapping movement in an ever decreasing range for several more months.
Primary wave Y would most likely be a zigzag because primary wave X would be shallow; double zigzags normally have relatively shallow X waves.
Primary wave Y may also be a flat correction if cycle wave b is a double combination, but combinations normally have deep X waves. This would be less likely.
This wave count has good proportions and no problems in terms of subdivisions.
TECHNICAL ANALYSIS
WEEKLY CHART
Click chart to enlarge. Chart courtesy of StockCharts.com.
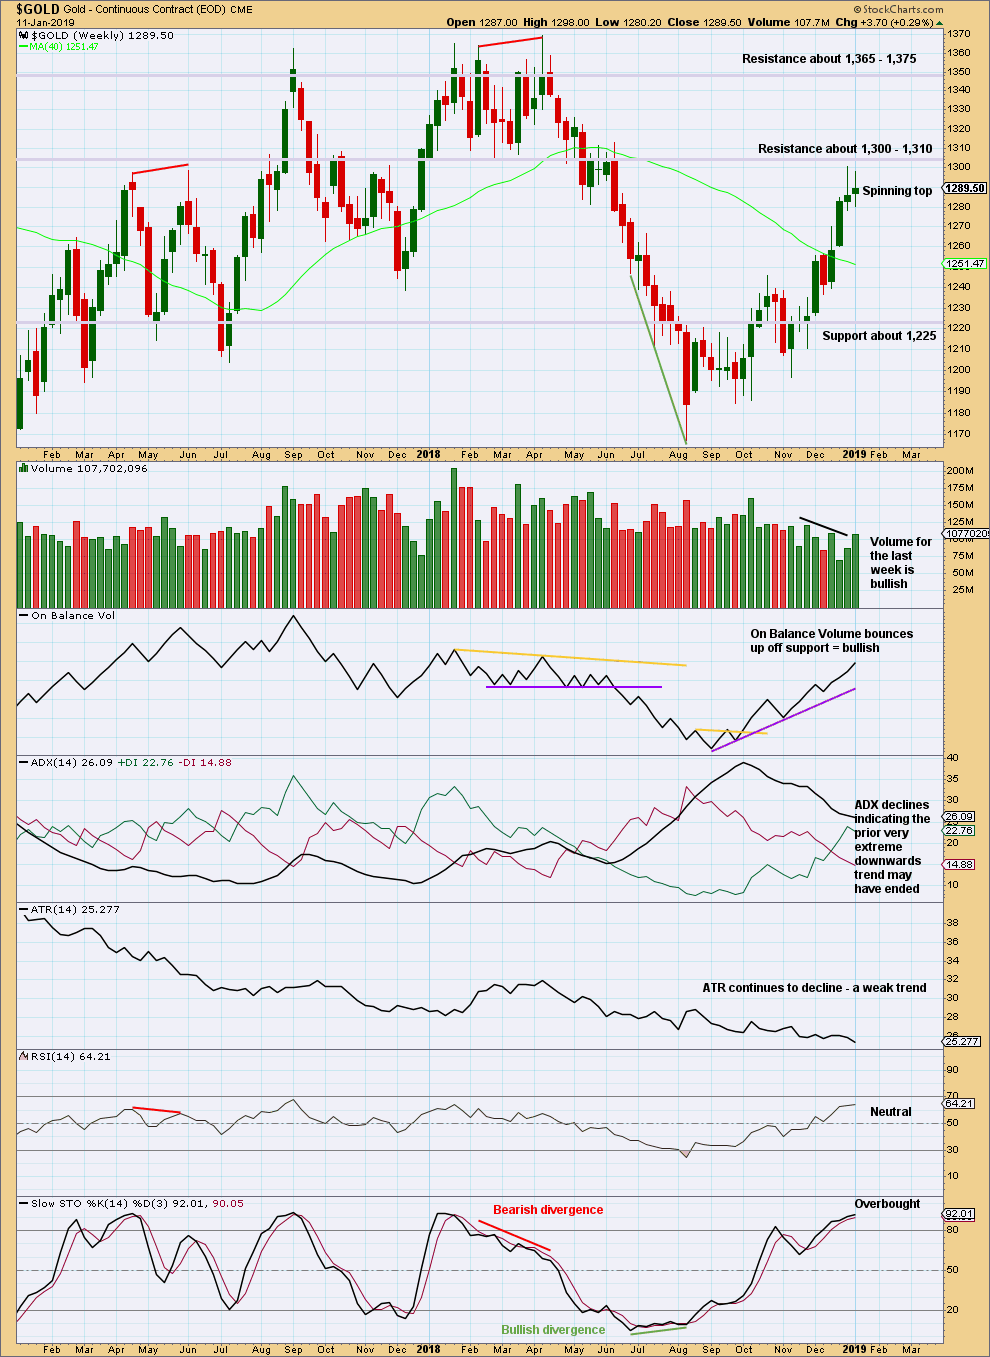
The spinning top candlestick pattern is not a reversal pattern. This puts the short-term trend from up to neutral.
Volume for the last two weeks supports upwards movement. ADX indicates a potential trend change to upwards, but as yet it does not indicate a new trend at this time frame.
DAILY CHART
Click chart to enlarge. Chart courtesy of StockCharts.com.
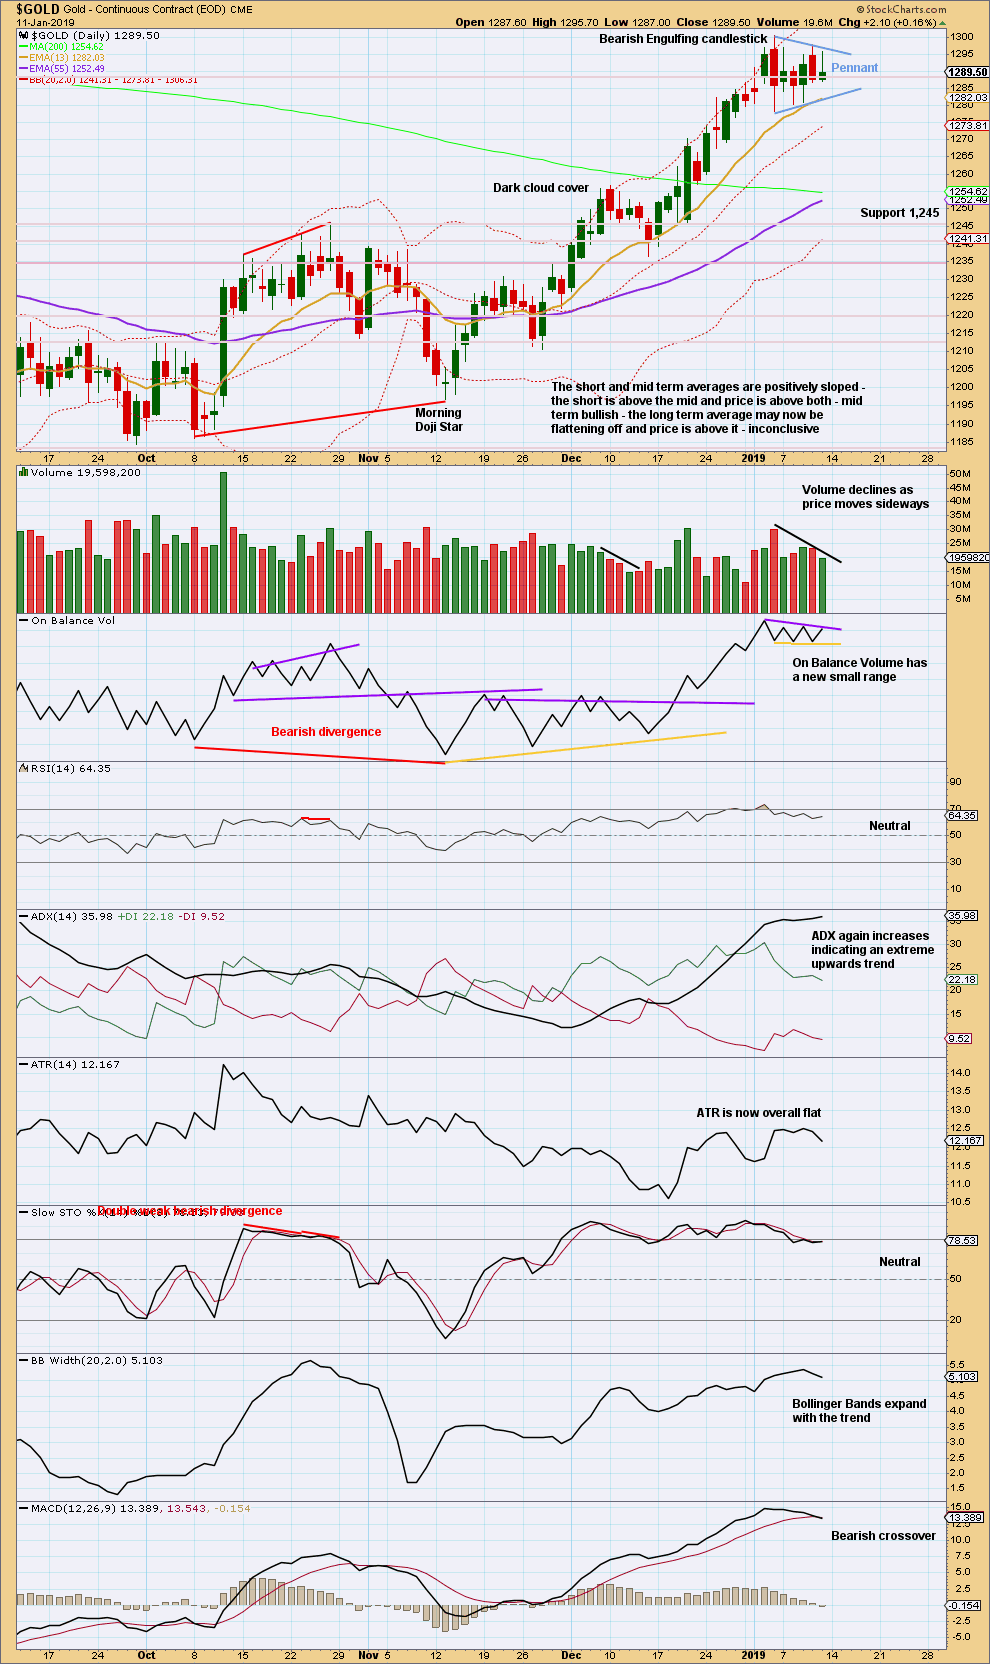
The Bearish Engulfing reversal pattern has support from volume. After ADX reached extreme, this now signals an end to the upwards trend and either a reversal or a sideways consolidation.
Although ADX again indicates today that an upwards trend may be in place, more weight will be given to the candlestick reversal pattern because ADX remains extreme.
A small pennant pattern may be forming. These are reliable continuation patterns. The target using the flag pole beginning at 1,236.50 on the 14th of December 2018 would be about 1,360. This is substantially higher than the Elliott wave count suggests; this target may be too optimistic.
GDX WEEKLY CHART
Click chart to enlarge. Chart courtesy of StockCharts.com.
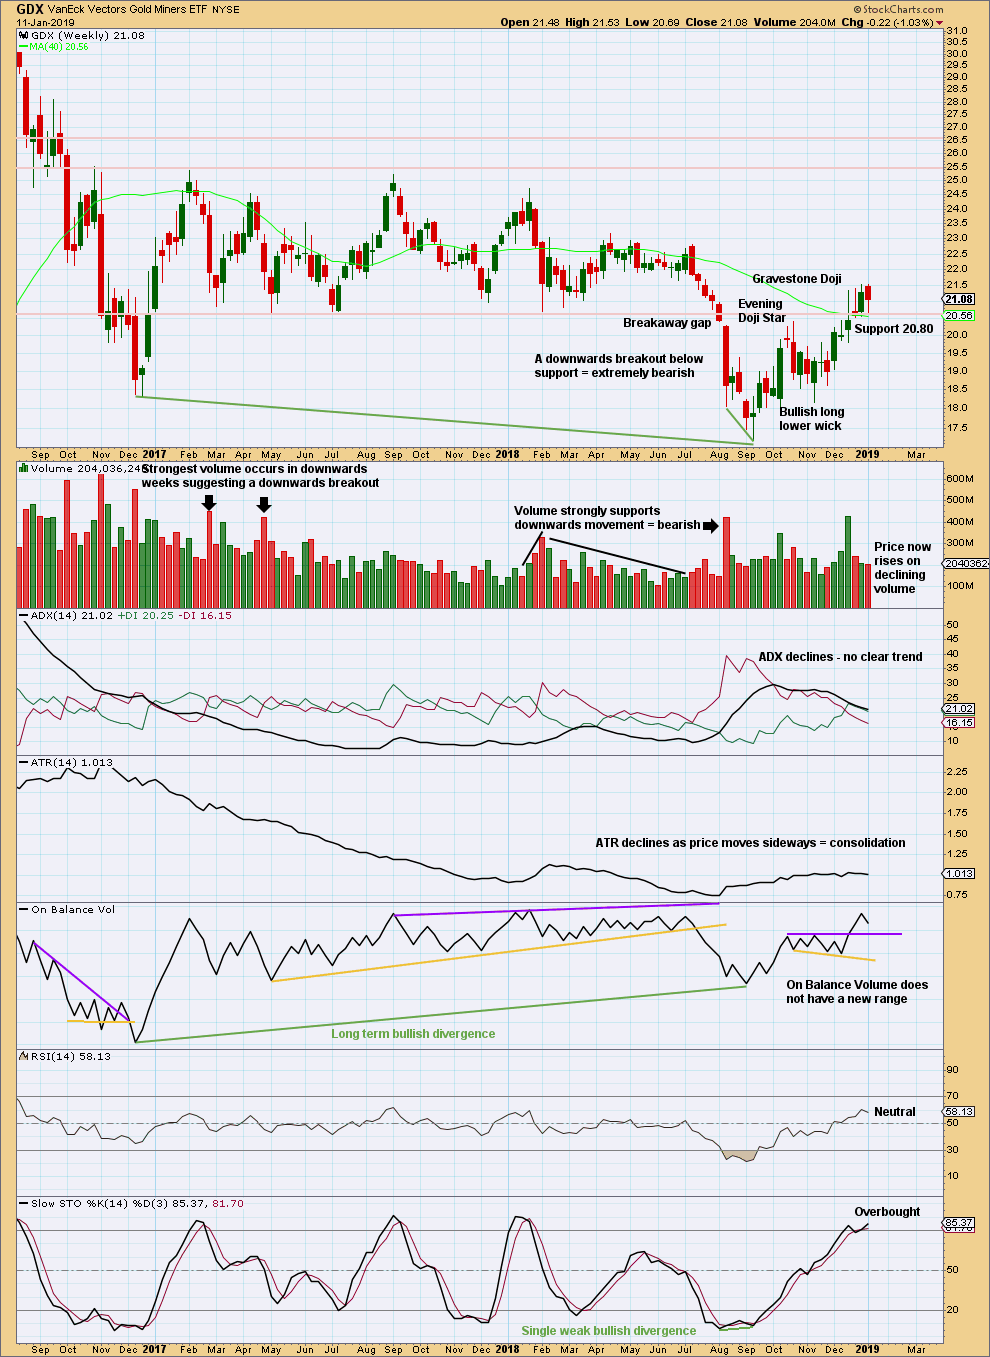
GDX is now firmly back within a prior consolidation zone. Strong support may be expected again about 20.80.
GDX DAILY CHART
Click chart to enlarge. Chart courtesy of StockCharts.com.
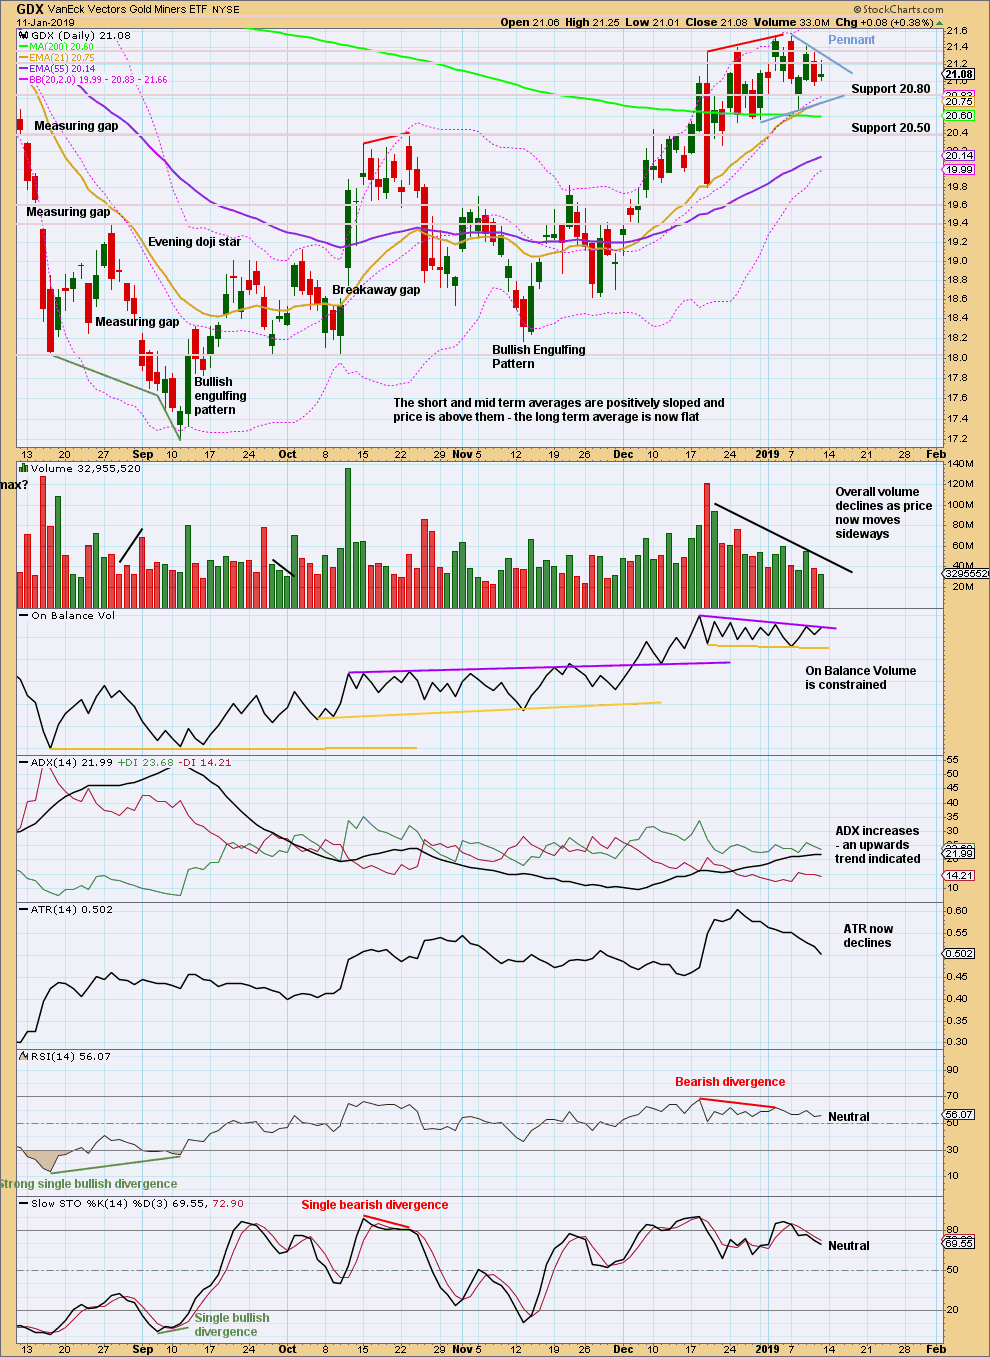
A small pennant pattern may be unfolding. The target using the flag pole beginning at 19.80 on the 19th of December 2018 is about 22.90.
US OIL
A bounce or sideways correction was expected to continue for the last week. An upwards week exactly fits this expectation. The target remains the same.
Summary: A bounce is expected to continue. The target is about 63.71.
The larger picture still sees Oil in a new downwards trend to end reasonably below 26.06.
MAIN ELLIOTT WAVE COUNT
MONTHLY CHART
Click chart to enlarge.
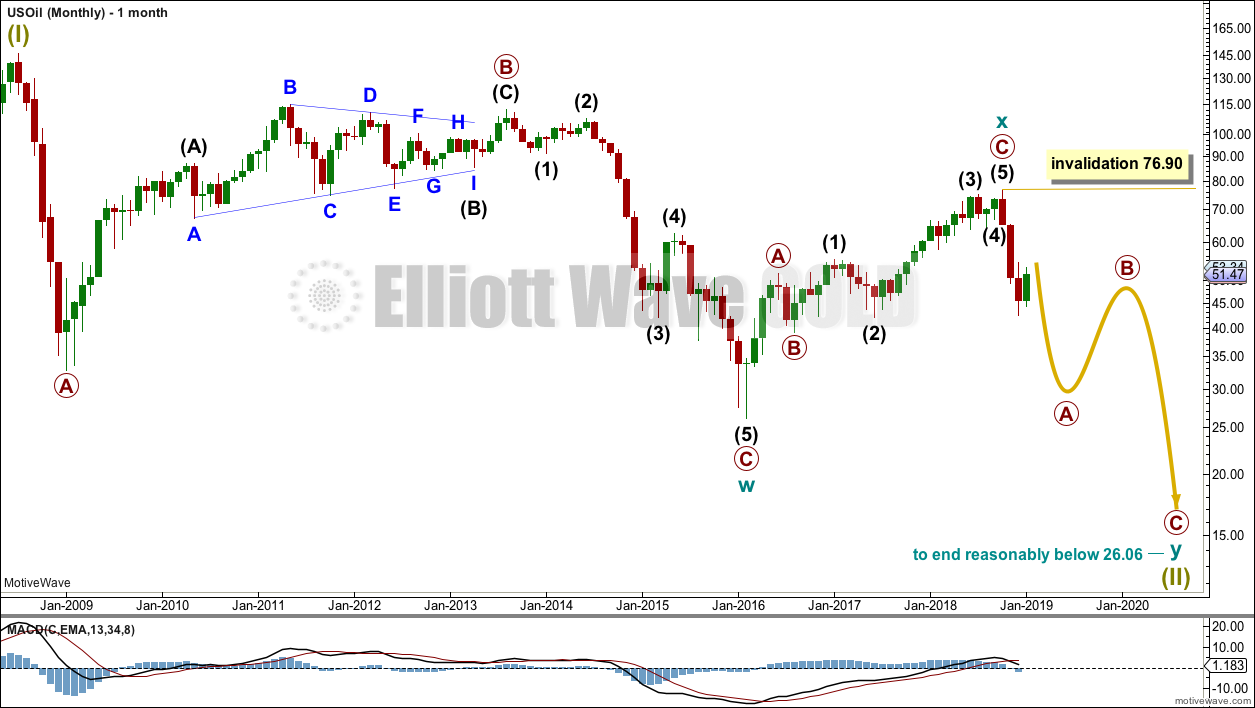
Classic technical analysis favours a bearish wave count for Oil at this time.
The large fall in price from the high in June 2008 to February 2016 is seen as a complete three wave structure. This large zigzag may have been only the first zigzag in a deeper double zigzag.
The first zigzag down is labelled cycle wave w. The double is joined by a now complete three in the opposite direction, a zigzag labelled cycle wave x.
The purpose of a second zigzag in a double is to deepen the correction when the first zigzag does not move price deep enough. Cycle wave y would be expected to move reasonably below the end of cycle wave w to deepen the correction. Were cycle wave y to reach equality with cycle wave w that takes Oil into negative price territory, which is not possible. Cycle wave y would reach 0.618 the length of cycle wave w at $2.33.
A better target calculation would be using the Fibonacci ratios between primary waves A and C within cycle wave y. This cannot be done until both primary waves A and B are complete.
Within cycle wave y, no second wave correction nor B wave may move beyond its start above 76.90.
WEEKLY CHART
Click chart to enlarge.
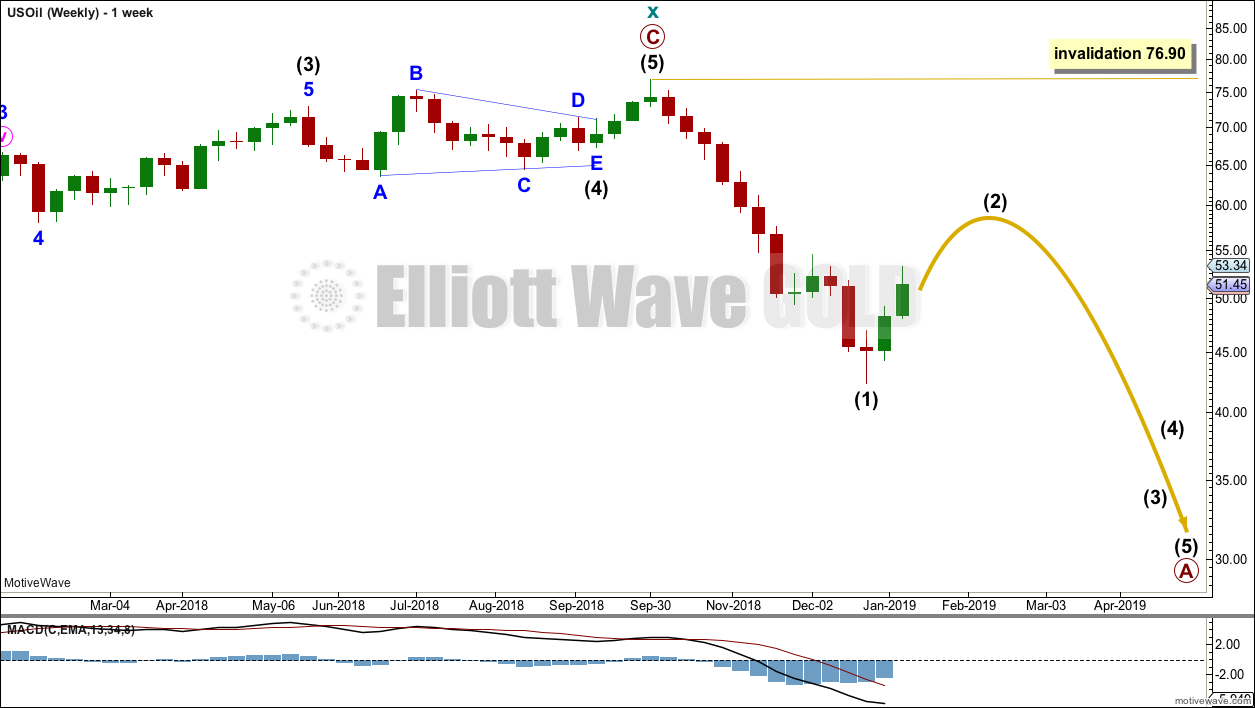
This weekly chart is focussed on the start of cycle wave y.
Cycle wave y is expected to subdivide as a zigzag. A zigzag subdivides 5-3-5. Primary wave A must subdivide as a five wave structure if this wave count is correct.
Within primary wave A, intermediate wave (1) may now be complete. Intermediate wave (2) may unfold over a few weeks as a sideways choppy consolidation, or a deep sharp bounce. At this stage, it looks more likely to be a deep bounce.
Intermediate wave (2) may not move beyond the start of intermediate wave (1) above 76.90.
DAILY CHART
Click chart to enlarge.
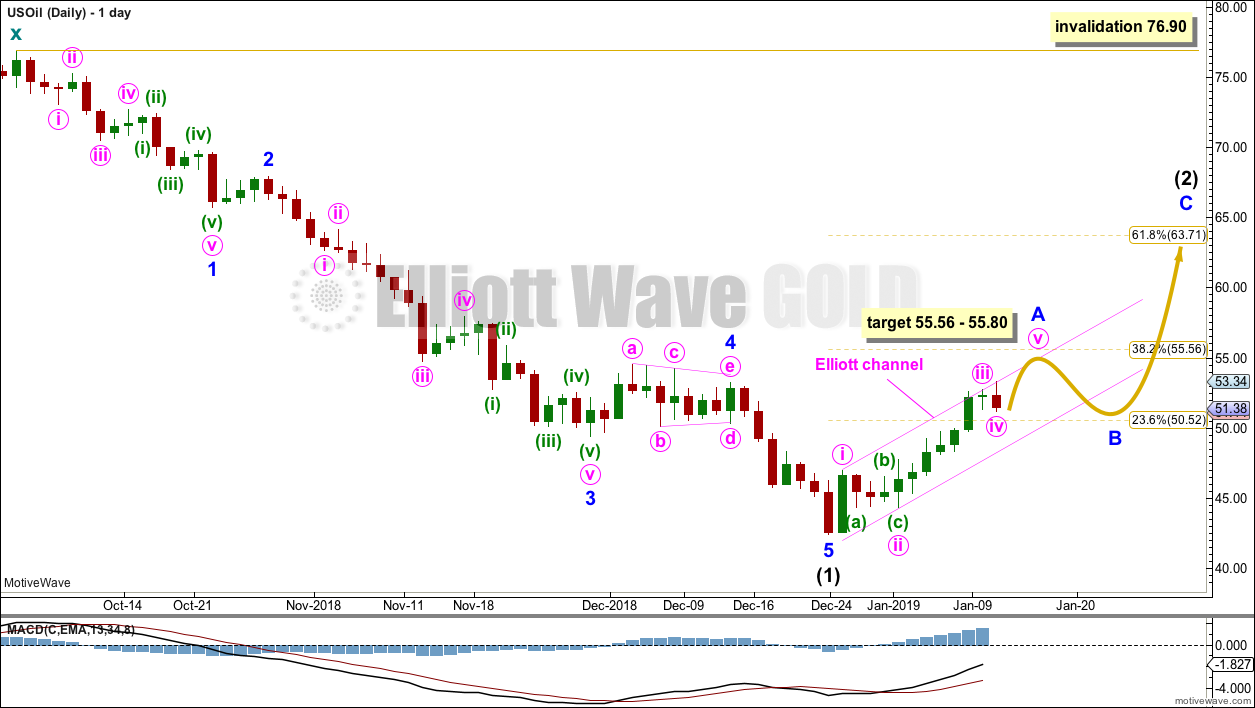
Intermediate wave (2) would most likely subdivide as a zigzag and at this stage that is how it will be labelled. However, it may also subdivide as a flat or combination. It is impossible at this stage to know which structure it will unfold as. The labelling within it will most likely change as it unfolds.
If intermediate wave (2) is unfolding as a zigzag, then within it minor wave A must subdivide as a five wave structure. Within minor wave A, minute waves i to iv may now be complete.
Minute wave v would be likely to make at least a slight new high above the end of minute wave iii at 52.78 to avoid a truncation. Minute wave v would reach equality in length with minute wave i at 55.80. This is close to the 0.382 Fibonacci ratio of intermediate wave (1) at 55.56, giving a small target zone for minor wave A to end.
A channel is drawn about minor wave A. If this channel is breached by downwards movement, that may be taken as an indication that minor wave A may be complete and minor wave B may have begun.
Intermediate wave (2) may be very deep. It should last at least four weeks, so that it shows up on the monthly chart.
Intermediate wave (2) may not move beyond the start of intermediate wave (1) above 76.90.
TECHNICAL ANALYSIS
MONTHLY CHART
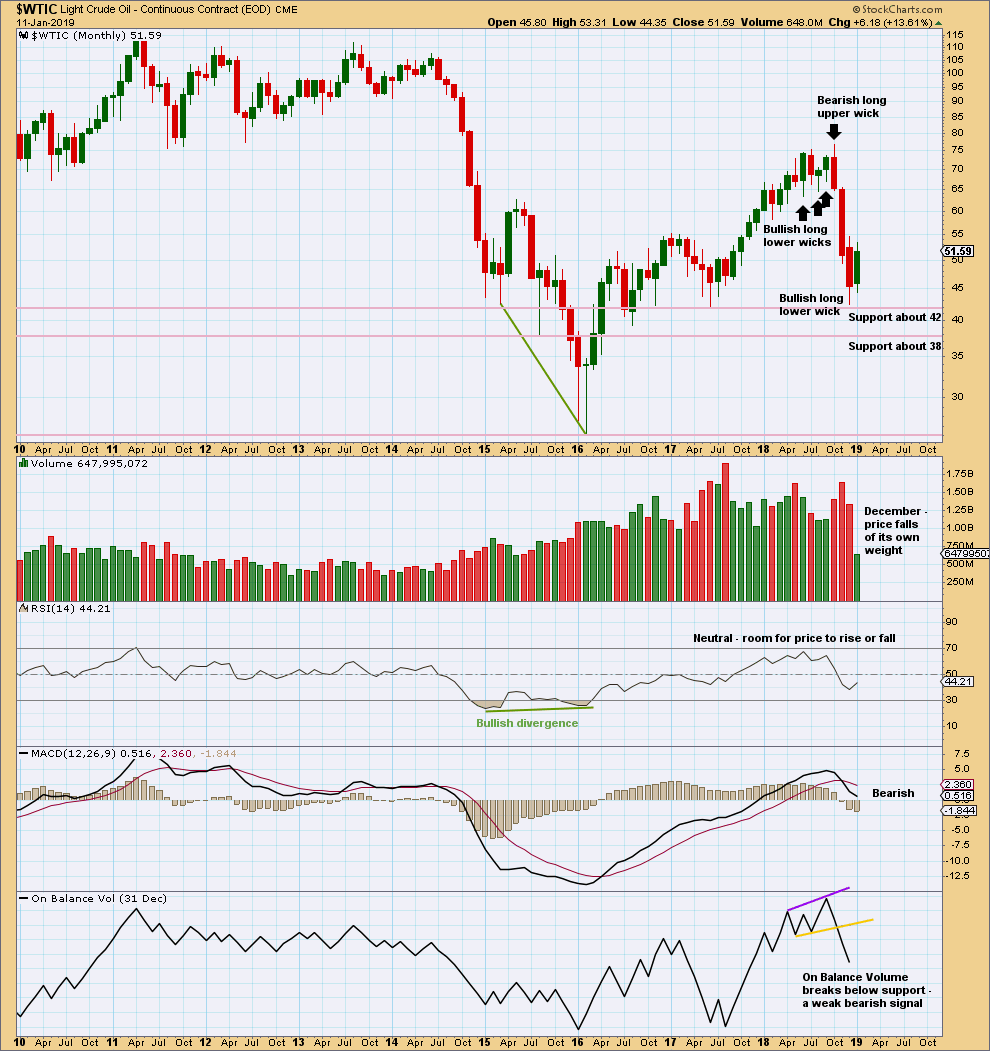
Click chart to enlarge. Chart courtesy of StockCharts.com.
Lower volume and a slightly bullish long lower wick for December add a little support to the Elliott wave count.
WEEKLY CHART
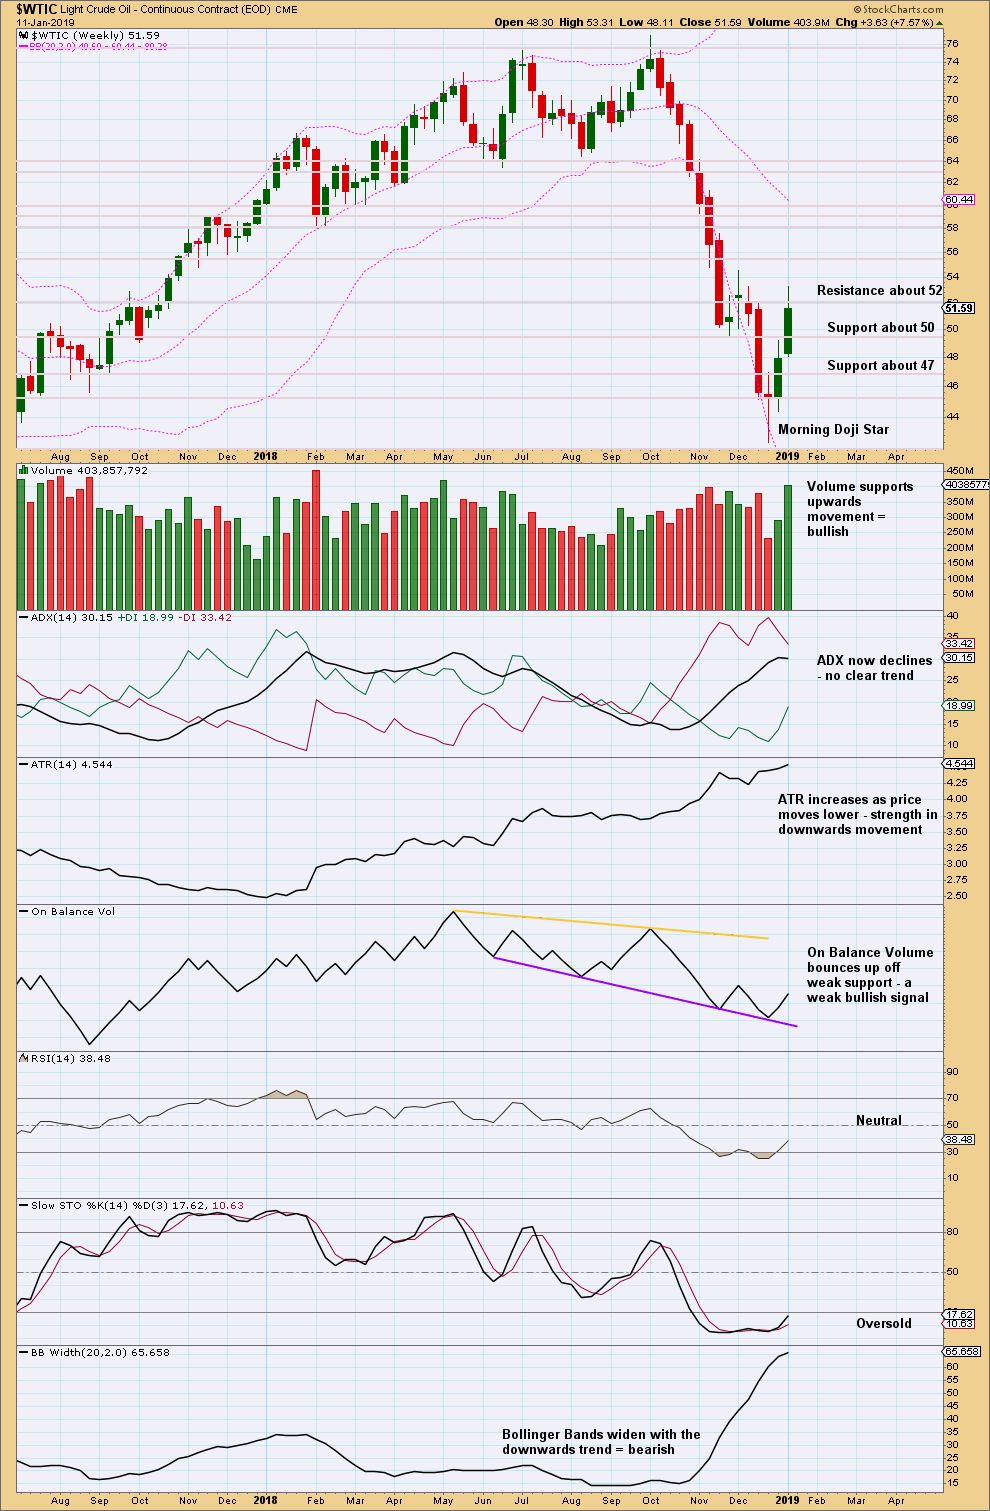
Click chart to enlarge. Chart courtesy of StockCharts.com.
Strong volume supporting upwards movement is bullish, but because of the longer upper wick on this weekly candlestick there may be some downwards movement for the short term.
DAILY CHART
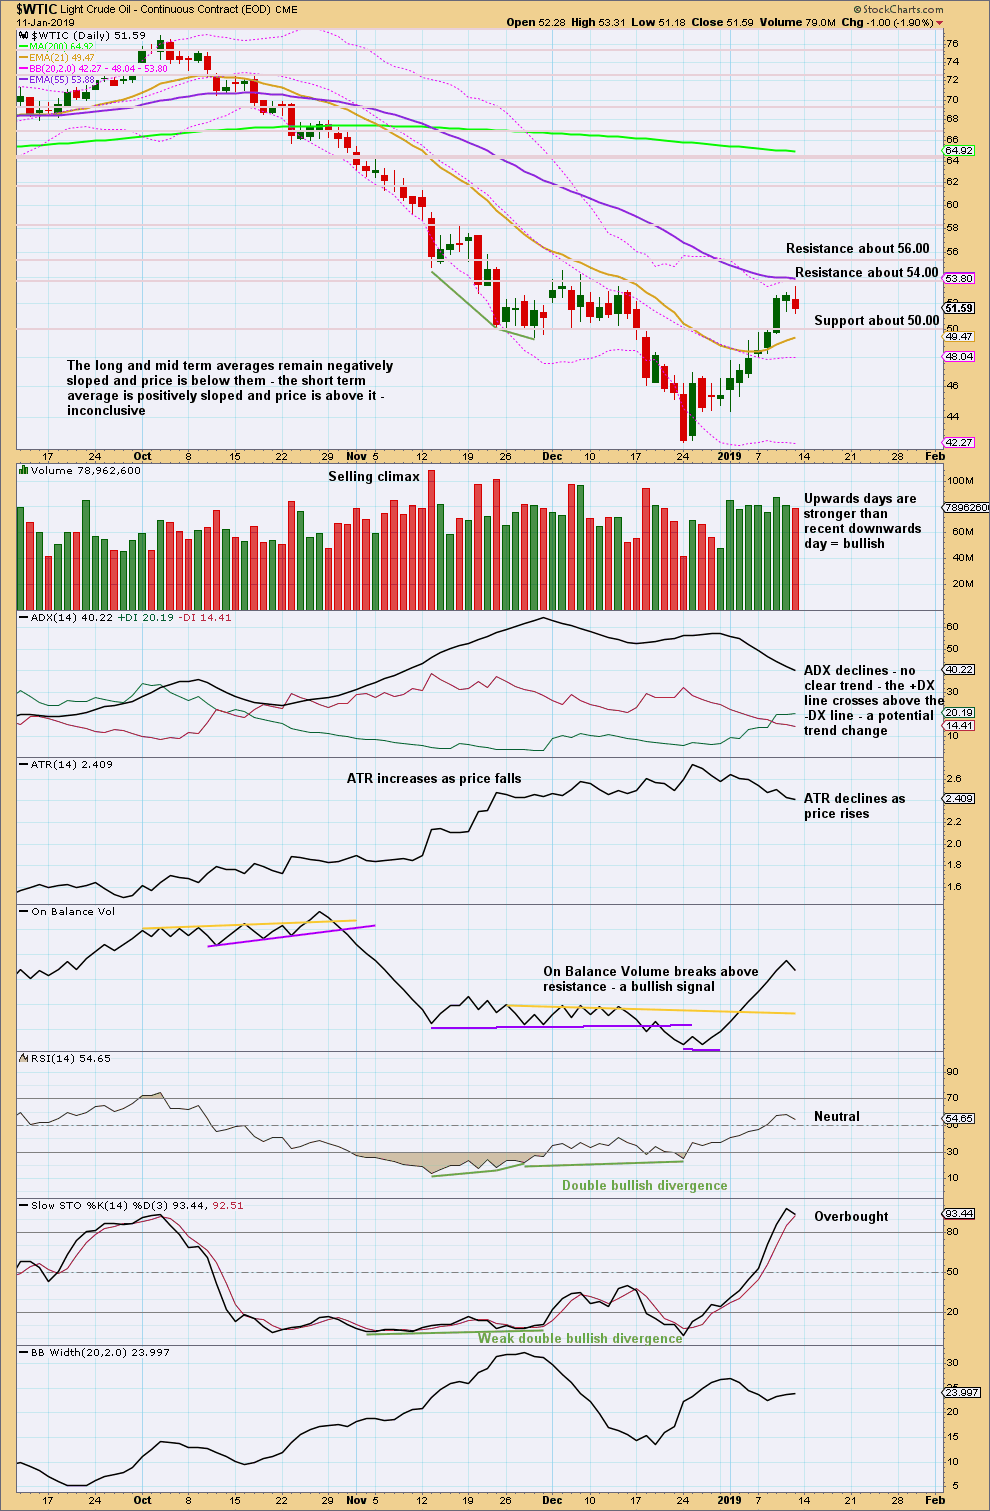
Click chart to enlarge. Chart courtesy of StockCharts.com.
Upwards movement may be expected to continue to resistance noted on the chart. Overall, this chart continues to support the Elliott wave count.
—
Always practice good risk management as the most important aspect of trading. Always trade with stops and invest only 1-5% of equity on any one trade. Failure to manage risk is the most common mistake new traders make.
Hi Lara, off the recent lows could another alternate be an A-B-C corrective up instead of impulsive, before commencing the down again? Tj
Which market are you referring to?
Sorry Lara, S&P500
Just so that all Lara’s Weekly members are also informed:
I’ve had to move house this week. A big move, it’s taken quite some time.
I’m settled now and back to normal in time for the next Lara’s Weekly. But I shall not be doing any extras this week.
Next week I plan on a couple of extras: I want to take some time to find an alternate for the S&P at the monthly chart level, and I want to update BitCoin.
Moving all belongings could be a daunting task, perfectly understandable.
Take your time. May be a new picture might emerge. You never know. Always one step ahead of the market, if possible, is all we can honestly hope for OR own a crystal ball 🙂
Lara,
Good luck on the move! I think you picked a good time.
Thanks guys.
All moved and settled now. Ready for end of week analysis.
Hi Lara,
Question on Elliott wave channel… Is it possible sometimes that it is not possible to draw an Elliott wave channel because the chart is going parabolic? For example, the Nasdaq’s parabolic move from 1990 to 2000 (attached).
What would be the alternative to use in this case?
I am studying closely the Nasdaq and QQQ as the QQQ:$SPX ratio is in a bull market. I believe that the bull market will end when the ratio QQQ:$SPX will fail. I know it is not what you do but I believe that Cloud, AI and analytics companies will dominate the US indices in terms of weight, pushing them into bubbles similar to 1999… And hence, what can be used to analyze parabolic moves? For Cloud, AI and analytics companies, I am talking companies like AMZN, CRM, WDAY and VMW.
Hope you are doing well.
Thanks Lara,
Mathieu
I’ve written 3 posts on channels which will answer your question, and more.
Best fit channels – when to use them and how.
Early channel techniques – base channels, acceleration channels.
Elliott channels.
Many Thanks, Lara. If at some point you were to start from a blank canvas, even if just for the sake of the exercise, I’d be very interested in your thought process. That would be worth its weight in Gold.
I’m assuming you’re talking about the S&P here?
Yes, perhaps the S&P500, but really it could be anything. I’m just interested in how you go about starting your wave counts from a blank slate – more the thought process behind it. If you were to make such a video, Id find it very educational. Im sure other members would as well.
Thanks Lara.
Sure. I do sometimes. I plan on doing this for the S&P in about 2-3 days time. I shall film it.
Awesome. thanks Lara