

S&P 500
Upwards movement was expected for last week, which is exactly what has happened.
Both Elliott wave counts remain valid, but the main Elliott wave count has more support from classic technical analysis, particularly market breadth.
Summary: A low may now be in place. Confidence in this view may be had if price makes a new high above 2,631.09. It it does, then at that stage the target would be 3,045 with a limit at 3,477.39. This primary view has support from strongly rising market breadth and a 90% up day on the 4th of January.
The alternate wave count expects one more low before cycle wave IV is complete. Targets are either 2,269 or 2,242 – 2,240, although when intermediate wave (4) may be complete the target would be recalculated.
The biggest picture, Grand Super Cycle analysis, is here.
The monthly chart was last published here.
MAIN ELLIOTT WAVE COUNT
WEEKLY CHART
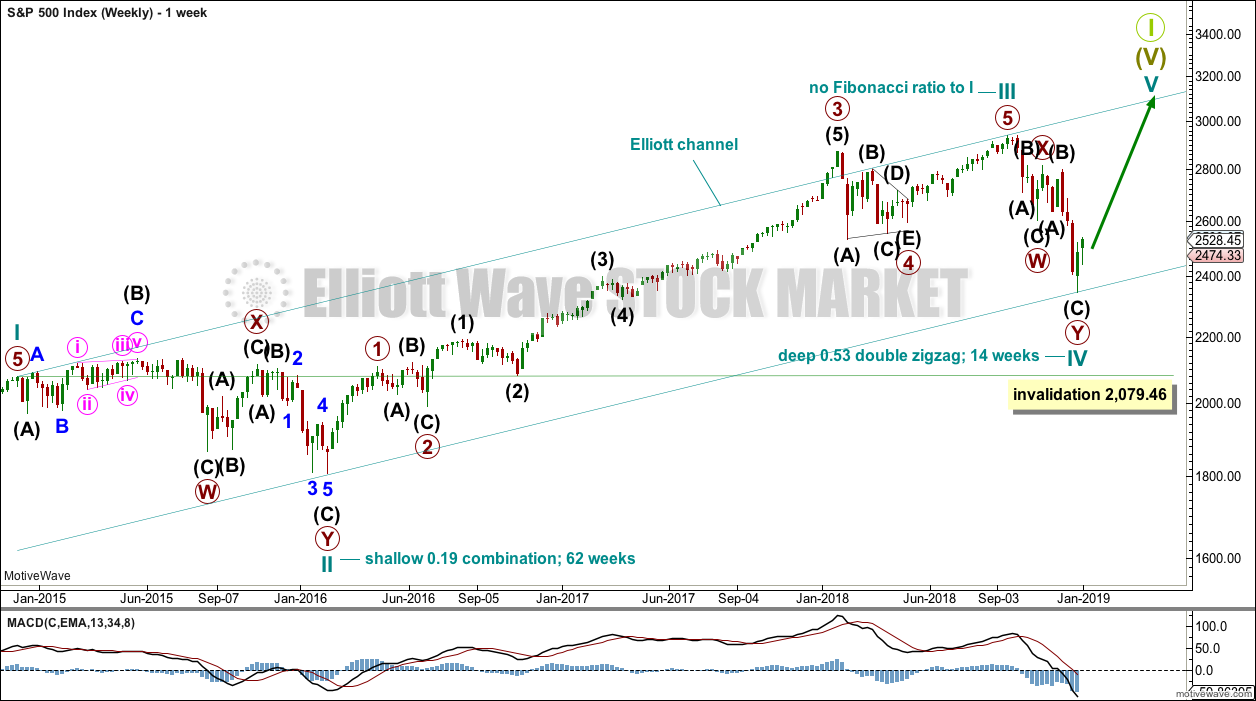
Click chart to enlarge.
This weekly chart shows all of cycle waves II, III and IV so far.
Cycle wave II fits as a time consuming double combination: flat – X – zigzag. Combinations tend to be more time consuming corrective structures than zigzags. If cycle wave IV completes as a single or multiple zigzag, then it should be expected to be more brief than cycle wave II.
Cycle wave IV may have ended at the lower edge of the Elliott channel. Fourth waves are not always contained within Elliott channels. If the alternate daily wave count below is correct, then cycle wave IV may breach this channel.
Cycle wave IV may not move into cycle wave I price territory below 2,079.46.
Although both cycle waves II and IV are labelled W-X-Y, they are different corrective structures. There are two broad groups of Elliott wave corrective structures: the zigzag family, which are sharp corrections, and all the rest, which are sideways corrections. Multiple zigzags belong to the zigzag family and combinations belong to the sideways family. There is perfect alternation between the possible double zigzag of cycle wave IV and the combination of cycle wave II.
Although there is gross disproportion between the duration of cycle waves II and IV, the size of cycle wave IV in terms of price makes these two corrections look like they should be labelled at the same degree. Proportion is a function of either or both of price and time.
Draw the Elliott channel about Super Cycle wave (V) as shown. Cycle wave V may find resistance about the upper edge.
DAILY CHART
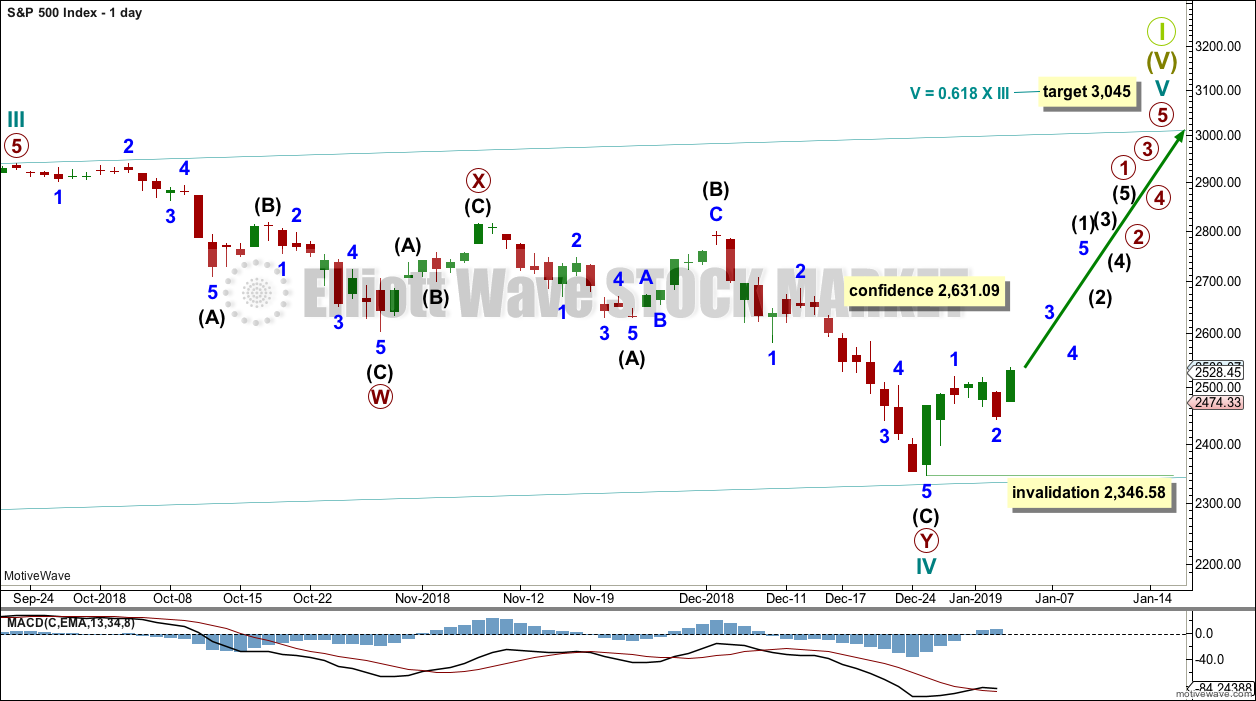
Click chart to enlarge.
The daily chart will focus on the structure of cycle wave IV.
Cycle wave IV may be a complete double zigzag. This would provide perfect alternation with the combination of cycle wave II. Double zigzags are fairly common corrective structures.
Within Super Cycle wave (V), cycle wave III may not be the shortest actionary wave. Because cycle wave III is shorter than cycle wave I, this limits cycle wave V to no longer than equality in length with cycle wave III at 3,477.39. A target is calculated for cycle wave V to end prior to this point.
Cycle wave V must subdivide as a five wave motive structure, either an impulse or an ending diagonal. An impulse is much more common and that will be how it is labelled. A diagonal would be considered if overlapping suggests it.
Within the five wave structure for cycle wave V, primary wave 1 would be incomplete. Within primary wave 1, intermediate wave (1) may be incomplete. The degree of labelling within cycle wave V may need to be adjusted as it unfolds further.
Within cycle wave V, no second wave correction may move beyond the start of its first wave below 2,346.58.
At this stage, a new high by any amount at any time frame above 2,631.09 would invalidate the alternate wave count below and provide confidence in this main wave count.
ALTERNATE DAILY CHART
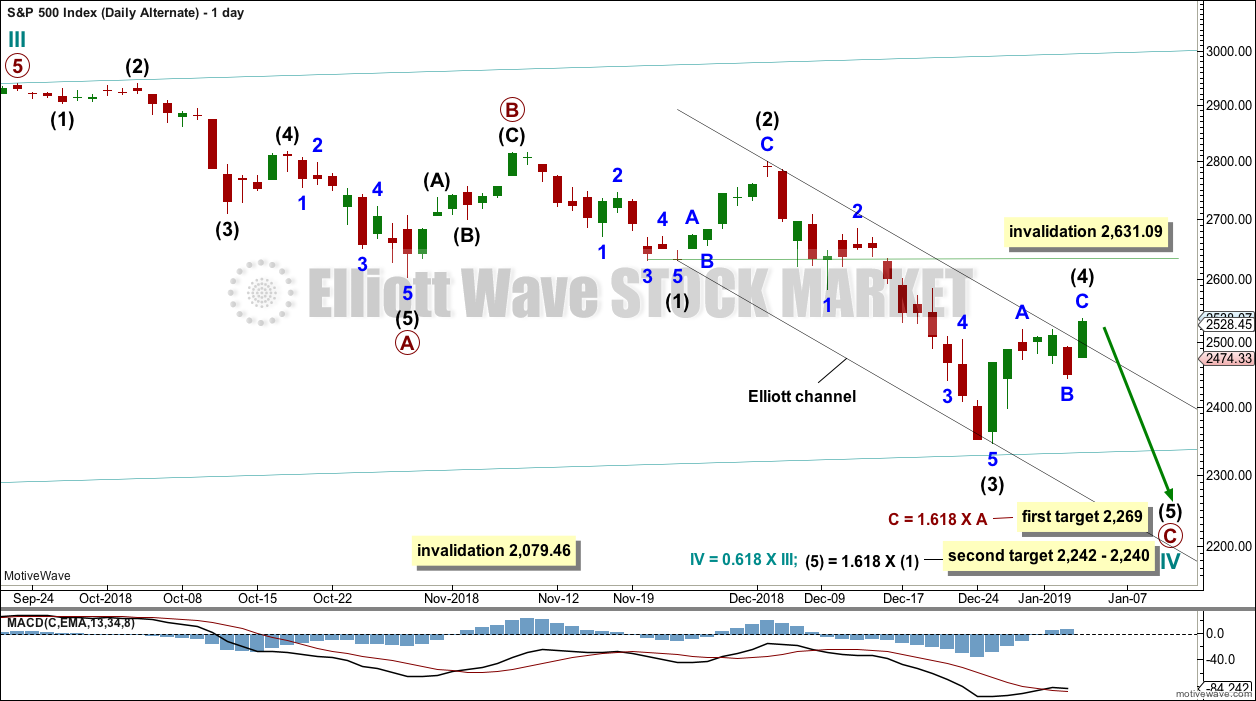
Click chart to enlarge.
Cycle wave IV may be a an incomplete single zigzag. This would provide perfect alternation with the combination of cycle wave II. Zigzags are the most common corrective structures.
Within this zigzag, primary wave C may be completing as a five wave impulse.
Intermediate wave (2) shows up on the weekly and daily charts. Intermediate wave (4) now also shows on weekly and daily charts. This wave count has the right look.
Intermediate wave (4) may not move into intermediate wave (1) price territory above 2,631.09.
Targets are calculated for cycle wave IV to end. If price gets to the first target and the structure is incomplete, or if price falls through the first target, then the second target may be used.
Draw a channel about primary wave C. Draw the first trend line from the low of intermediate wave (1) to the low of intermediate wave (3), then place a parallel copy on the high of intermediate wave (2). Intermediate wave (4) has now breached the upper edge of this channel. Fourth waves are not always contained within channels drawn using this technique; when intermediate wave (4) may be more clearly complete, then the channel may be redrawn using Elliott’s second technique.
TECHNICAL ANALYSIS
WEEKLY CHART
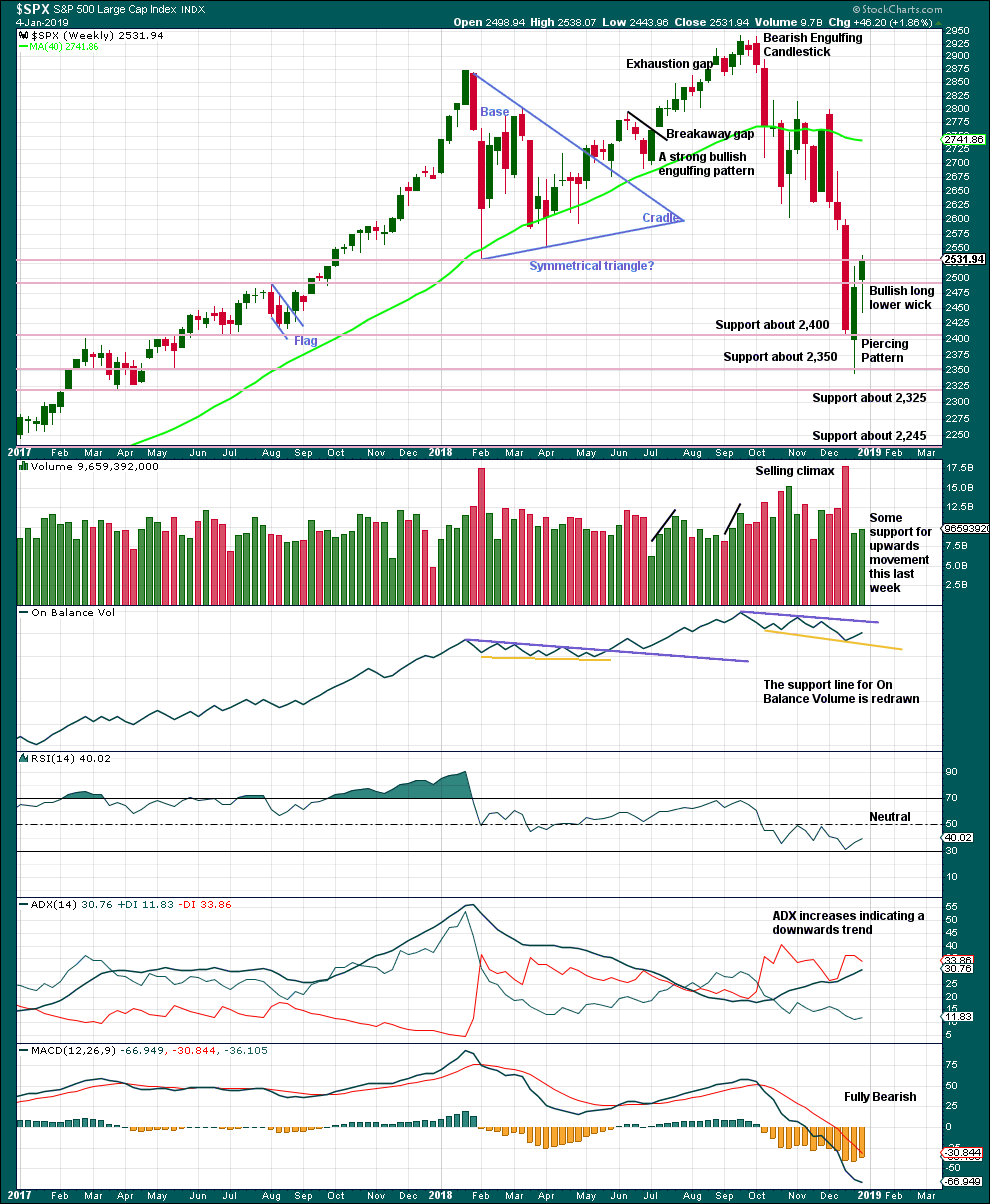
Click chart to enlarge. Chart courtesy of StockCharts.com.
From the all time high to the low of last week, price moved lower by 20.2% of market value meeting the definition for a bear market.
It should be noted that the large fall in price from May 2011 to October 2011 also met this definition of a bear market, yet it was only a very large pullback within a bull market, which so far has lasted over 10 years.
This week has support from volume and a long lower wick. This is bullish at least for the short term.
DAILY CHART
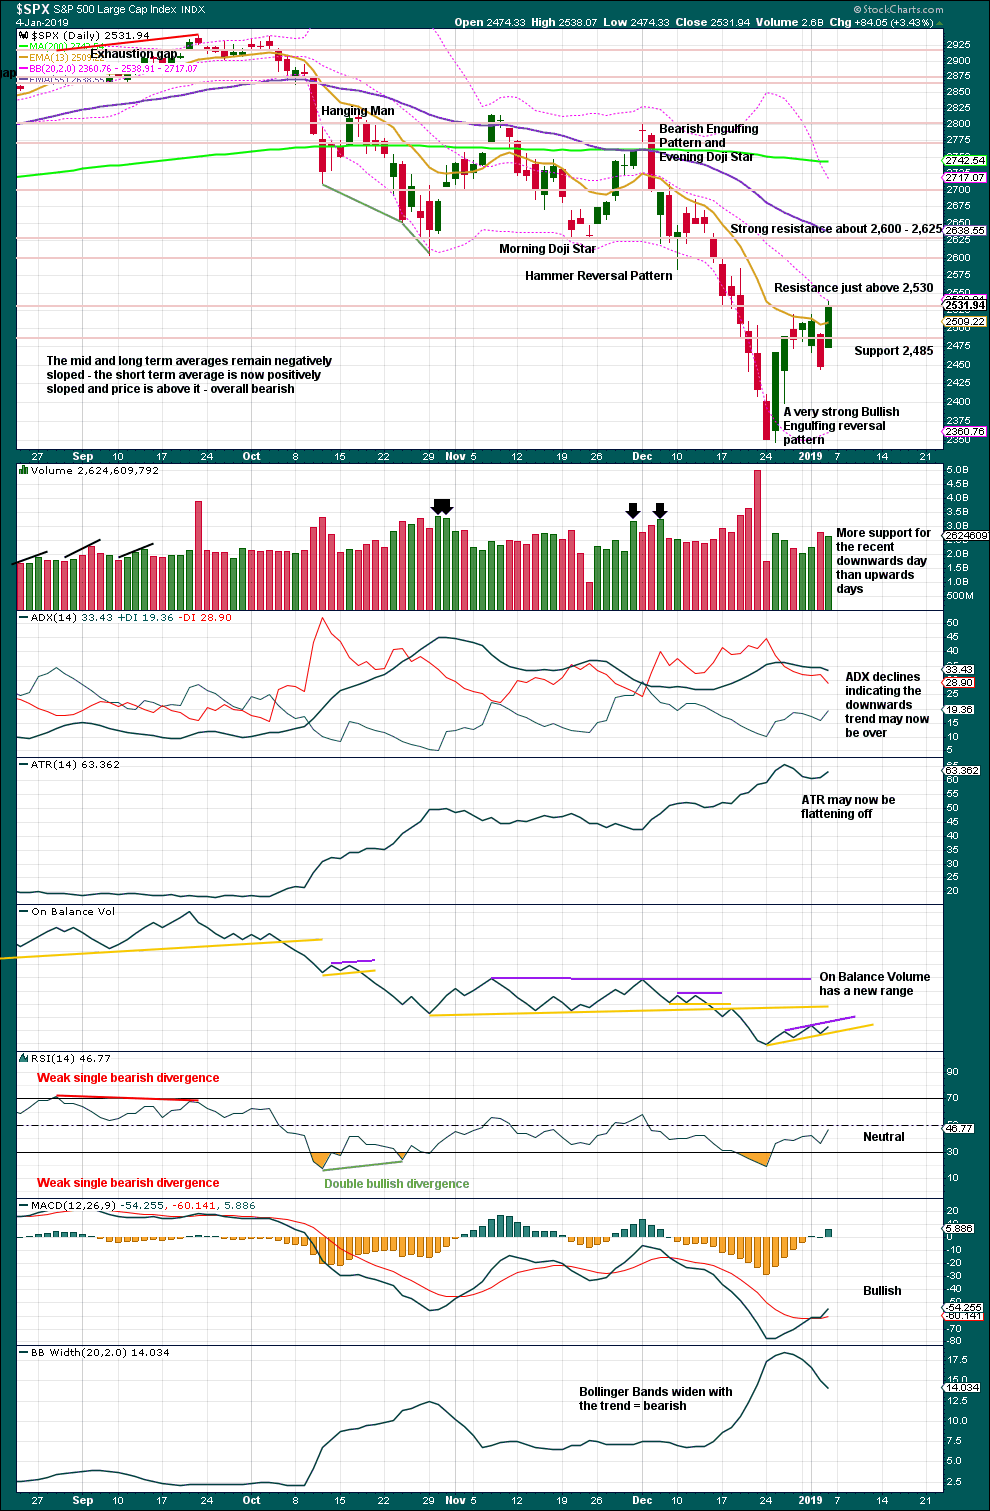
Click chart to enlarge. Chart courtesy of StockCharts.com.
Over a fairly long period of time this ageing bull market has been characterised by upwards movement on light and declining volume and low ATR. For the short to mid term, little concern may be had if price now rises again on declining volume. Current market conditions have allowed for this during a sustained rise in price.
Considering the larger picture from the Elliott wave count, some weakness approaching the end of Grand Super Cycle wave I is to be expected.
Friday was a 90% upward day from Lowry’s data. This is an indication of strength underlying this rise in price.
BREADTH – AD LINE
WEEKLY CHART
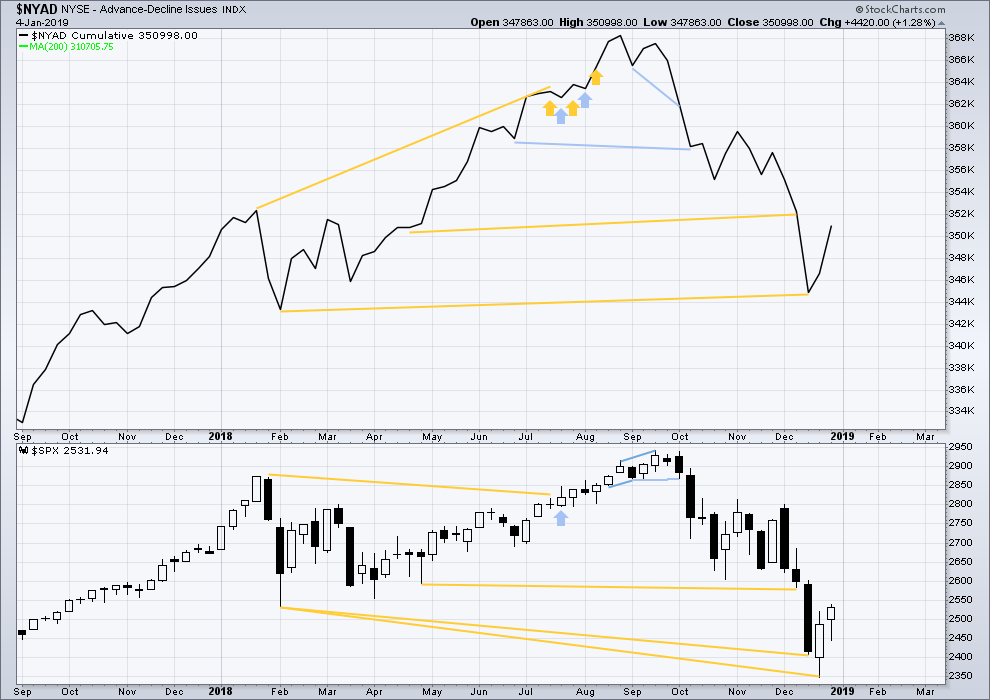
Click chart to enlarge. Chart courtesy of StockCharts.com. So that colour blind members are included, bearish signals
will be noted with blue and bullish signals with yellow.
Upwards movement has support from rising market breadth.
DAILY CHART
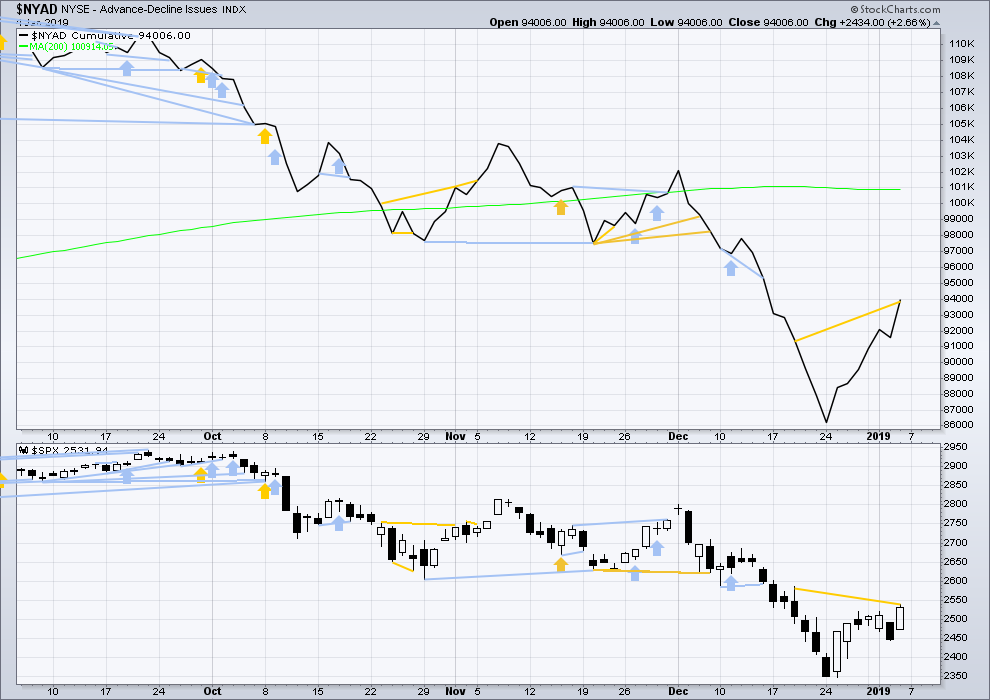
Click chart to enlarge. Chart courtesy of StockCharts.com. So that colour blind members are included, bearish signals
will be noted with blue and bullish signals with yellow.
Breadth should be read as a leading indicator.
For the short term, the AD line has made a strong new high above a prior small swing high on the 19th of December 2018, but price has not. This divergence is bullish; the AD line is rising faster than price.
VOLATILITY – INVERTED VIX CHART
WEEKLY CHART
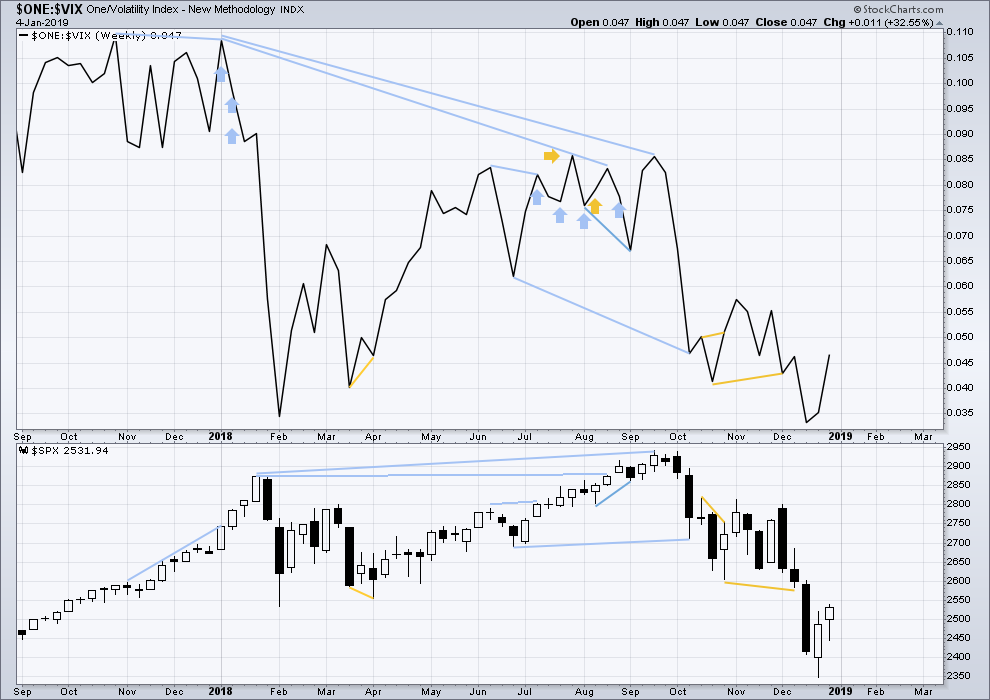
Click chart to enlarge. Chart courtesy of StockCharts.com. So that colour blind members are included, bearish signals
will be noted with blue and bullish signals with yellow.
Upwards movement has support from a corresponding decline in VIX. There is no divergence.
DAILY CHART
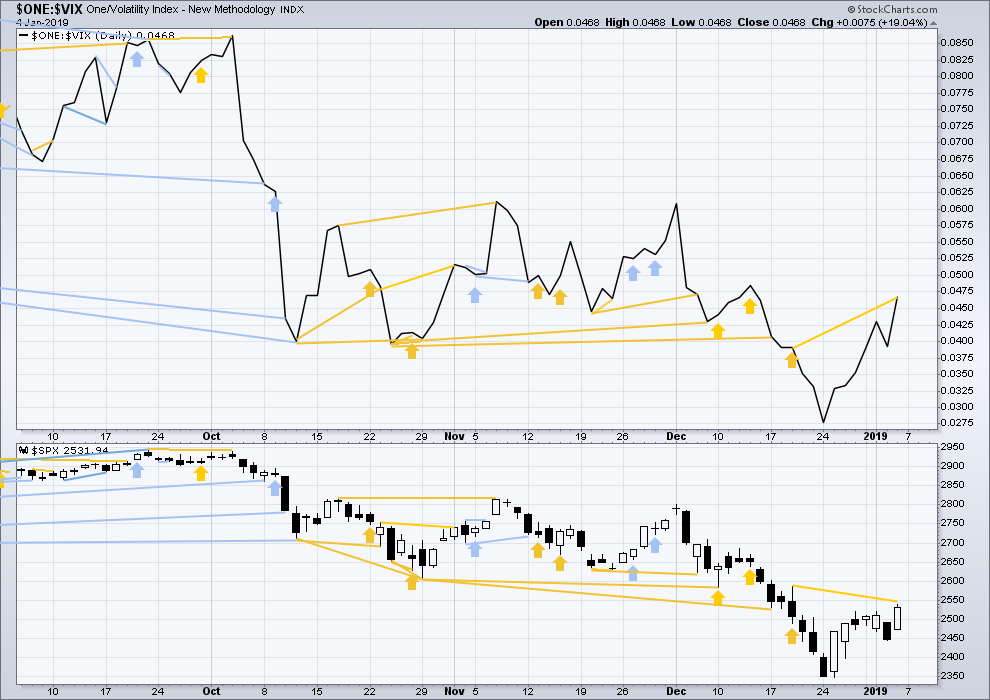
Click chart to enlarge. Chart courtesy of StockCharts.com. So that colour blind members are included, bearish signals
will be noted with blue and bullish signals with yellow.
Inverted VIX has made a new high above the prior small swing high of the 19th of December 2018, but price has not. This divergence is bullish.
DOW THEORY
Dow Theory confirms a bear market. This does not necessarily mean a bear market at Grand Super Cycle degree though; Dow Theory makes no comment on Elliott wave counts. On the 25th of August 2015 Dow Theory also confirmed a bear market. The Elliott wave count sees that as part of cycle wave II. After Dow Theory confirmation of a bear market in August 2015, price went on to make new all time highs and the bull market continued.
DJIA: 23,344.52 – a close on the 19th of December at 23,284.97 confirms a bear market.
DJT: 9,806.79 – price has closed below this point on the 13th of December.
S&P500: 2,532.69 – a close on the 19th of December at 2,506.96 provides support to a bear market conclusion.
Nasdaq: 6,630.67 – a close on the 19th of December at 6,618.86 provides support to a bear market conclusion.
GOLD
The target for upwards movement to end was at 1,295. Friday’s high at 1,295.98 almost perfectly met expectations. Members were warned to look out for a sharp reversal after the upwards wave ended.
Summary: A sideways consolidation is now expected for a fourth wave to last about 2 to 4 weeks. It may find support about 1,259 and resistance about 1,300.
The final target for this bounce to end is about 1,305 – 1,310.
Grand SuperCycle analysis is here.
Last historic analysis with monthly charts is here.
Only two remaining wave counts have a reasonable probability and are published below: a triangle (the preferred wave count) and a double zigzag. The combination wave count is discarded this week based upon a very low probability.
MAIN ELLIOTT WAVE COUNT
WEEKLY CHART – TRIANGLE
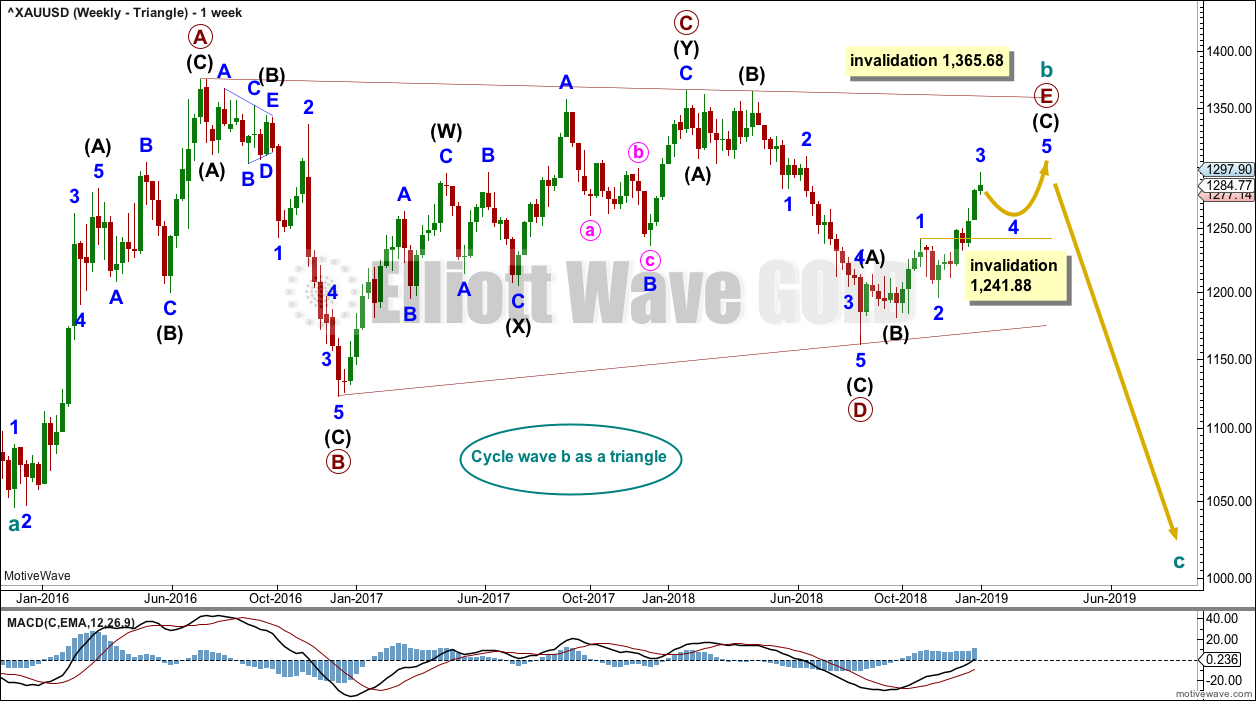
Click chart to enlarge.
Cycle wave b may be an incomplete regular contracting triangle. Primary wave E may not move beyond the end of primary wave C above 1,365.68.
Within primary wave E, intermediate waves (A) and (B) may be complete. Intermediate wave (C) must subdivide as a five wave structure. Within intermediate wave (C), minor wave 4 may not move into minor wave 1 price territory below 1,241.88.
Four of the five sub-waves of a triangle must be zigzags, with only one sub-wave allowed to be a multiple zigzag. Wave C is the most common sub-wave to subdivide as a multiple, and this is how primary wave C for this example fits best. Primary wave E would most likely be a single zigzag. It is also possible that it may subdivide as a triangle to create a rare nine wave triangle.
There are no problems in terms of subdivisions or rare structures for this wave count. It has an excellent fit and so far a typical look.
When primary wave E is a complete three wave structure, then this wave count would expect a cycle degree trend change. Cycle wave c would most likely make new lows below the end of cycle wave a at 1,046.27 to avoid a truncation.
It is possible now that primary wave E may end in January or February 2019. Some reasonable weakness should be expected at its end. Triangles often end with declining ATR, weak momentum and weak volume.
DAILY CHART – TRIANGLE
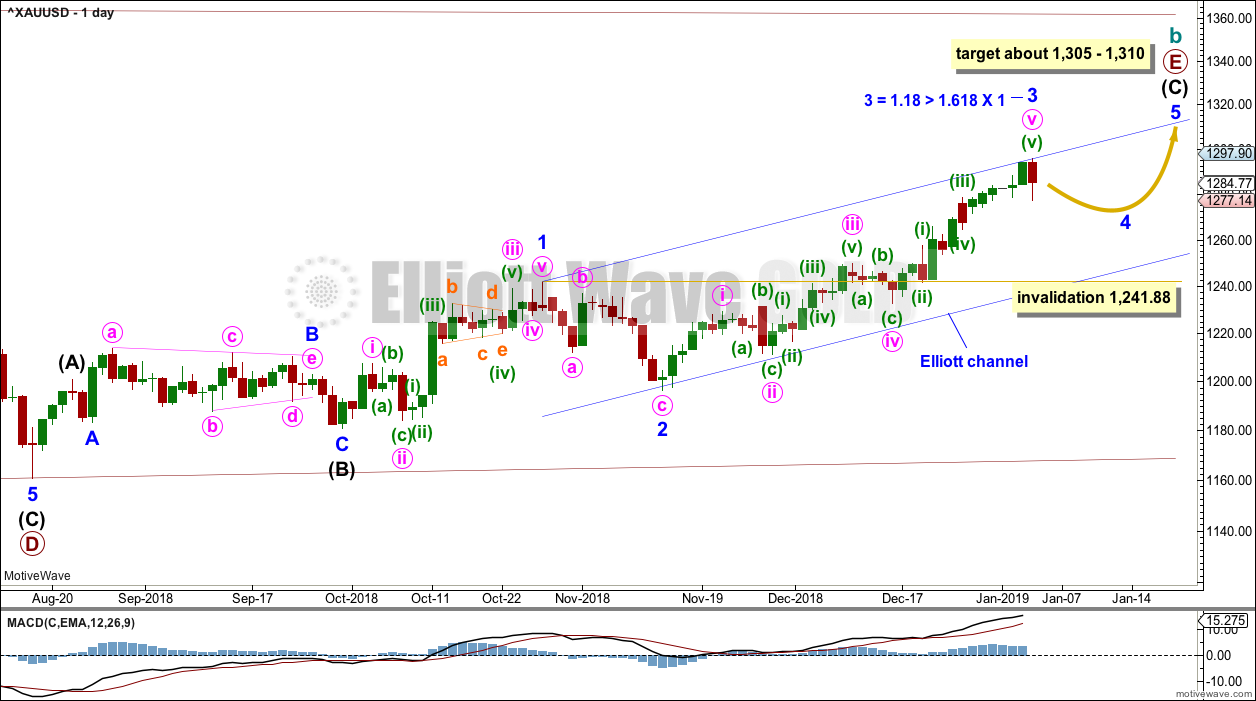
Click chart to enlarge.
Primary wave E may now be nearing its final stages for this wave count.
Primary wave E should subdivide as a zigzag. Intermediate waves (A) and (B) may now be complete. Intermediate wave (C) may now be nearing completion.
Minor wave 2 is a deep 0.75 zigzag. Minor wave 4 may be expected to most likely be a shallow sideways flat, triangle or combination.
Minor wave 3 exhibits the most common Fibonacci ratio to minor wave 1.
Minor wave 4 may not move into minor wave 1 price territory below 1,241.88.
A target for primary wave E is the strong zone of resistance about 1,305 to 1,310. Primary wave E is most likely to subdivide as a zigzag (although it may also subdivide as a triangle to create a rare nine wave triangle). It may last a total Fibonacci 21 or 34 weeks. So far it has lasted 20 weeks. Primary wave E may not move beyond the end of primary wave C above 1,365.68.
WEEKLY CHART – DOUBLE ZIGZAG
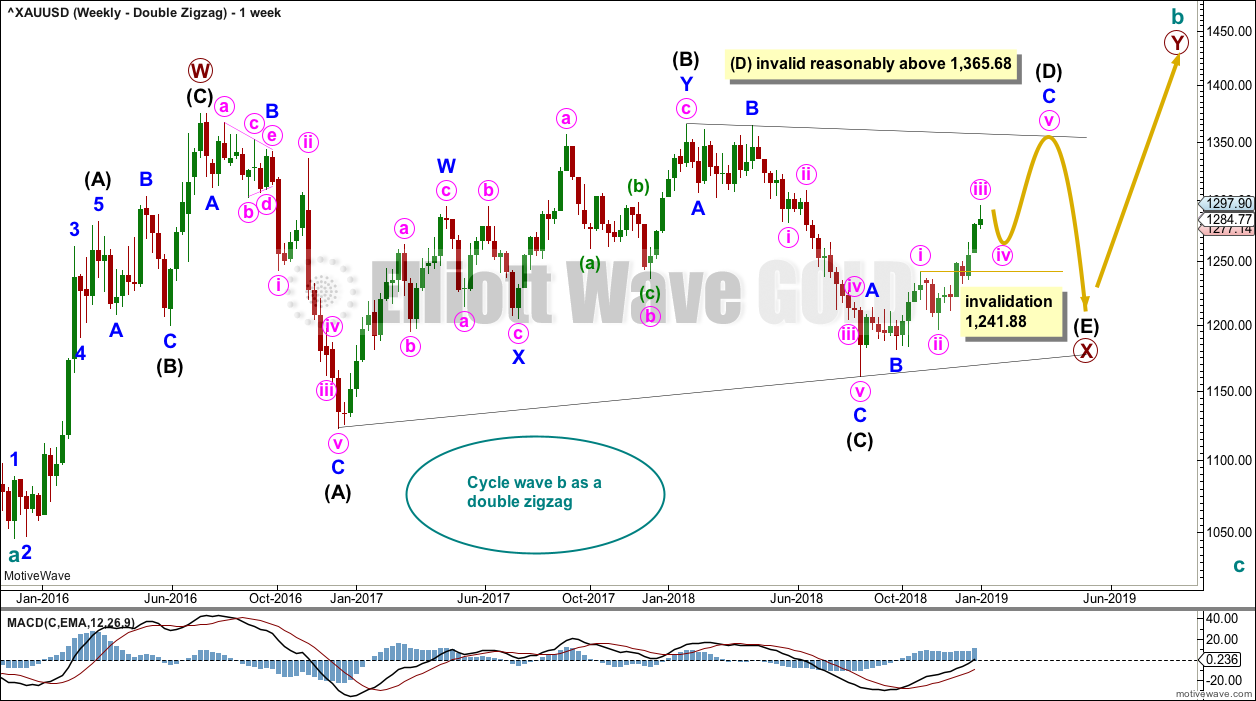
Click chart to enlarge.
It is possible that cycle wave b may be a double zigzag or a double combination.
The first zigzag in the double is labelled primary wave W. This has a good fit.
The double may be joined by a corrective structure in the opposite direction, a triangle labelled primary wave X. The triangle would be about three quarters complete.
Within the triangle of primary wave X, intermediate wave (C) should be complete. Within intermediate wave (D), minor waves A and B may be complete. Minor wave C must subdivide as a five wave structure. Within minor wave C, minute wave iv may not move into minute wave i price territory below 1,241.88.
Intermediate wave (D) would most likely subdivide as a single zigzag.
This wave count may now expect choppy overlapping movement in an ever decreasing range for several more months.
Primary wave Y would most likely be a zigzag because primary wave X would be shallow; double zigzags normally have relatively shallow X waves.
Primary wave Y may also be a flat correction if cycle wave b is a double combination, but combinations normally have deep X waves. This would be less likely.
This wave count has good proportions and no problems in terms of subdivisions.
TECHNICAL ANALYSIS
WEEKLY CHART
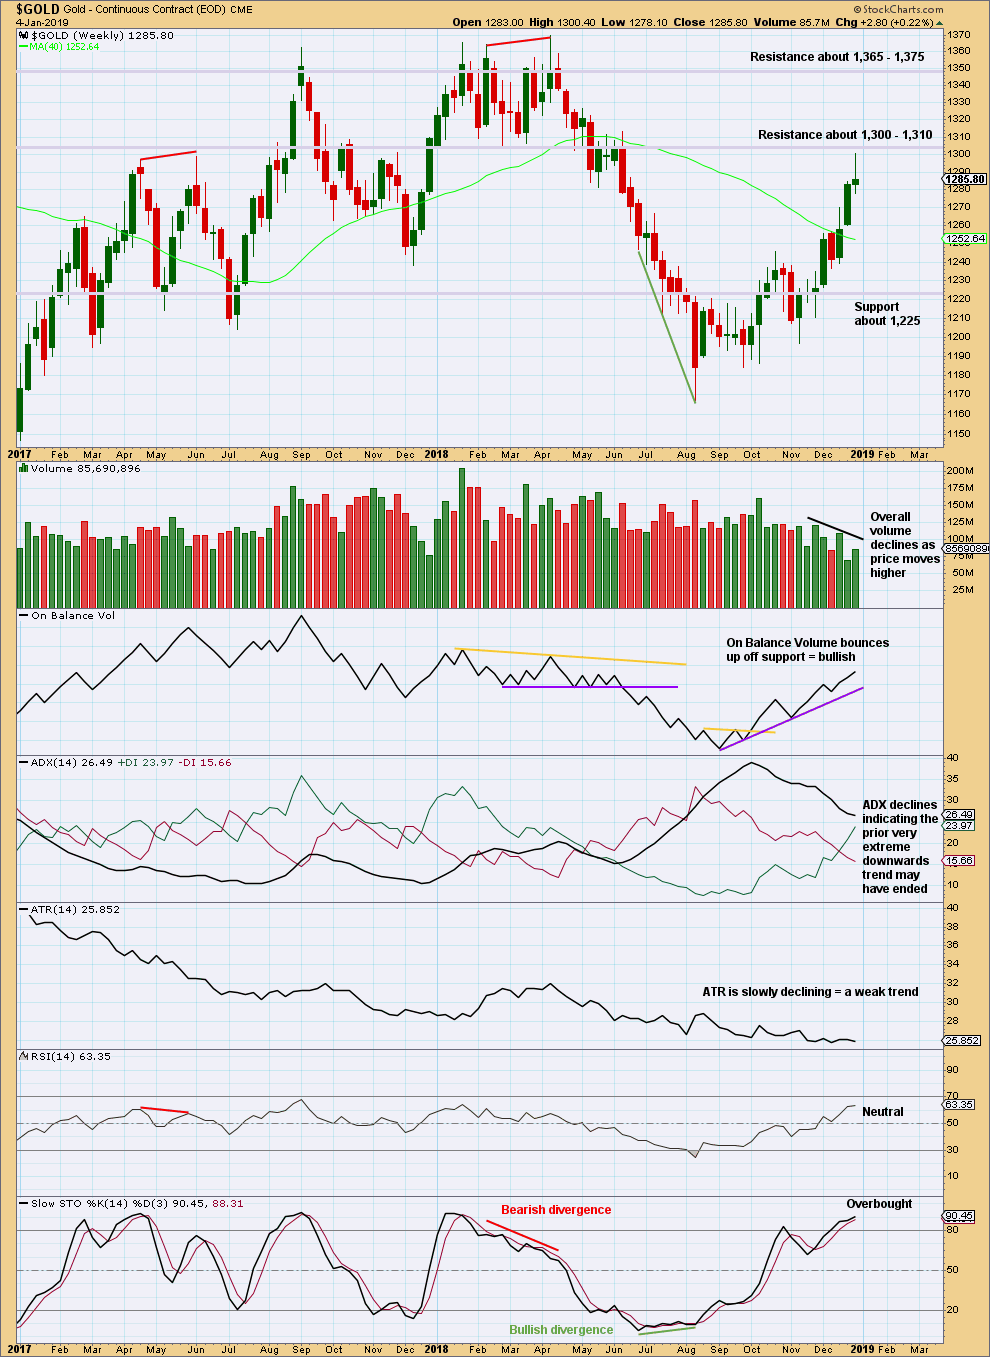
Click chart to enlarge. Chart courtesy of StockCharts.com.
This upwards movement lacks some strength. Volume is overall not supporting it. The long upper wick on this weekly candlestick at an area of strong resistance indicates some sideways movement may result here.
DAILY CHART
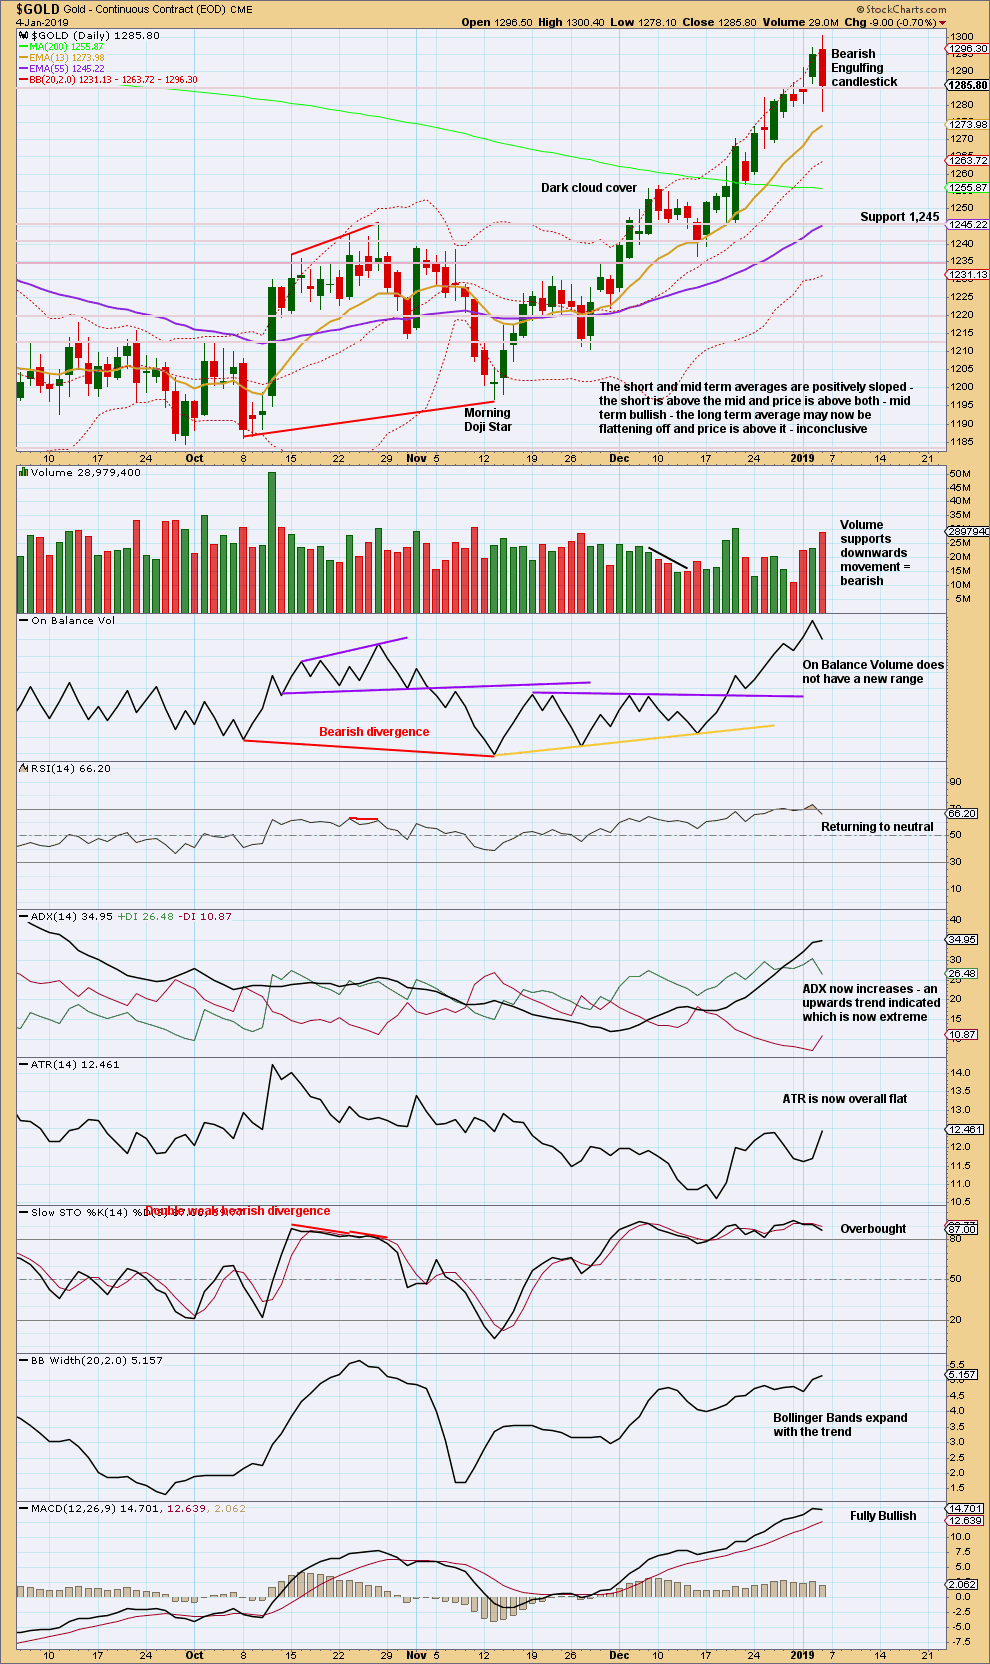
Click chart to enlarge. Chart courtesy of StockCharts.com.
The Bearish Engulfing reversal pattern has support from volume. After ADX reached extreme, this now signals an end to the upwards trend and either a reversal or a sideways consolidation.
GDX WEEKLY CHART
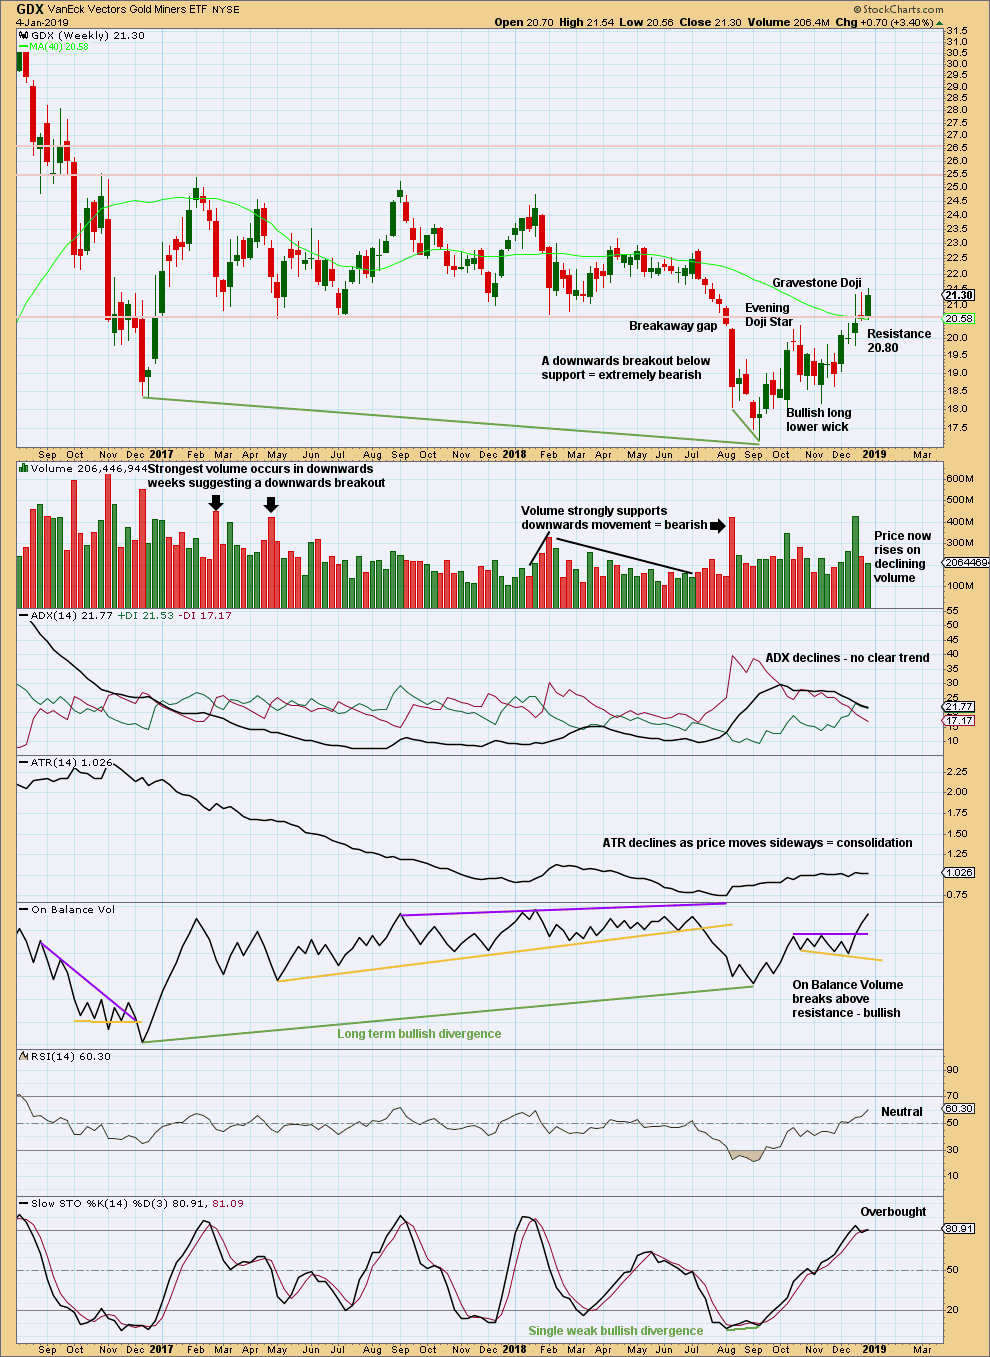
Click chart to enlarge. Chart courtesy of StockCharts.com.
The Gravestone Doji for last week’s candlestick has failed to signal a high. Price has moved a little higher, but the Gravestone Doji may still be a warning of a final high coming very soon.
GDX DAILY CHART
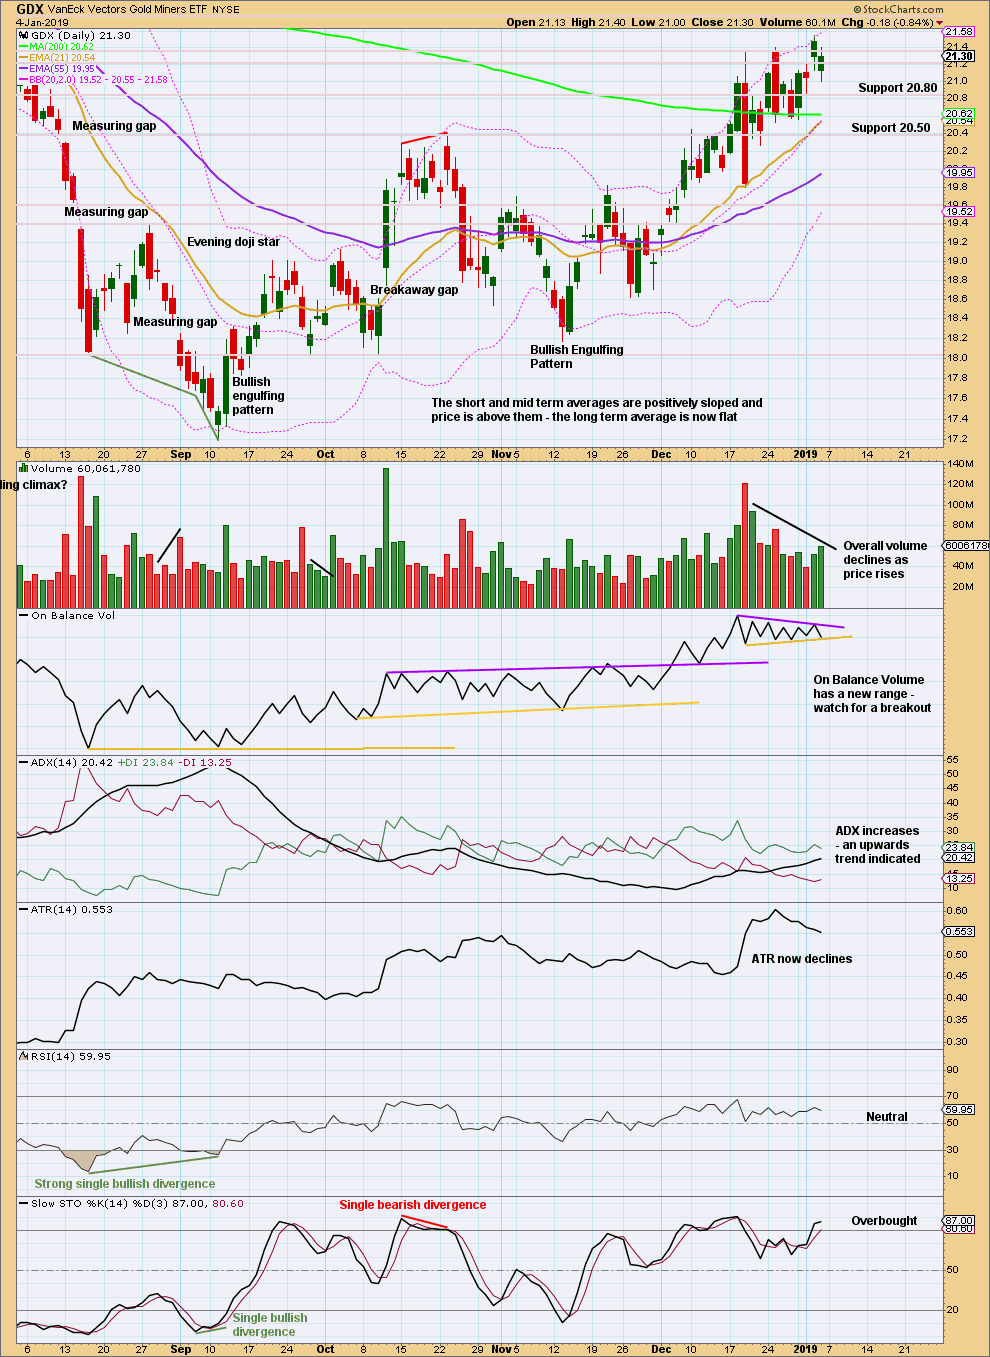
Click chart to enlarge. Chart courtesy of StockCharts.com.
The last two Bearish Engulfing patterns have not come at a high. Price continues higher. There is some weakness with declining volume and ATR
US OIL
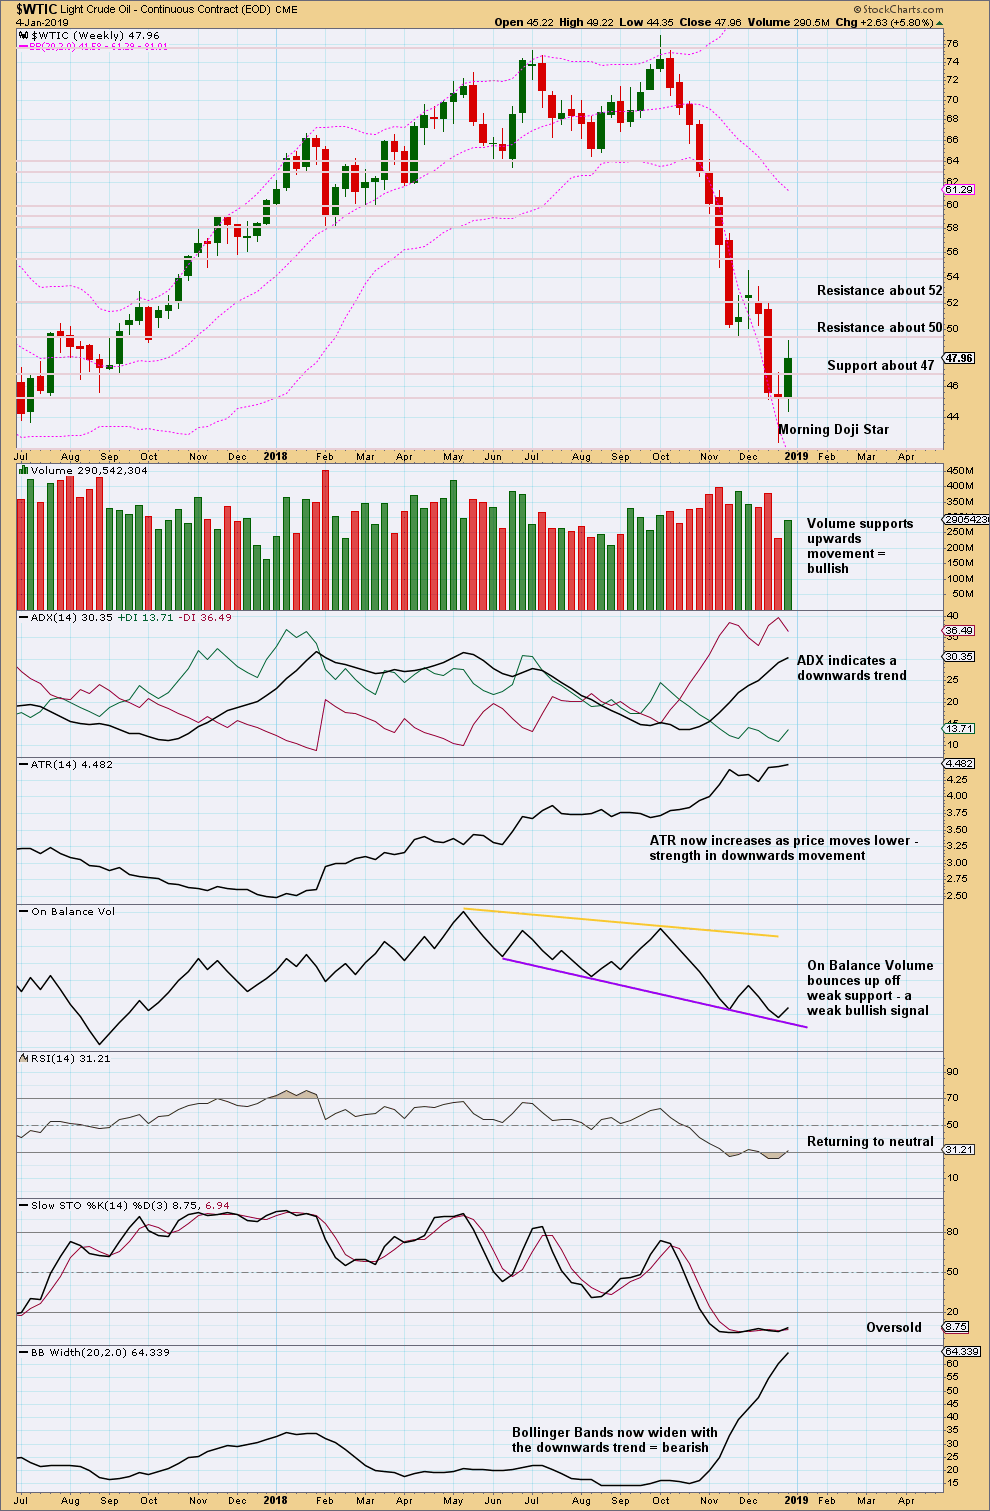
Last week’s end of week US Oil analysis expected a bounce or sideways consolidation had begun. An upwards week this week fits this expectation perfectly.
Summary: A bounce or sideways consolidation for a few weeks is now expected to continue. The target is about 63.71.
A breach of the best fit channel and a Morning Doji Star candlestick pattern on the weekly chart add support to this view.
The larger picture still sees Oil in a new downwards trend to end reasonably below 26.06.
MAIN ELLIOTT WAVE COUNT
MONTHLY CHART
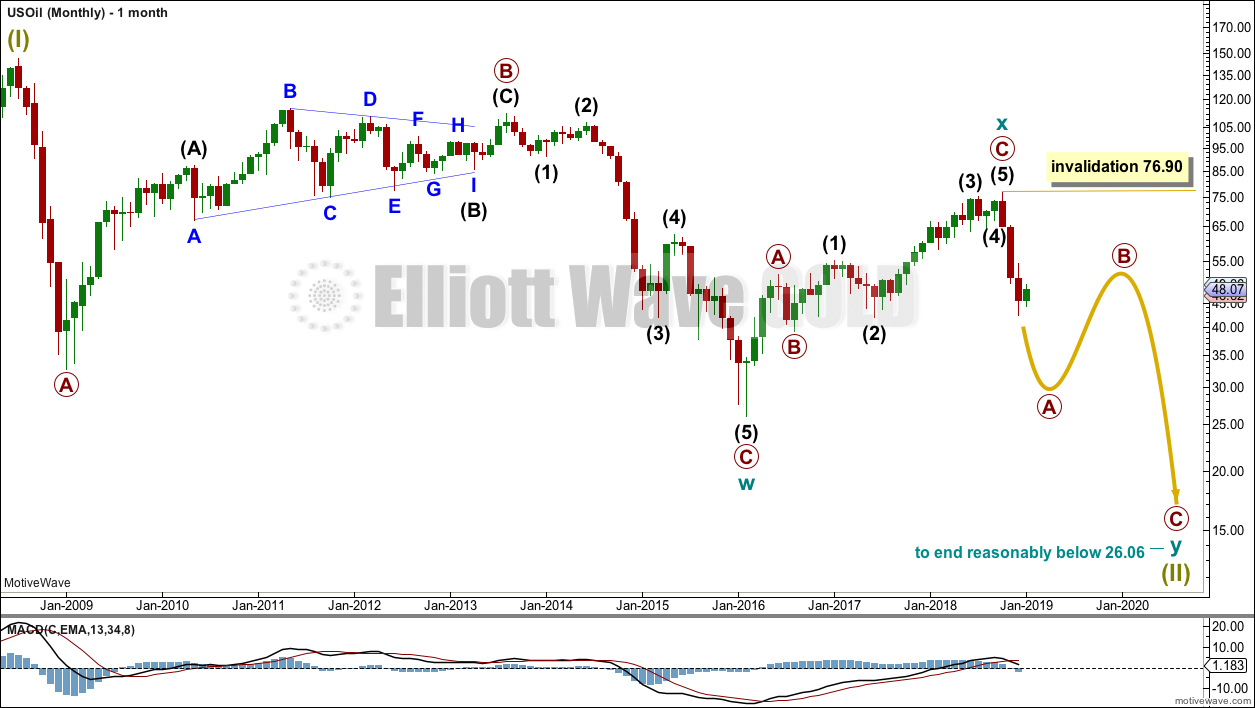
Click chart to enlarge.
Classic technical analysis favours a bearish wave count for Oil at this time.
The large fall in price from the high in June 2008 to February 2016 is seen as a complete three wave structure. This large zigzag may have been only the first zigzag in a deeper double zigzag.
The first zigzag down is labelled cycle wave w. The double is joined by a now complete three in the opposite direction, a zigzag labelled cycle wave x.
The purpose of a second zigzag in a double is to deepen the correction when the first zigzag does not move price deep enough. Cycle wave y would be expected to move reasonably below the end of cycle wave w to deepen the correction. Were cycle wave y to reach equality with cycle wave w that takes Oil into negative price territory, which is not possible. Cycle wave y would reach 0.618 the length of cycle wave w at $2.33.
A better target calculation would be using the Fibonacci ratios between primary waves A and C within cycle wave y. This cannot be done until both primary waves A and B are complete.
Within cycle wave y, no second wave correction nor B wave may move beyond its start above 76.90.
WEEKLY CHART
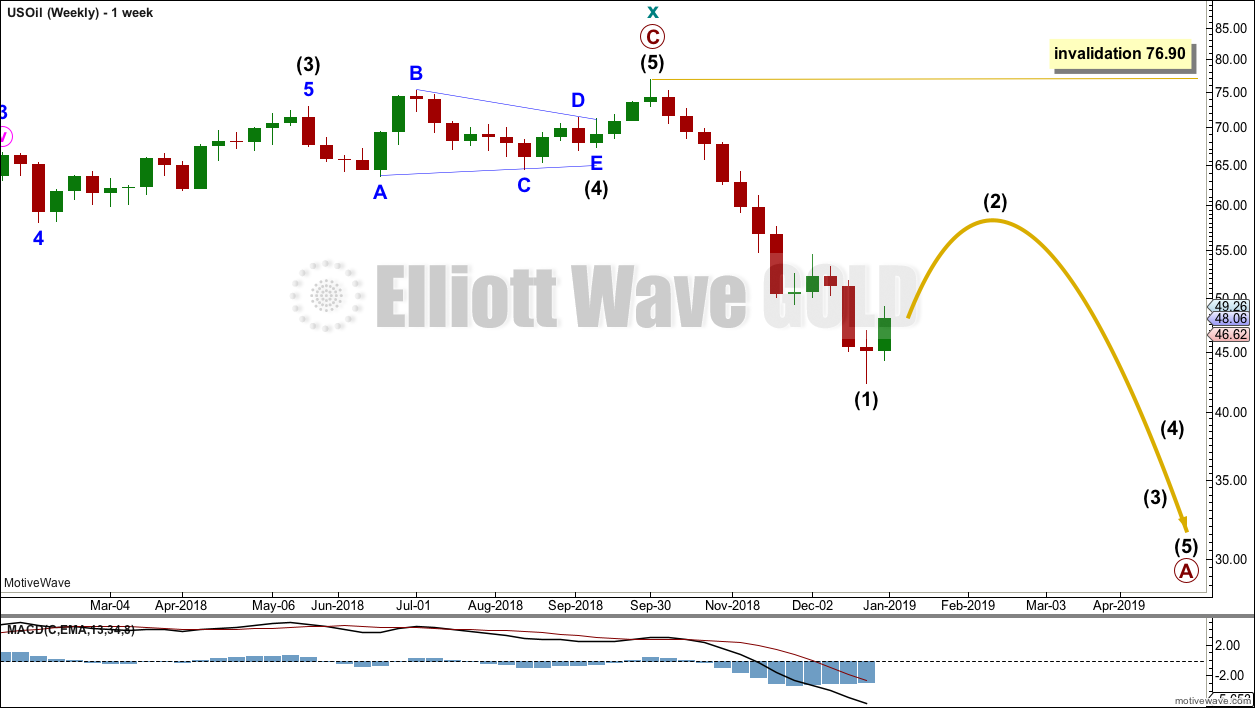
Click chart to enlarge.
This weekly chart is now focussed on the start of cycle wave y.
Cycle wave y is expected to subdivide as a zigzag. A zigzag subdivides 5-3-5. Primary wave A must subdivide as a five wave structure if this wave count is correct.
Within primary wave A, intermediate wave (1) may now be complete. Intermediate wave (2) may unfold over a few weeks as a sideways choppy consolidation, or a deep sharp bounce.
Intermediate wave (2) may not move beyond the start of intermediate wave (1) above 76.90.
DAILY CHART
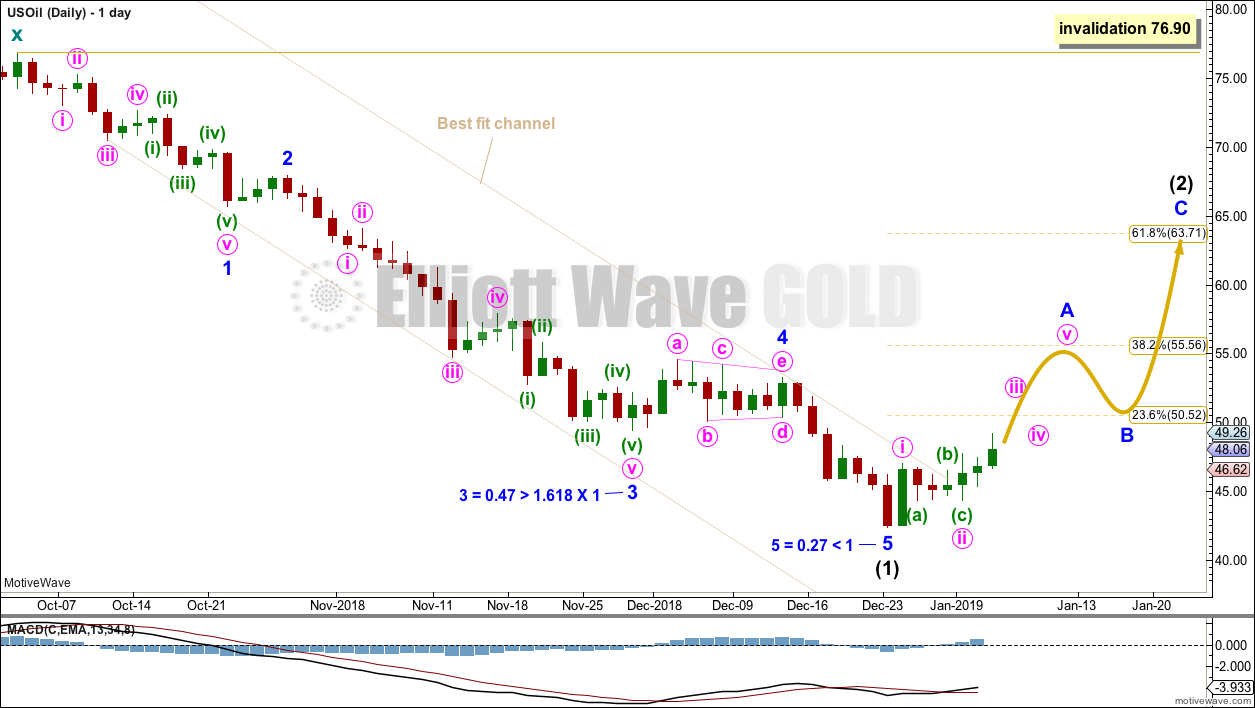
Click chart to enlarge.
Intermediate wave (2) would most likely subdivide as a zigzag and at this stage that is how it will be labelled. However, it may also subdivide as a flat or combination. It is impossible at this stage to know which structure it will unfold as. The labelling within it will most likely change as it unfolds.
If intermediate wave (2) is unfolding as a zigzag, then within it minor wave A must subdivide as a five wave structure. Within minor wave A, minute waves i and ii may be complete. Minute wave iii has now moved above the end of minute wave i. When minute wave iv unfolds it must remain above minute wave i price territory at 47.00.
For the very short term, no invalidation points within intermediate wave (2) are given on this chart because it is not possible to know which structure may be unfolding. Flexibility is essential when corrections unfold.
Intermediate wave (2) may be very deep. It should last at least four weeks, so that it shows up on the monthly chart.
Intermediate wave (2) may not move beyond the start of intermediate wave (1) above 76.90.
TECHNICAL ANALYSIS
MONTHLY CHART
Click chart to enlarge. Chart courtesy of StockCharts.com.
Lower volume and a slightly bullish long lower wick for December add a little support to the Elliott wave count.
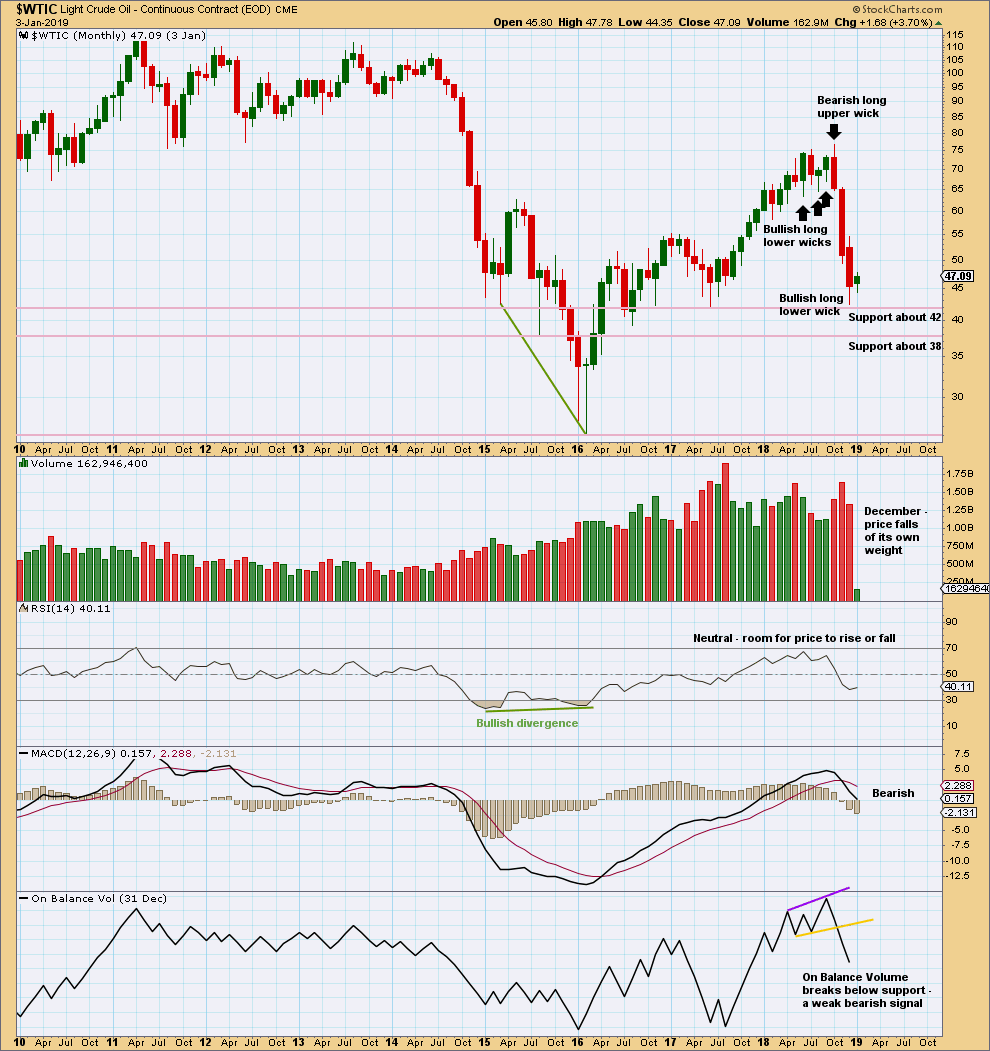
WEEKLY CHART
Click chart to enlarge. Chart courtesy of StockCharts.com.
The Morning Doji Star is a bullish reversal pattern. With support from volume for the upwards week, this adds confidence that a low may be in place at least for the short to mid term.
DAILY CHART
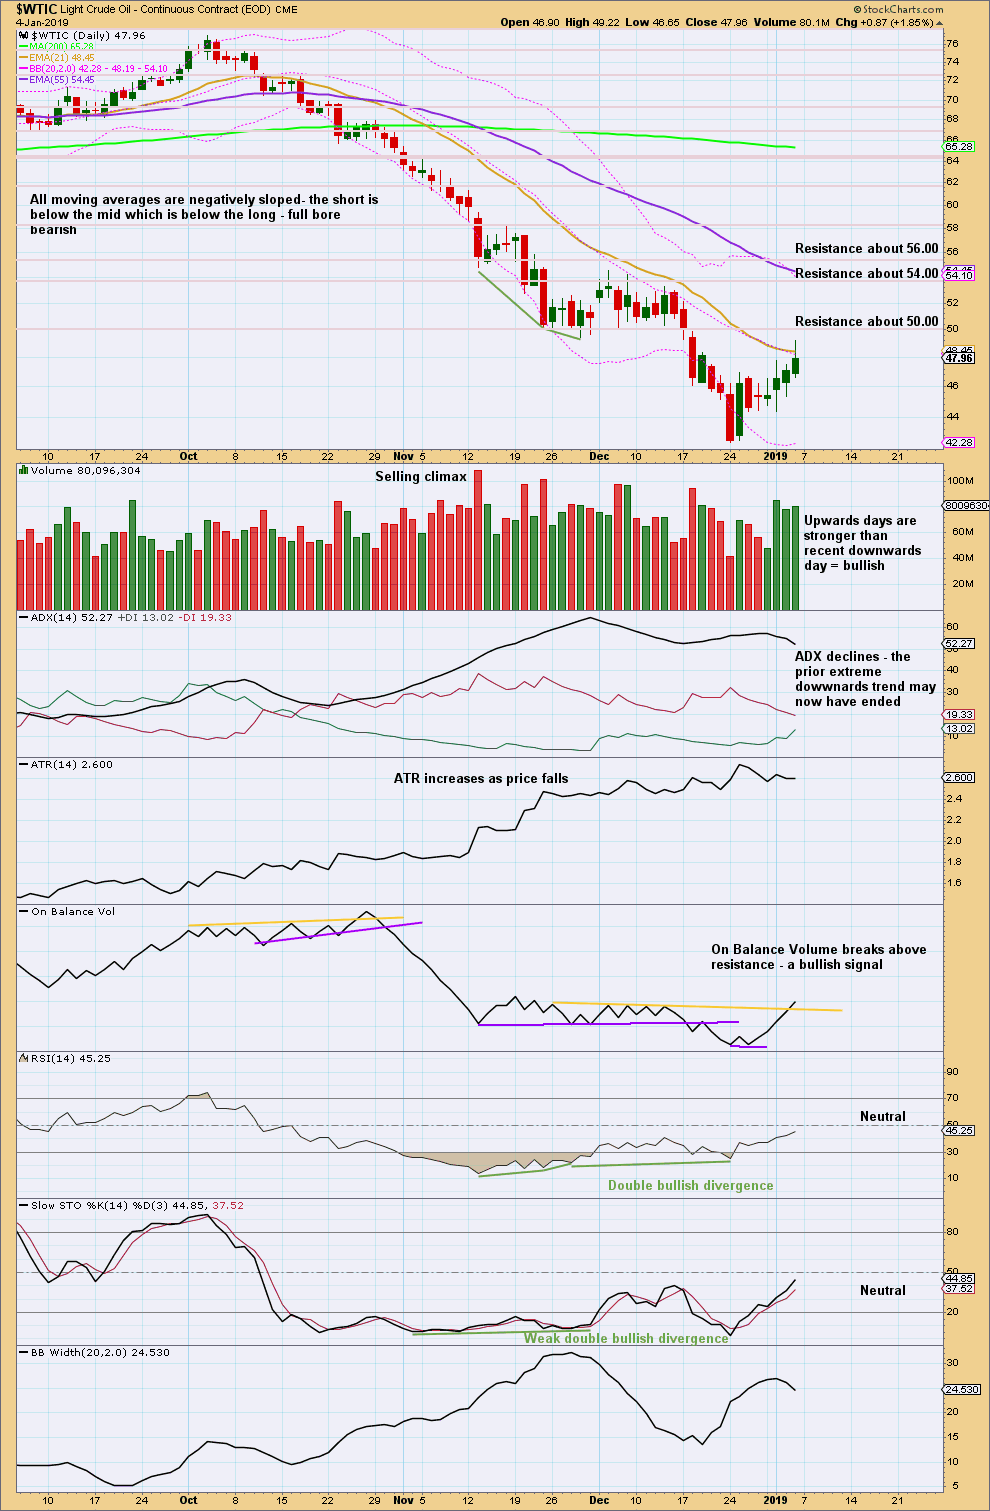
Click chart to enlarge. Chart courtesy of StockCharts.com.
This chart overall supports the Elliott wave count.
—
Always practice good risk management as the most important aspect of trading. Always trade with stops and invest only 1-5% of equity on any one trade. Failure to manage risk is the most common mistake new traders make.
Lara,
Have you studied Positive and Negative RSI divergences ever? Example in link below
http://www.stock-charts-made-easy.com/positive-divergence.html
Bill,
Do you follow Andrew Cardwell’s RSI range and range shift rules? He deals extensively with these divergences that he calls positive and negative reversals instead of divergences. He also claims that bullish divergences occur in and confirm bear markets and bearish divergences occur in and confirm a bull markets.
I note this often in my analysis.
I have learned that it seems to be more reliable when the divergence between price points is closer together than the example given on your chart. It seems to also be more reliable after RSI has reached extreme.
There is an example on my weekly chart from April to June 2017. The red trend lines are pointing it out.
Hi Lara,
Hmmm…. The AD line is very strong…. It looks it is going to make a new high before the S&P 500 and this bull market might last into 2020… I am starting to question the current count since it might go higher than 3477. What are your thoughts?
Sincerely,
Mathieu
The AD line makes no comment on price targets.
It is still well below its last all time high in September 2018.
But I will be taking the time to start with a blank chart and see what kind of alternate I can come up with.
This bull market is ageing. It’s very old now. It will end.
I agree… But surprising left field things can happen… These are the gifts that keep us interested in the markets every day.
Thanks
Mathieu
True. Too many times I’ve become too confident in a wave count only to have it invalidated.
It’s really frustrating.
I wouldn’t quite call it a gift though…. I’d call it… something else entirely 🙂