
Price remains range bound and strong support continues to hold. Price points for support and resistance are identified. A breakout is required for confidence in the next trend.
Summary: A new high on an upwards day with support from volume would be a classic upwards breakout. If that happens, then the target is at 1,338 (Elliott wave) or 1,375 (classic analysis).
A new low now below 1,302.62 would indicate a high may be in place.
Some indication of a trend change is seen by a weak bearish engulfing reversal pattern and closure of the last gap.
For reasonable confidence in a trend change the remaining things may be seen:
1. A new low below 1,302.62.
2. A breach of the blue channel on the daily chart.
Once a trend change is indicated, then a new wave down to last years may be expected to make new lows below 1,046.27.
New updates to this analysis are in bold.
Grand SuperCycle analysis is here.
Last historic analysis with monthly charts is here.
MAIN ELLIOTT WAVE COUNT
WEEKLY CHART – TRIANGLE
Click chart to enlarge.
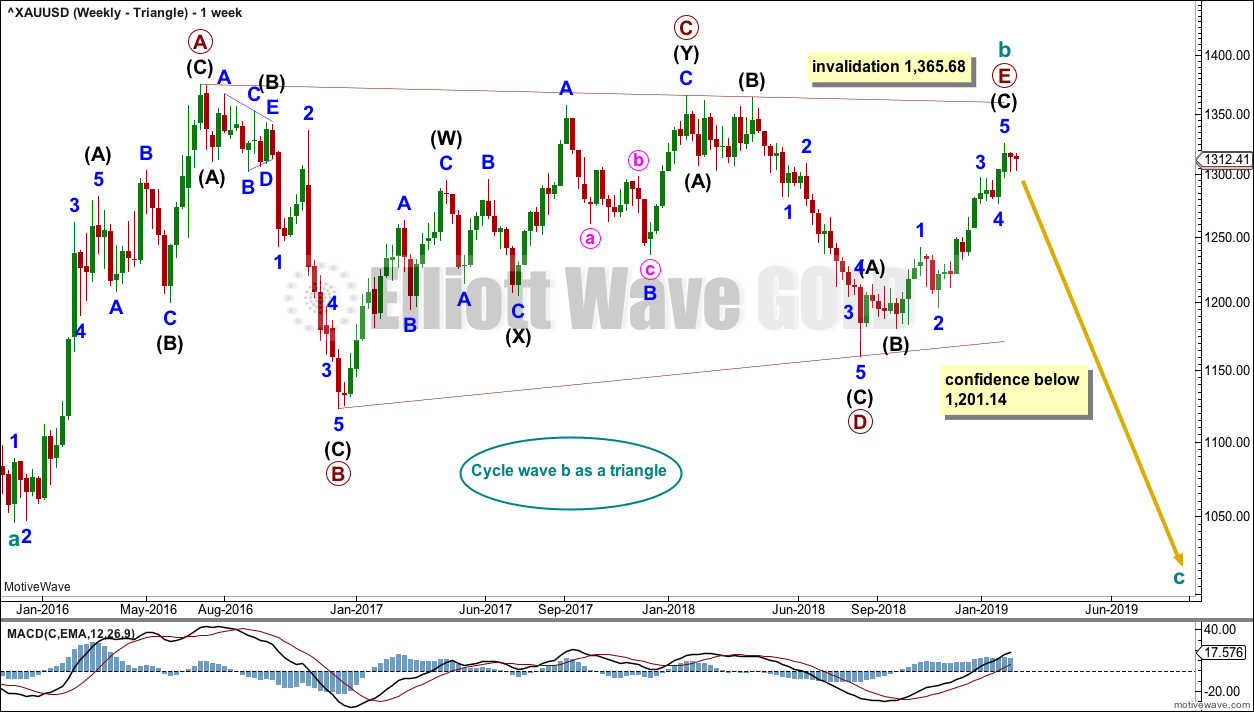
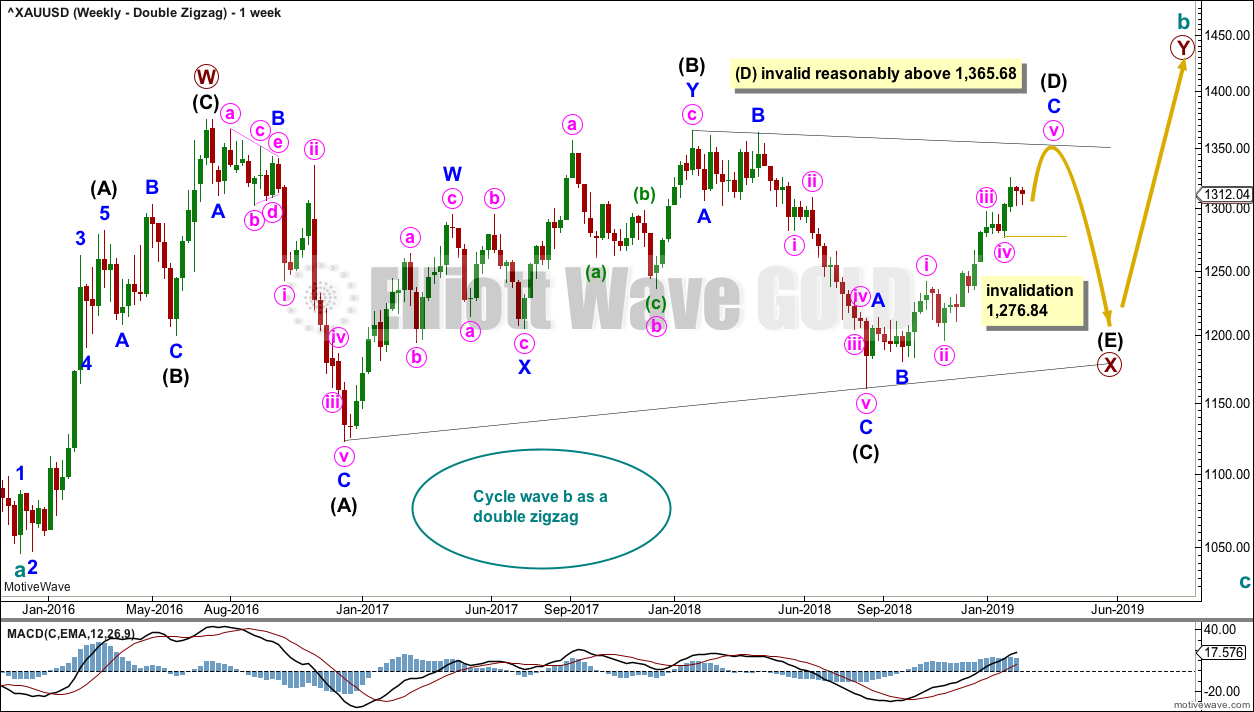
Cycle wave b may be a complete regular contracting triangle. If it continues further, then primary wave E may not move beyond the end of primary wave C above 1,365.68.
Within primary wave E, intermediate waves (A) and (B) may be complete. Intermediate wave (C) must subdivide as a five wave structure.
Four of the five sub-waves of a triangle must be zigzags, with only one sub-wave allowed to be a multiple zigzag. Wave C is the most common sub-wave to subdivide as a multiple, and this is how primary wave C for this example fits best. Primary wave E looks like it is unfolding as a single zigzag.
There are no problems in terms of subdivisions or rare structures for this wave count. It has an excellent fit and so far a typical look.
This wave count would now expect a cycle degree trend change. Cycle wave c would most likely make new lows below the end of cycle wave a at 1,046.27 to avoid a truncation.
It is possible now that primary wave E could have been over the last high. Some reasonable weakness should be expected at its end. Triangles often end with declining ATR, weak momentum and weak volume.
If this weekly wave count is correct, then cycle wave c downwards should develop strength, ATR should show some increase, and MACD should exhibit an increase in downwards momentum.
DAILY CHART – TRIANGLE
Click chart to enlarge.
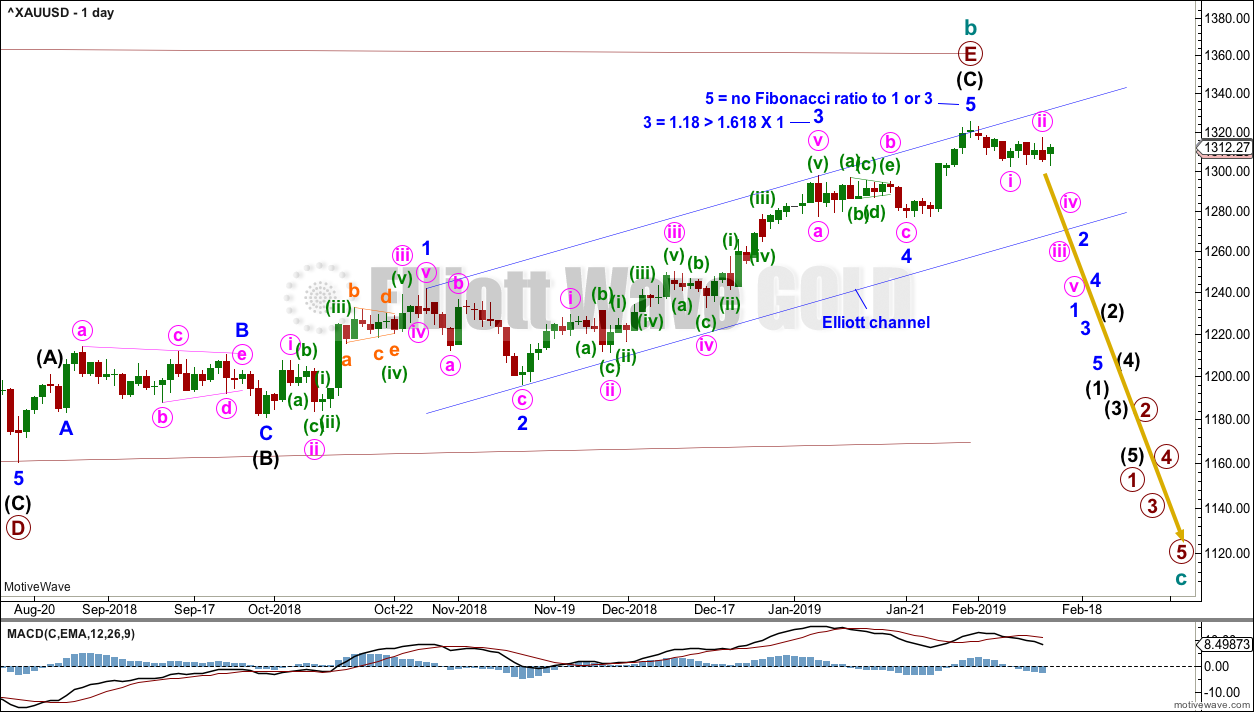
Primary wave E should subdivide as a zigzag. Intermediate waves (A) and (B) may now be complete. Intermediate wave (C) may be complete, but as yet there is no confidence in a high.
It is now possible to see minor wave 5 complete at the daily and hourly chart level. However, it is always safest to assume the trend remains the same until proven otherwise. For reasonable confidence in a trend change the remaining two things need to be seen:
1. A new low below 1,302.86.
2. A breach of the blue channel.
If minor wave 5 continues, then the next target is at 1,338 where minor wave 5 would reach equality in length with minor wave 1.
FIRST HOURLY CHART
Click chart to enlarge.
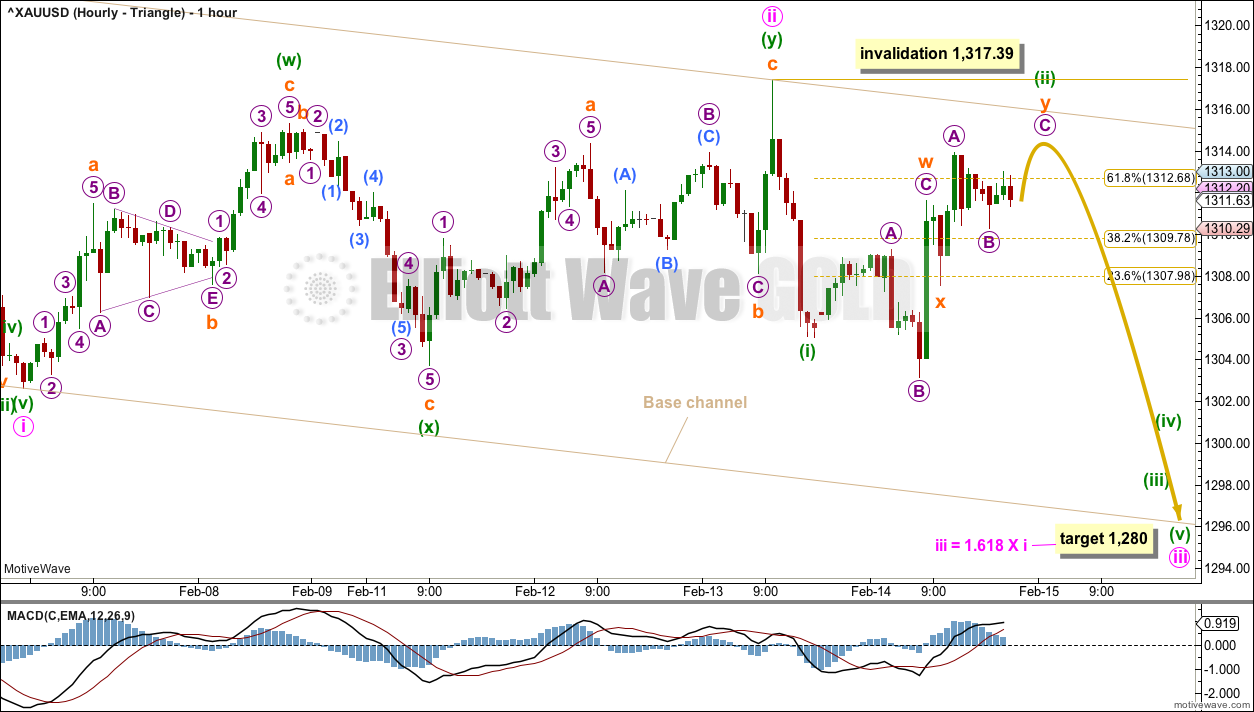
It is possible that minute wave i may have been over at the last low. This movement is labelled as a five wave impulse.
Minute wave ii may be a complete double zigzag.
Minute wave iii should have the power to break below support at the lower edge of the base channel. If price does break below this trend line, that may be taken as further indication that this wave count would be more likely than the second hourly chart below.
Minute wave iii may only subdivide as an impulse. Within minute wave iii, minuette wave (ii) may continue a little higher. At this stage, minuette wave (ii) fits as an incomplete double combination. Minuette wave (ii) may not move beyond the start of minuette wave (i) above 1,317.39.
A target is calculated for minute wave iii which expects the most common Fibonacci ratio to minute wave i.
SECOND HOURLY CHART
Click chart to enlarge.
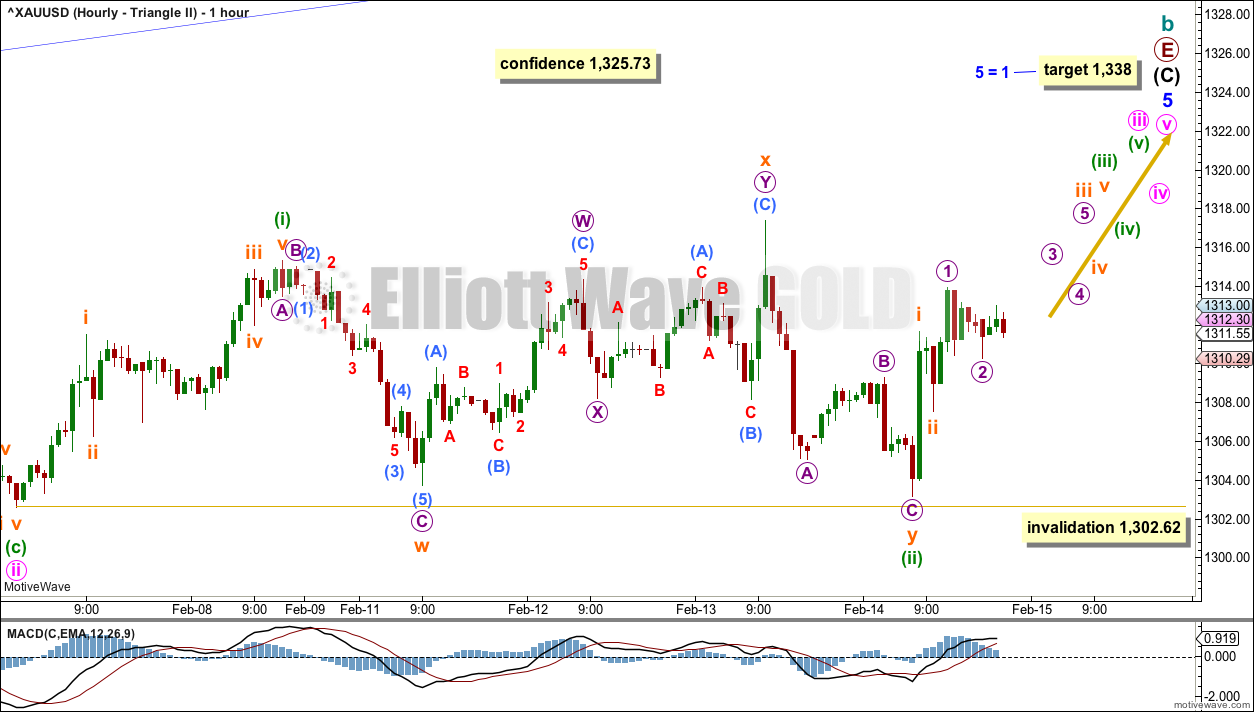
It is also possible that the last downwards wave subdivided as a three, a zigzag. This may be another correction within an ongoing upwards trend.
The target for minor wave 5 to end remains the same.
Within minor wave 5, minute waves i and ii may be complete. Within minute wave iii, minuette waves (i) and (ii) may be complete.
Minuette wave (ii) may have moved a little lower today as a double zigzag.
There may now be two overlapping first and second waves to the upside, suggesting a strong increase in upwards momentum may begin soon.
Minuette wave (ii) may not move beyond the start of minuette wave (i) below 1,302.62.
WEEKLY CHART – DOUBLE ZIGZAG
Click chart to enlarge.
It is possible that cycle wave b may be a double zigzag or a double combination.
The first zigzag in the double is labelled primary wave W. This has a good fit.
The double may be joined by a corrective structure in the opposite direction, a triangle labelled primary wave X. The triangle would be about three quarters complete.
Within the triangle of primary wave X, intermediate wave (C) should be complete. Within intermediate wave (D), minor waves A and B may be complete. Minor wave C must subdivide as a five wave structure. Within minor wave C, minute wave iv should now be over. Within minute wave v, no second wave correction may move beyond its start below 1,276.84.
Intermediate wave (D) would most likely subdivide as a single zigzag. Intermediate wave (D) should end at the upper (B)-(D) trend line for this wave count, so that the triangle adheres neatly to this trend line. That price point is about 1,352. This wave count now requires upwards movement to continue. It would not be acceptable for the upper (B)-(D) trend line to have breaches or substantial overshoots. Elliott wave triangles almost always adhere very neatly to their trend lines.
Intermediate wave E should continue to exhibit weakness: ATR should continue to show a steady decline, and MACD may begin to hover about zero.
This wave count may now expect choppy overlapping movement in an ever decreasing range for a few more months.
Primary wave Y would most likely be a zigzag because primary wave X would be shallow; double zigzags normally have relatively shallow X waves.
Primary wave Y may also be a flat correction if cycle wave b is a double combination, but combinations normally have deep X waves. This would be less likely.
This wave count has good proportions and no problems in terms of subdivisions.
WEEKLY CHART – ALTERNATE BULLISH
Click chart to enlarge.
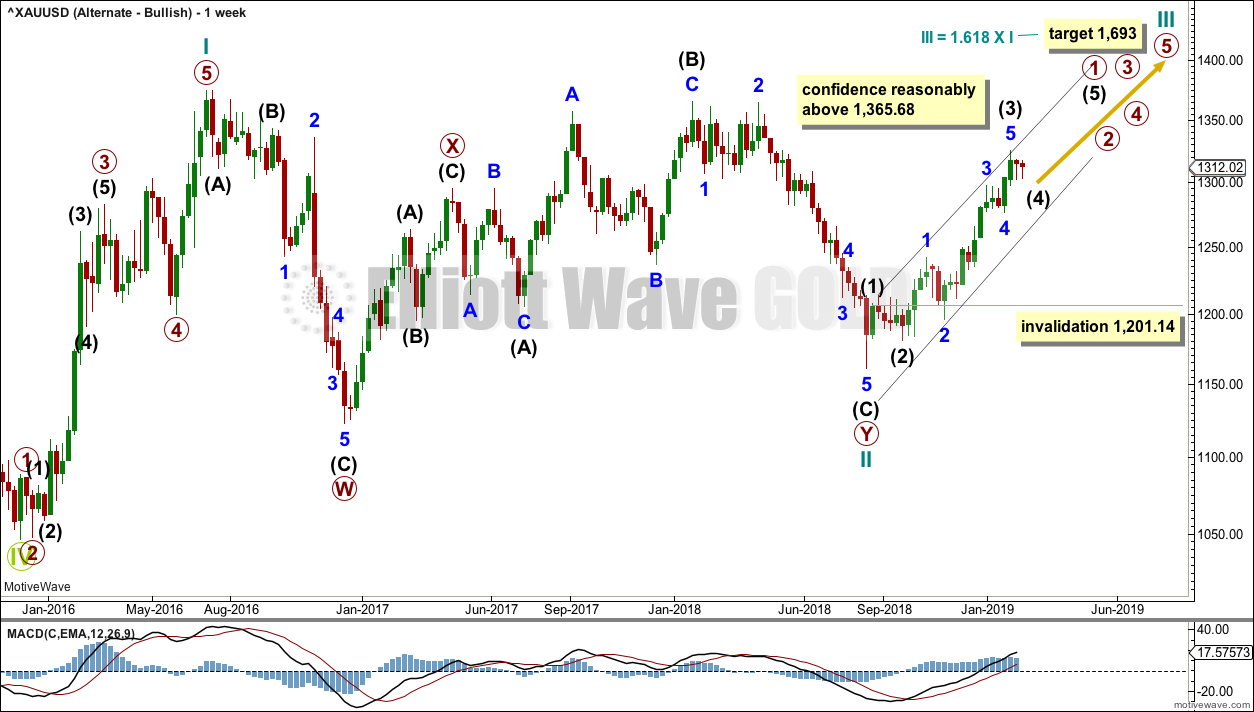
Because the preferred wave count is at a critical juncture in expecting a cycle degree trend change, it is time to consider an alternate which expects the continuation of the current upwards trend.
It is possible that the low in December 2015 was the end of a bear market and that Gold has been in a basing action for the past three years. Downwards movement to that low will subdivide as a double zigzag, a corrective structure.
If Gold is in a new bull market, then it should begin with a five wave structure upwards on the weekly chart. However, the biggest problem with this wave count is the structure labelled cycle wave I because this wave count must see it as a five wave structure, but it looks more like a three wave structure.
Commodities often exhibit swift strong fifth waves that force the fourth wave corrections coming just prior to be more brief and shallow than their counterpart second waves. It is unusual for a commodity to exhibit a quick second wave and a more time consuming fourth wave, and this is how cycle wave I is labelled. The probability of this wave count is low due to this problem.
Cycle wave II subdivides well as a double combination: zigzag – X – expanded flat.
Cycle wave III may have begun. Within cycle wave III, primary wave 1 may be an incomplete impulse. Within primary wave 1, intermediate wave (4) may not move into intermediate wave (1) price territory below 1,201.14.
A black Elliott channel is drawn about primary wave 1. Intermediate wave (4) may find support about the lower edge.
Cycle wave III so far for this wave count would have been underway now for 25 weeks. It should be beginning to exhibit some support from volume, increase in upwards momentum and increasing ATR. However, volume continues to decline, ATR continues to decline and is very low, and momentum is weak in comparison to cycle wave I. This wave count lacks support from classic technical analysis.
TECHNICAL ANALYSIS
WEEKLY CHART
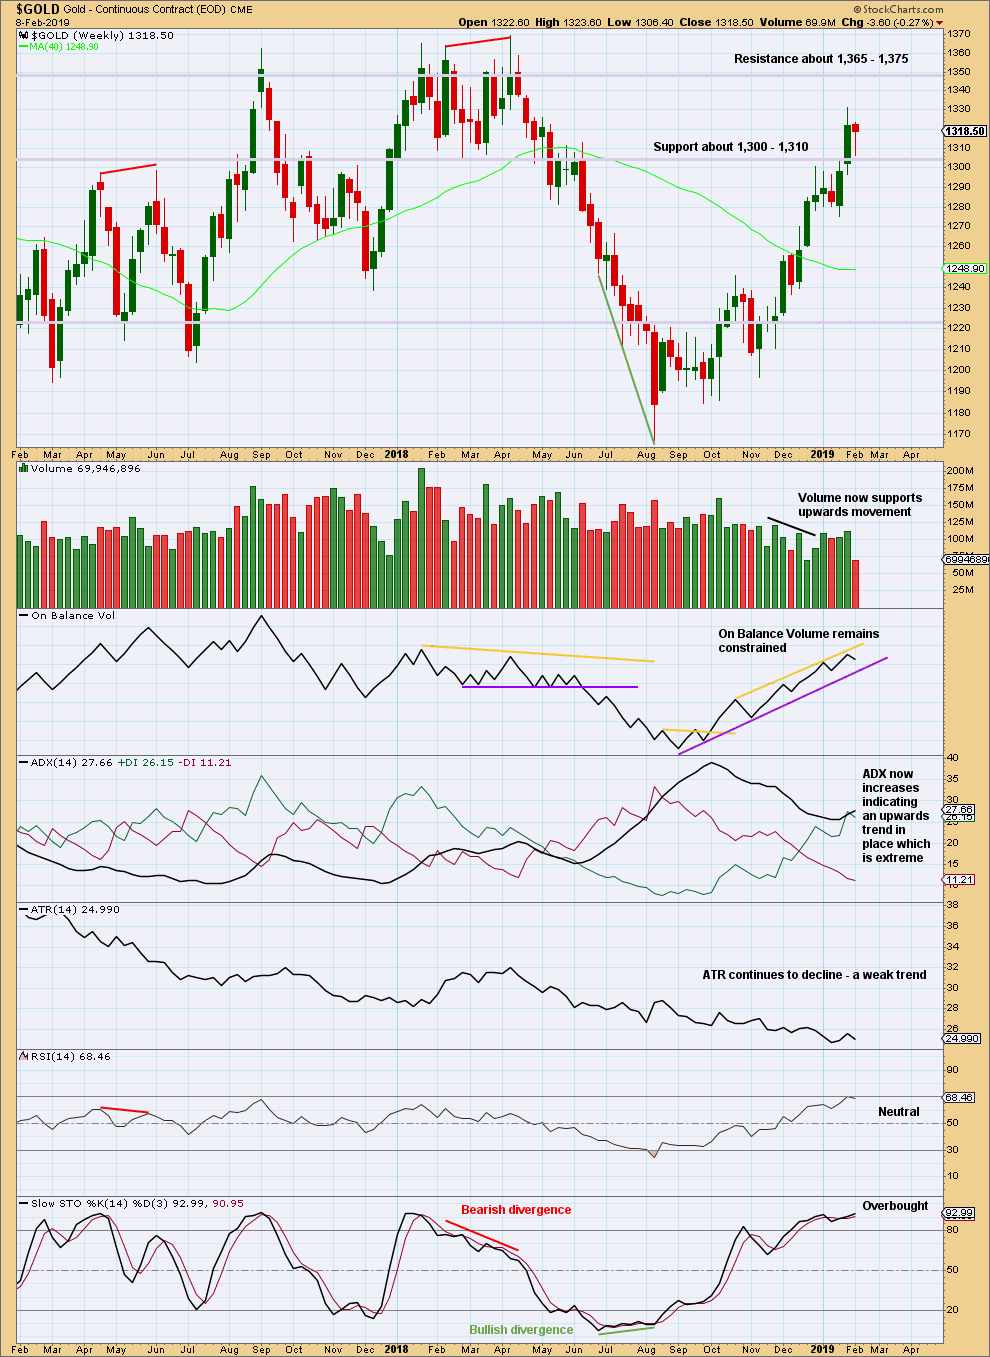
Click chart to enlarge. Chart courtesy of StockCharts.com.
Last weekly candlestick so far looks like a small correction within an ongoing upwards trend. Volume is not pushing price lower and the lower candlestick wick is bullish.
DAILY CHART
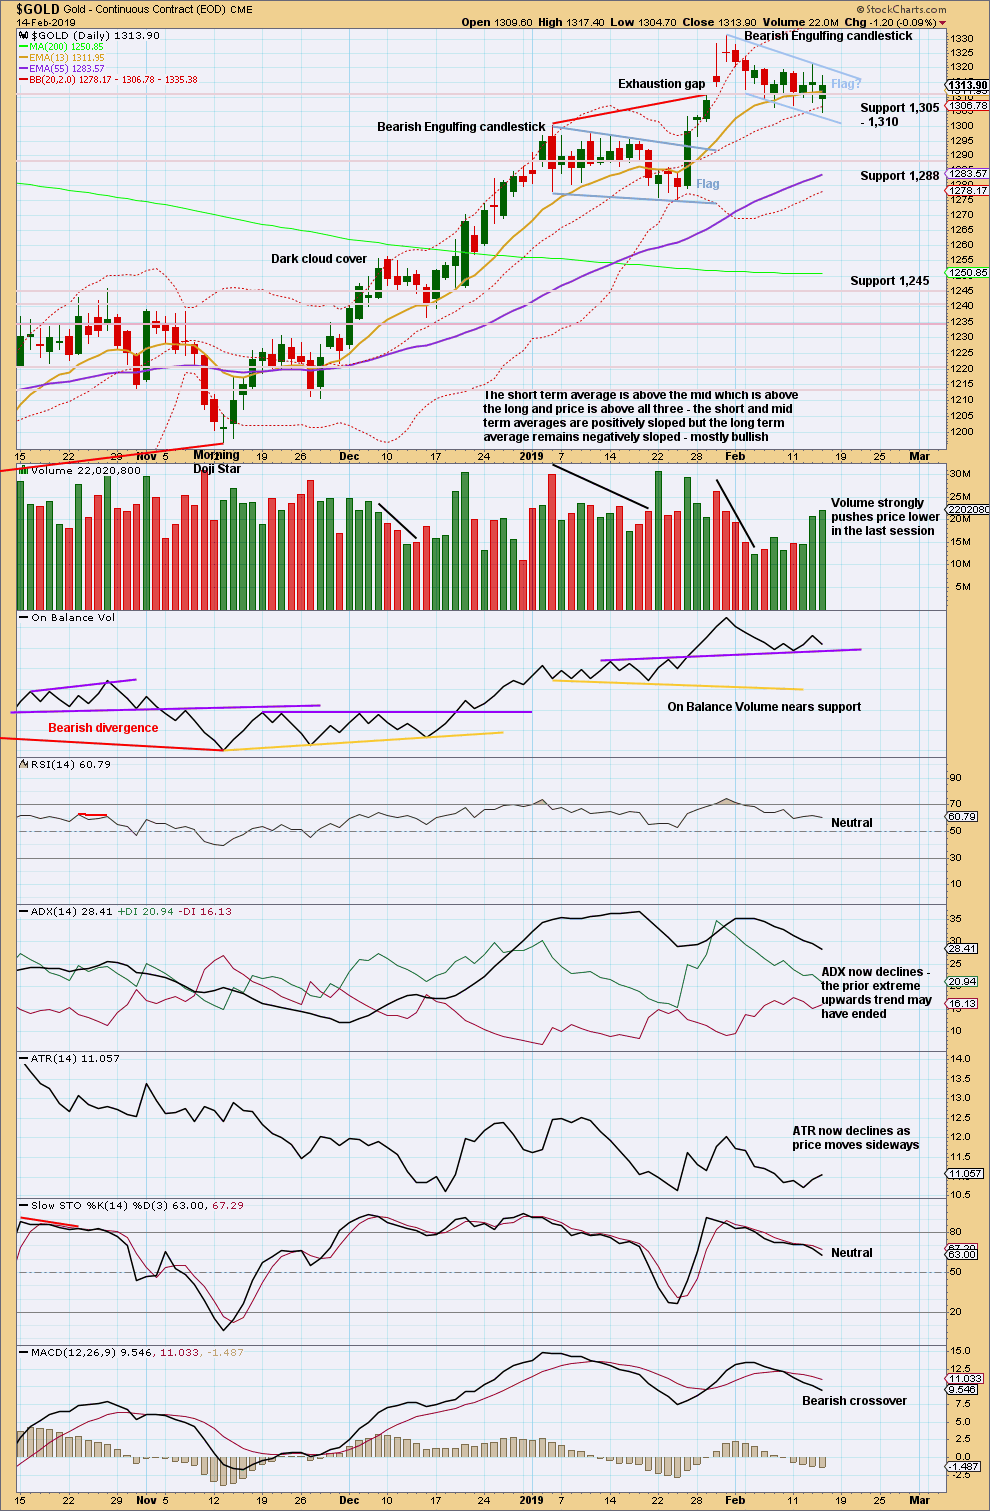
Click chart to enlarge. Chart courtesy of StockCharts.com.
At this stage, it looks like another flag pattern may be unfolding for the last ten sessions. While price remains above strong support at 1,300, it would be safest to assume that the upwards trend (as indicated on the weekly time frame) remains intact.
A target using the flag pole would be at 1,375.
GDX WEEKLY CHART
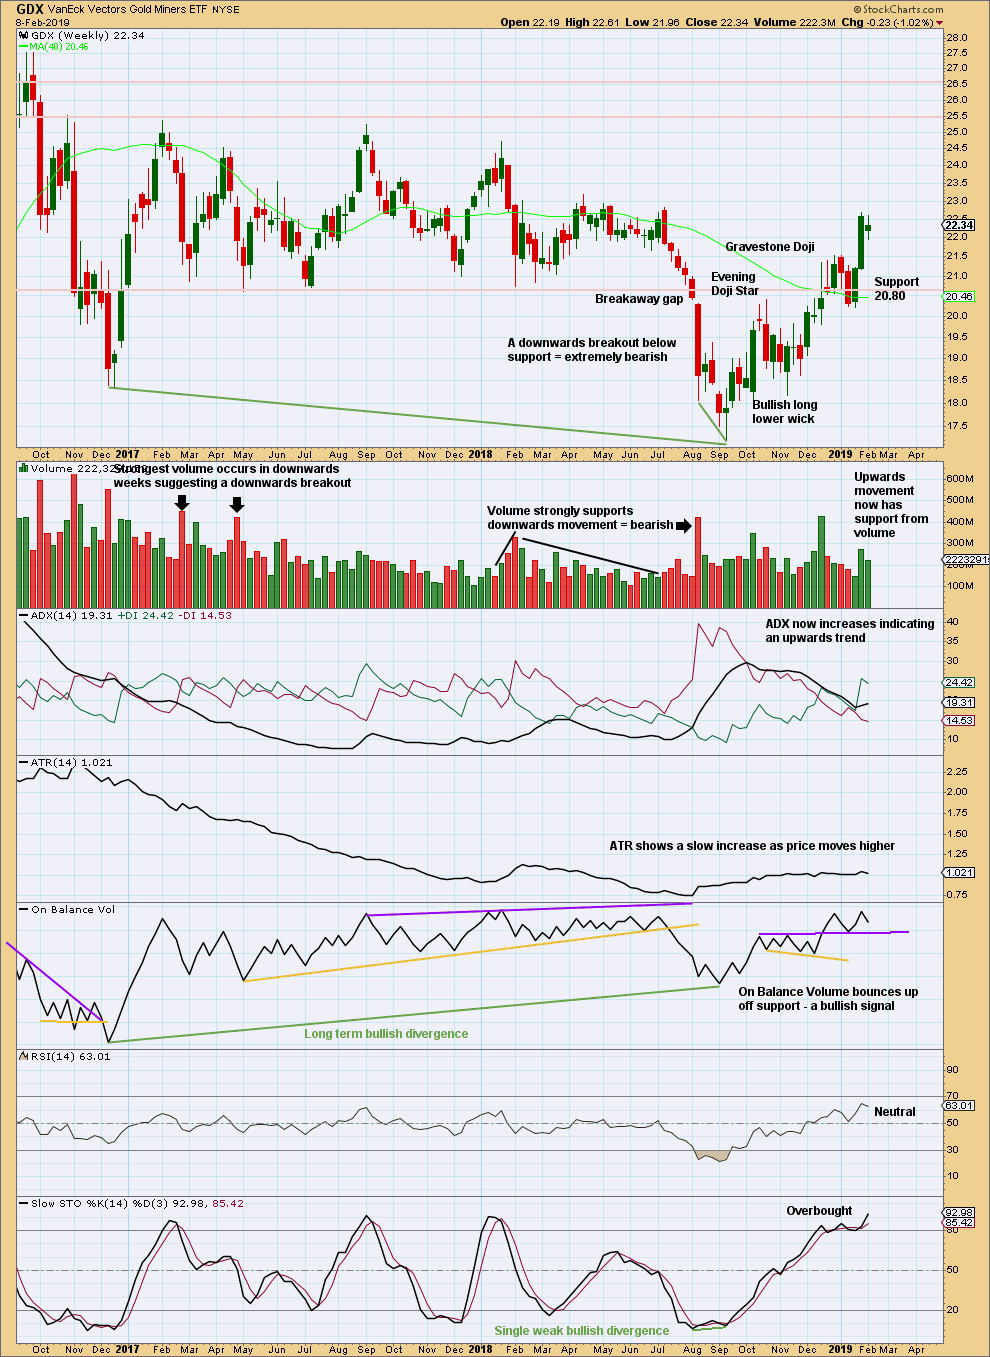
Click chart to enlarge. Chart courtesy of StockCharts.com.
A small range inside week looks like a small pause within an ongoing upwards trend at this stage.
GDX DAILY CHART
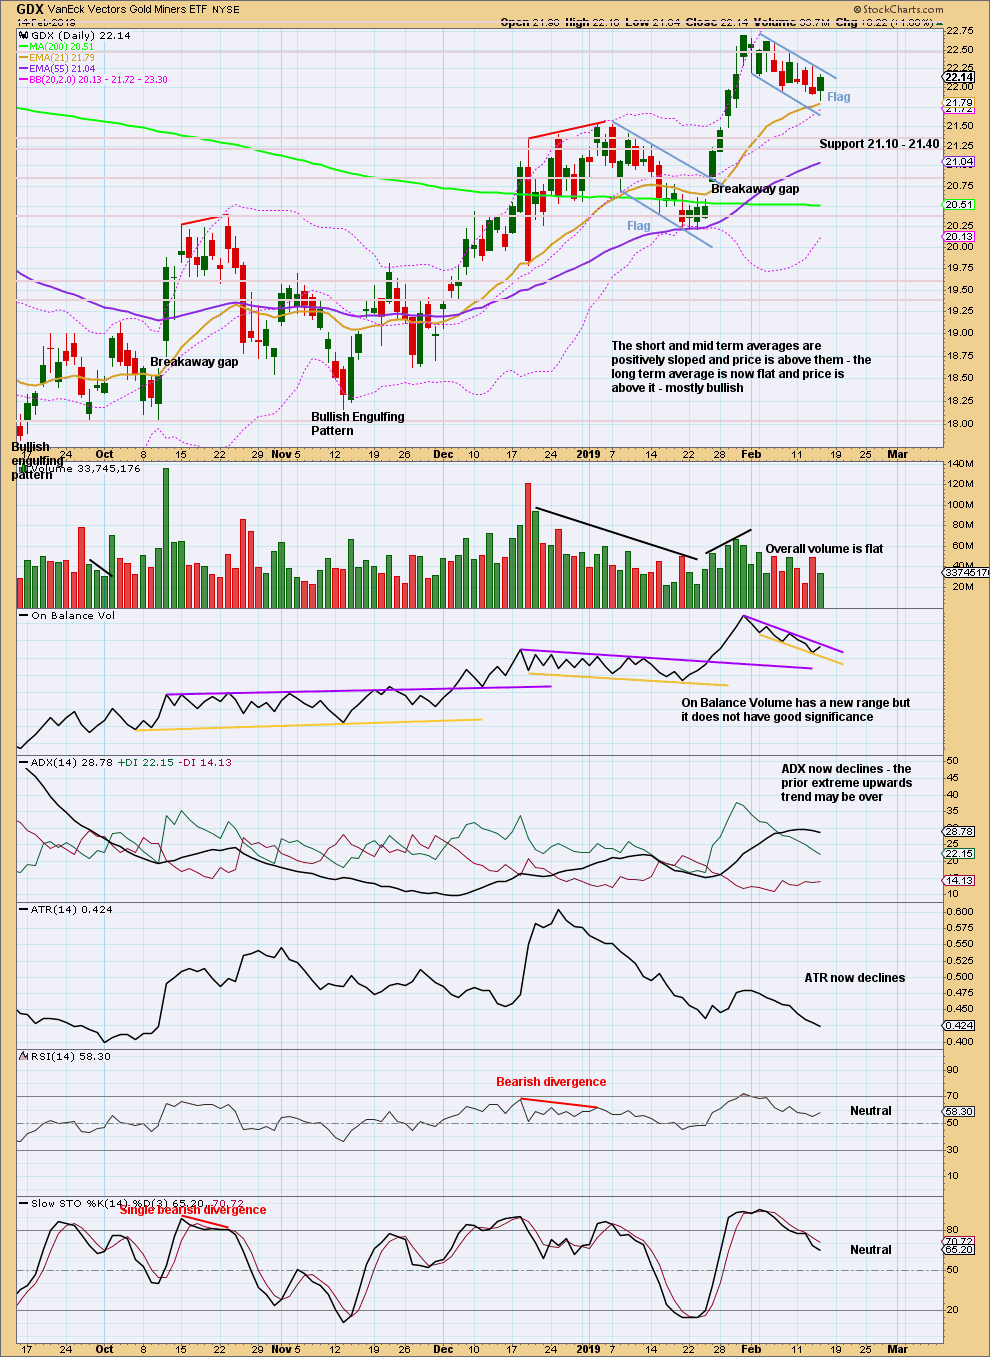
Click chart to enlarge. Chart courtesy of StockCharts.com.
With ADX now indicating the trend as extreme and RSI overbought at the high, the risk of a trend change has increased.
However, another flag pattern may be unfolding. The target would be 24.72 if price closes above the upper trend line of the flag on an upwards day that has support from volume.
Published @ 09:29 p.m. EST.
—
Careful risk management protects your trading account(s).
Follow my two Golden Rules:
1. Always trade with stops.
2. Risk only 1-5% of equity on any one trade.
First hourly chart updated:
The last and final very short term invalidation point for this wave count is the last high at 1,325.73.
Minute ii now may fit as a complete double combination: zigzag – X – flat. There is almost no room for it to move higher.
Second hourly chart updated:
If today’s upwards movement has support from volume then that would look like a classic upwards breakout from the flag pattern noted on the TA chart.
That would support this second wave count.
It still needs a new high above 1,325.73 for confidence though. But at this stage from a classic TA perspective, ignoring the Elliott wave counts, this looks more correct.
Right now is a point in time when classic TA begins to diverge from Elliott wave.