
The target using the flag pole remains the same.
Summary: The target using the flag pole is 1,375. However, this upwards movement is now overbought. This target may be too optimistic.
New updates to this analysis are in bold.
Grand SuperCycle analysis is here.
Last historic analysis with monthly charts is here.
MAIN ELLIOTT WAVE COUNT
WEEKLY CHART – TRIANGLE
Click chart to enlarge.
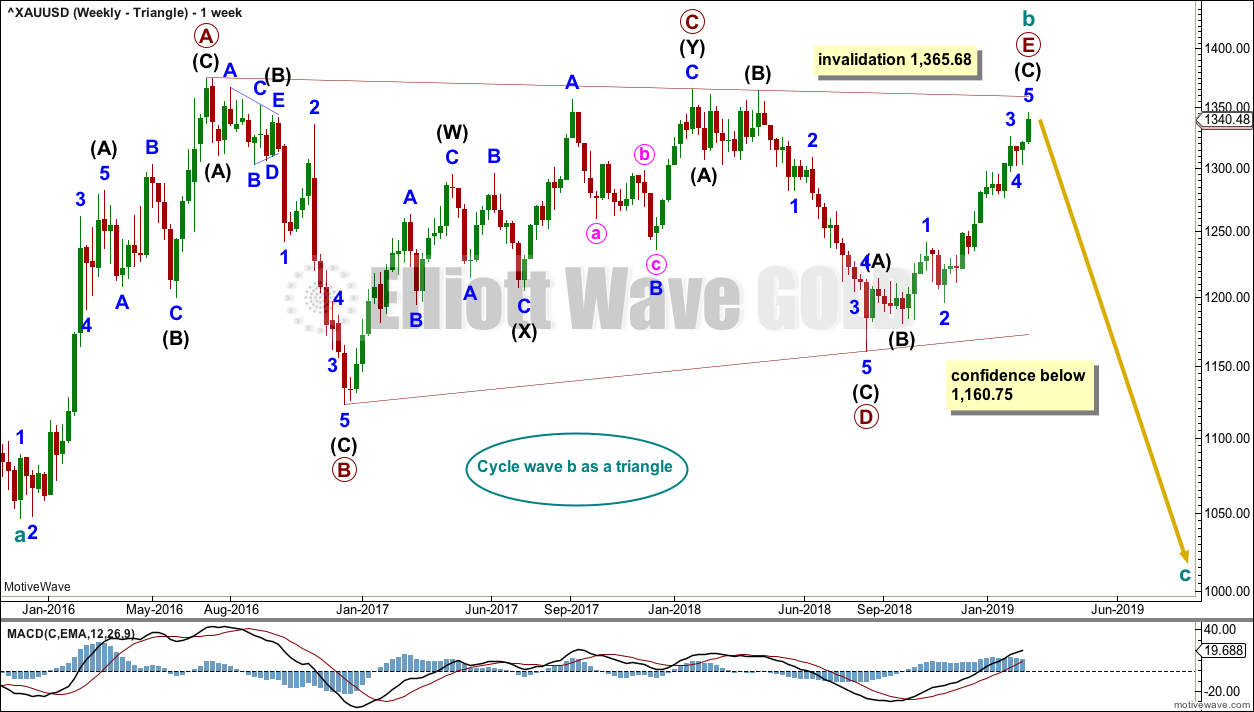
Cycle wave b may be a complete regular contracting triangle. If it continues further, then primary wave E may not move beyond the end of primary wave C above 1,365.68.
Within primary wave E, intermediate waves (A) and (B) may be complete. Intermediate wave (C) must subdivide as a five wave structure.
Four of the five sub-waves of a triangle must be zigzags, with only one sub-wave allowed to be a multiple zigzag. Wave C is the most common sub-wave to subdivide as a multiple, and this is how primary wave C for this example fits best. Primary wave E looks like it is unfolding as a single zigzag.
There are no problems in terms of subdivisions or rare structures for this wave count. It has an excellent fit and so far a typical look.
This wave count would expect a cycle degree trend change as imminent. Cycle wave c would most likely make new lows below the end of cycle wave a at 1,046.27 to avoid a truncation.
Primary wave E should exhibit reasonable weakness as it comes to an end. Triangles often end with declining ATR, weak momentum and weak volume.
If this weekly wave count is correct, then cycle wave c downwards should develop strength, ATR should show some increase, and MACD should exhibit an increase in downwards momentum.
DAILY CHART – TRIANGLE
Click chart to enlarge.
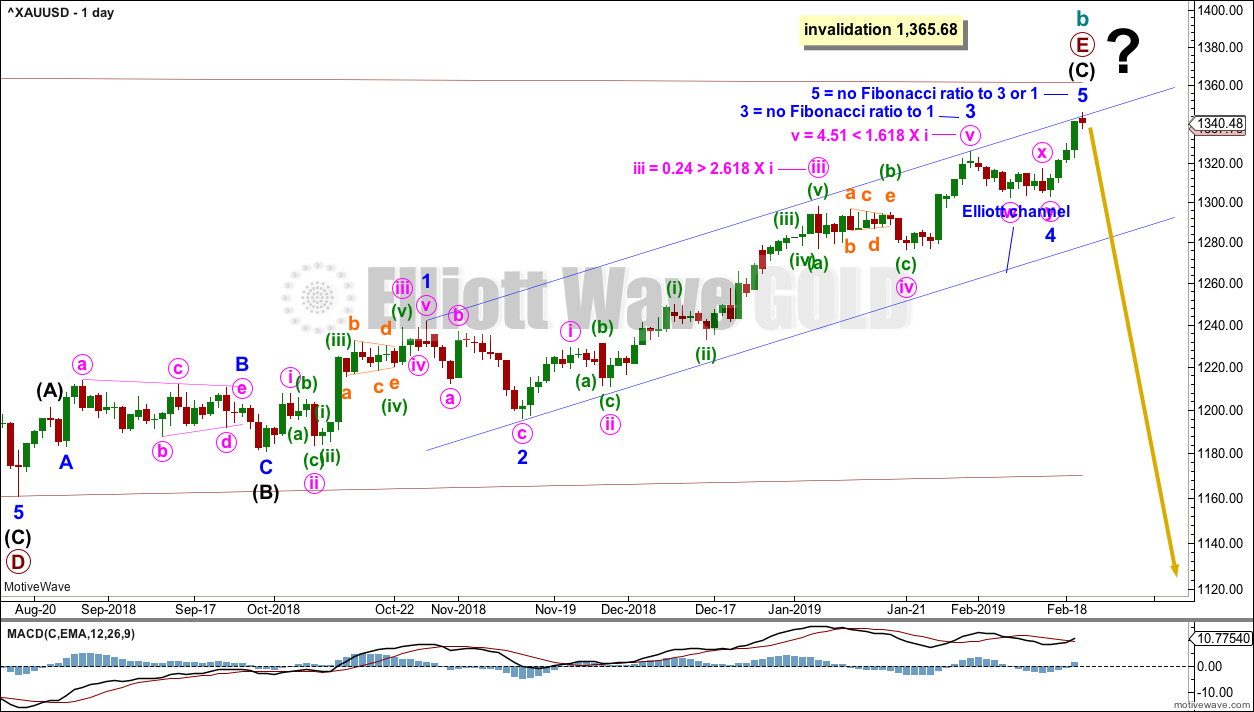
Primary wave E should subdivide as a zigzag. Intermediate waves (A) and (B) may now be complete. Intermediate wave (C) may again be complete, but there is no indication at all of a high in place.
This wave count now requires a trend change here or very soon indeed. The following things are now required for confidence in this wave count:
1. A bearish candlestick reversal pattern.
2. A new low below support at 1,300.
3. A breach of the blue channel.
HOURLY CHART
Click chart to enlarge.
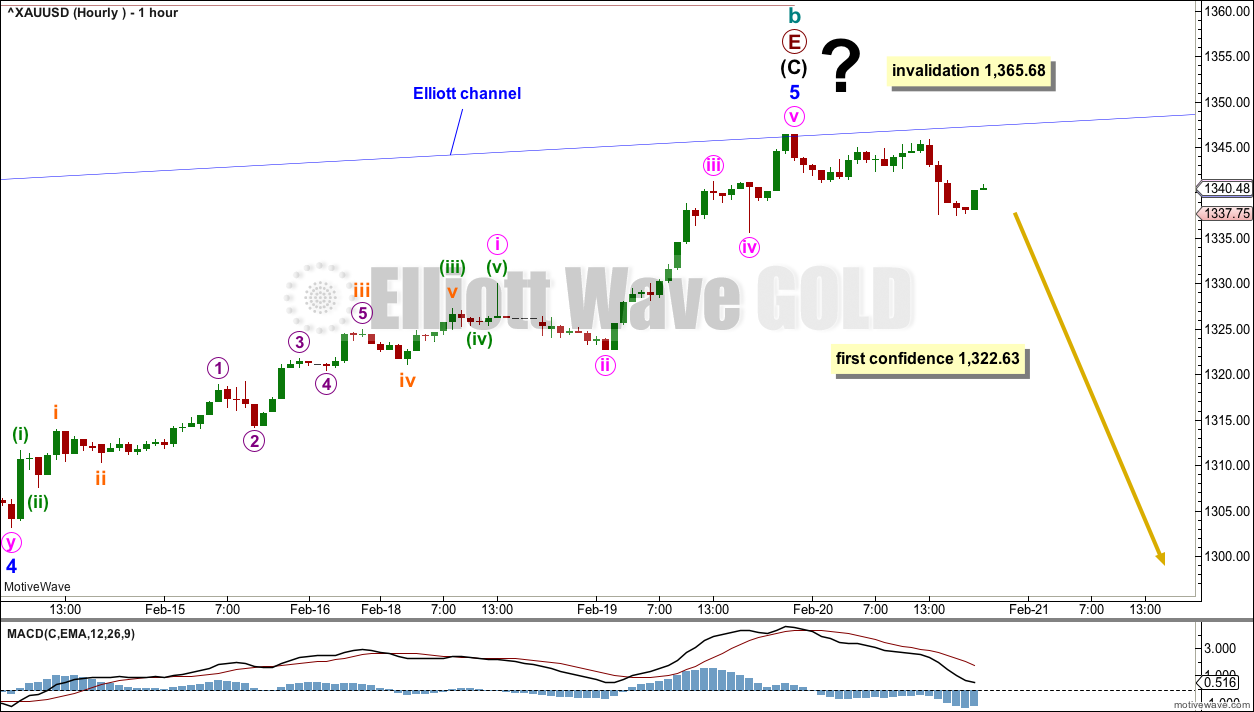
The hourly chart focusses on the strucutre of minor wave 5.
Minor wave 5 may be complete. However, there is now a big question mark over this wave count, because it now requires an imminent trend reversal and the start of a new strong downwards trend.
Earliest confidence in a trend change would come with a new short-term swing low below 1,322.63.
WEEKLY CHART – DOUBLE ZIGZAG
Click chart to enlarge.
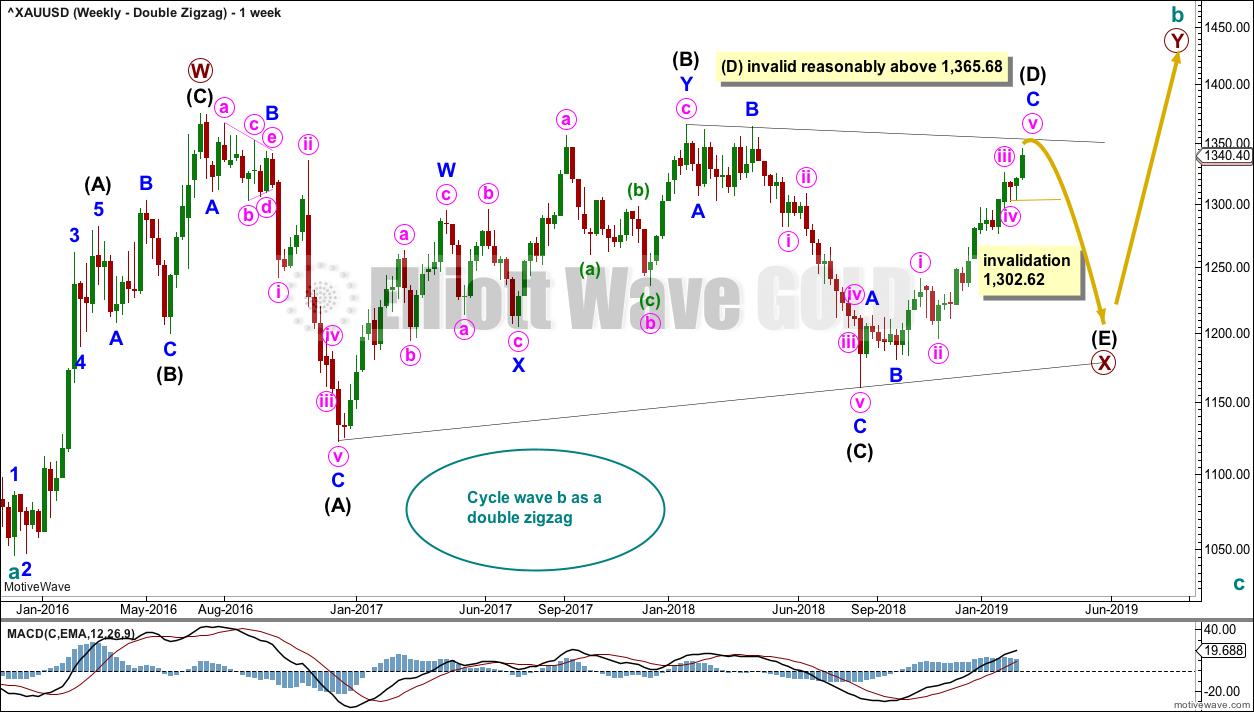
It is possible that cycle wave b may be a double zigzag or a double combination.
The first zigzag in the double is labelled primary wave W. This has a good fit.
The double may be joined by a corrective structure in the opposite direction, a triangle labelled primary wave X. The triangle would be about three quarters complete.
Within intermediate wave (D), minor waves A and B may be complete. Minor wave C must subdivide as a five wave structure. Within minor wave C, minute wave iv should now be over. Within minute wave v, no second wave correction may move beyond its start below 1,302.62.
Intermediate wave (D) would most likely subdivide as a single zigzag. Intermediate wave (D) should end at the upper (B)-(D) trend line for this wave count, so that the triangle adheres neatly to this trend line. That price point is about 1,354. This wave count now requires upwards movement to continue just a little further, although if it ended here that would now be acceptable for this wave count. Elliott wave triangles almost always adhere very neatly to their trend lines.
Intermediate wave E should continue to exhibit weakness: ATR should continue to show a steady decline, and MACD may begin to hover about zero.
This wave count may now expect choppy overlapping movement in an ever decreasing range for a few more months.
Primary wave Y would most likely be a zigzag because primary wave X would be shallow; double zigzags normally have relatively shallow X waves.
Primary wave Y may also be a flat correction if cycle wave b is a double combination, but combinations normally have deep X waves. This would be less likely.
This wave count has good proportions and no problems in terms of subdivisions.
WEEKLY CHART – ALTERNATE BULLISH
Click chart to enlarge.
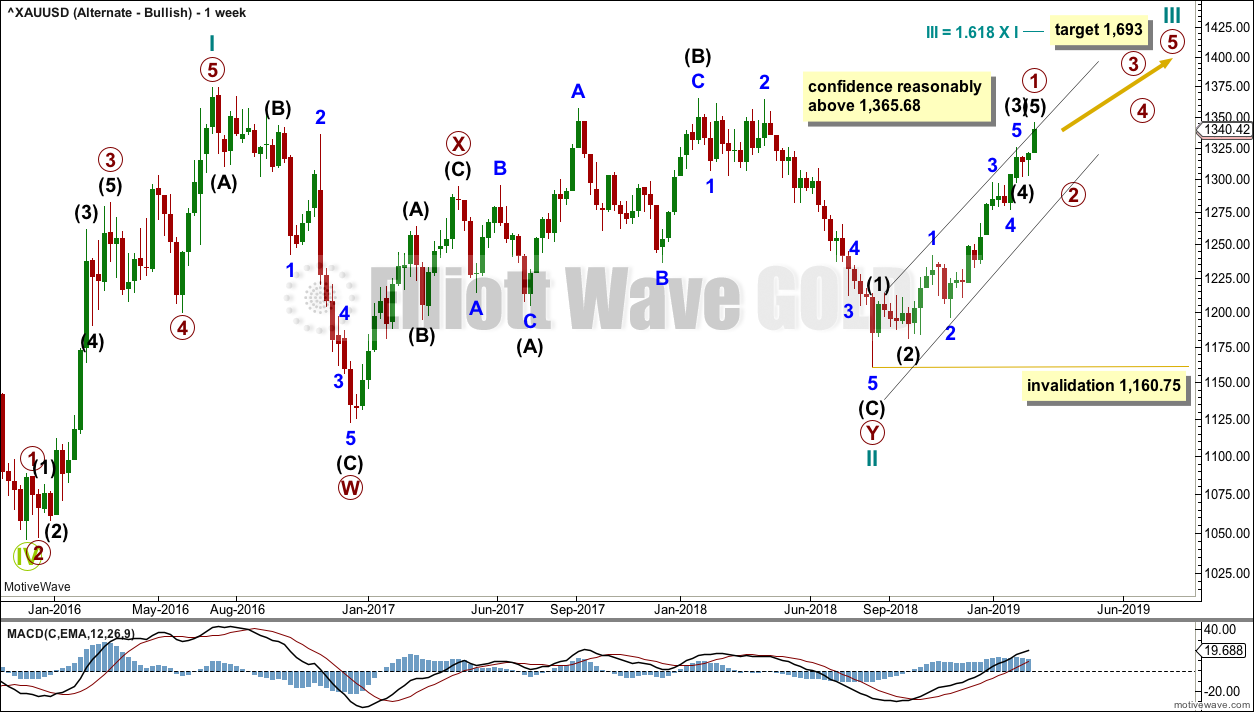
Because the preferred wave count is at a critical juncture in expecting a cycle degree trend change, it is time to consider an alternate which expects the continuation of the current upwards trend.
It is possible that the low in December 2015 was the end of a bear market and that Gold has been in a basing action for the past three years. Downwards movement to that low will subdivide as a double zigzag, a corrective structure.
If Gold is in a new bull market, then it should begin with a five wave structure upwards on the weekly chart. However, the biggest problem with this wave count is the structure labelled cycle wave I because this wave count must see it as a five wave structure, but it looks more like a three wave structure.
Commodities often exhibit swift strong fifth waves that force the fourth wave corrections coming just prior to be more brief and shallow than their counterpart second waves. It is unusual for a commodity to exhibit a quick second wave and a more time consuming fourth wave, and this is how cycle wave I is labelled. The probability of this wave count is low due to this problem.
Cycle wave II subdivides well as a double combination: zigzag – X – expanded flat.
Cycle wave III may have begun. Within cycle wave III, primary wave 1 may be close to complete, or it may be complete at today’s high. Primary wave 2 may not move beyond the start of primary wave 1 below 1,160.75.
A black Elliott channel is drawn about primary wave 1. Intermediate wave (4) may find support about the lower edge.
Cycle wave III so far for this wave count would have been underway now for 25 weeks. It should be beginning to exhibit some support from volume, increase in upwards momentum and increasing ATR. However, volume continues to decline, ATR continues to decline and is very low, and momentum is weak in comparison to cycle wave I. This wave count lacks support from classic technical analysis.
TECHNICAL ANALYSIS
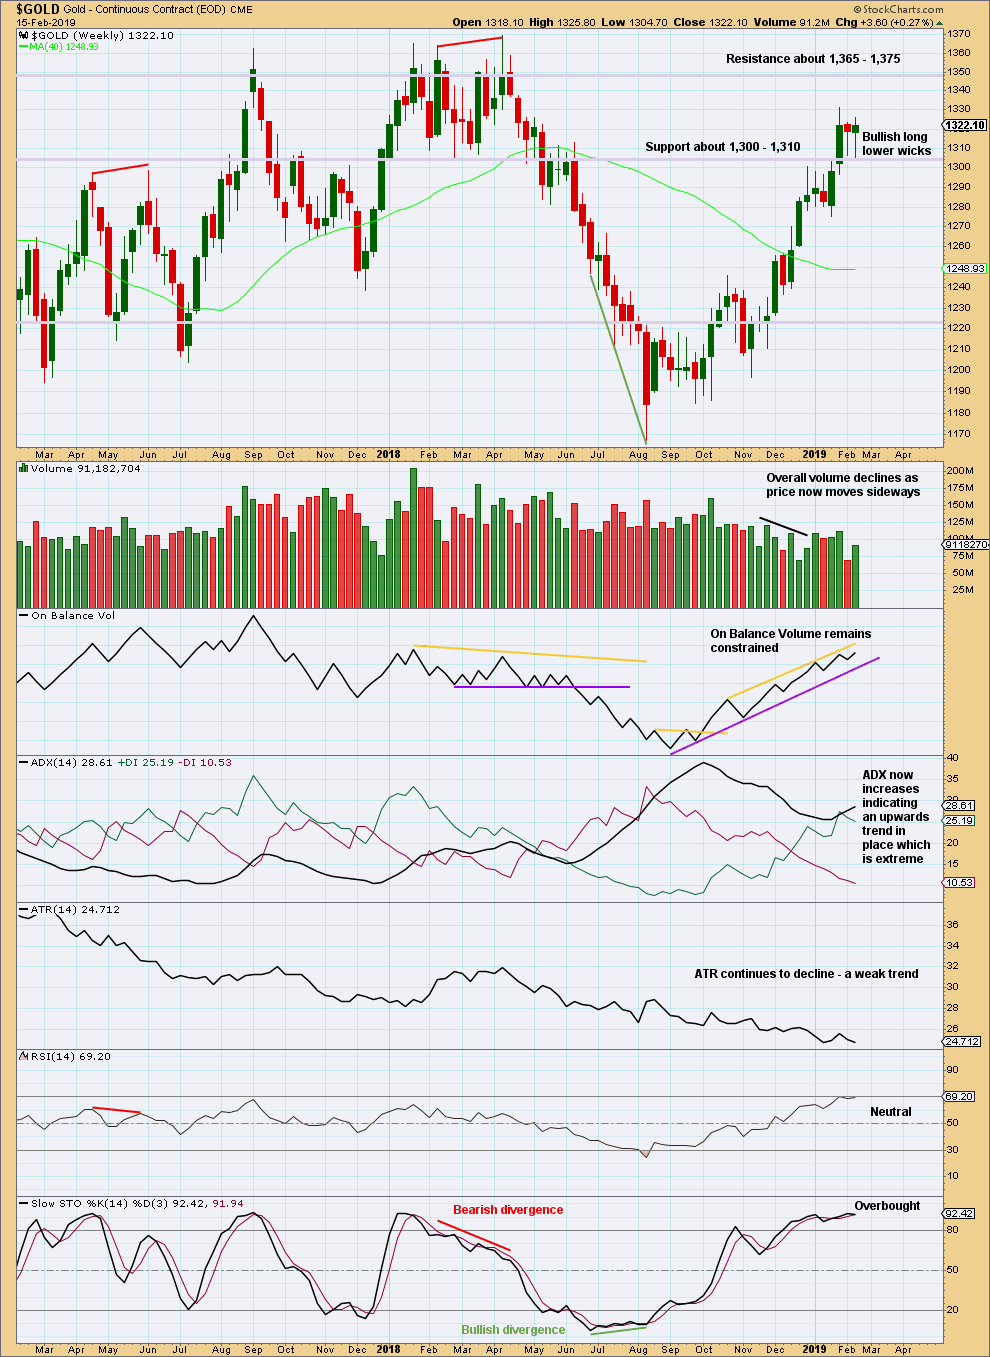
WEEKLY CHART
Click chart to enlarge. Chart courtesy of StockCharts.com.
Strong support about 1,300 continues. For the short term, the last two weeks look like a small consolidation within the ongoing upwards trend.
With the trend extreme at this time frame, upward movement may be limited.
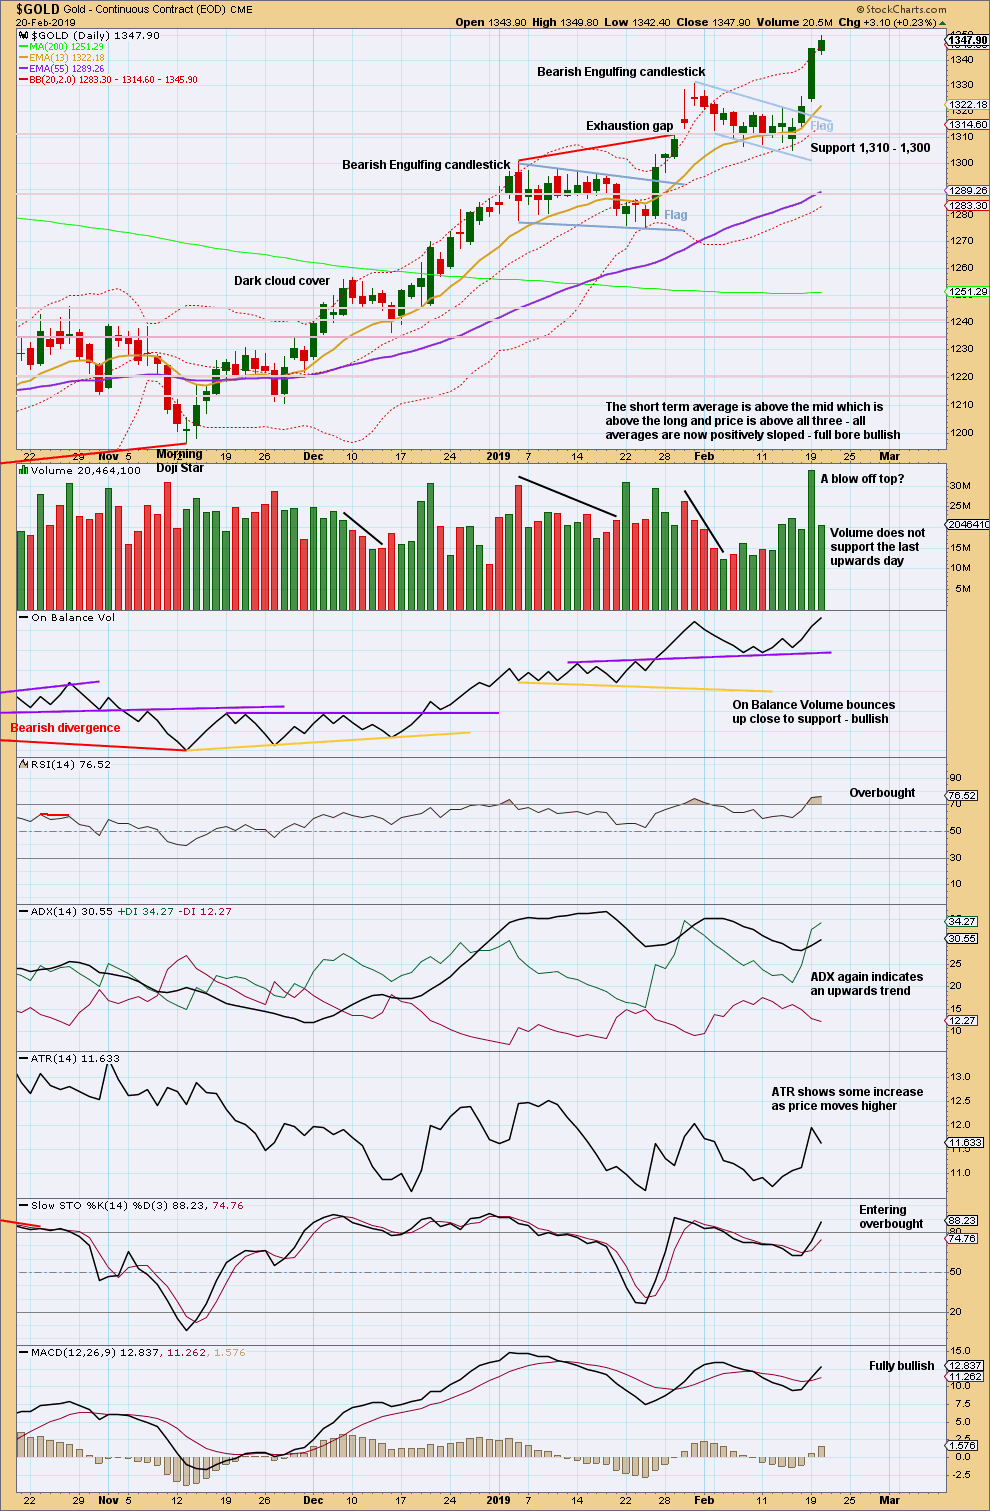
DAILY CHART
Click chart to enlarge. Chart courtesy of StockCharts.com.
A target using the flag pole would be at 1,375.
This chart is fully bullish, but overbought RSI now sounds a warning to look out for a trend change to either downwards or sideways, here or very soon, to relieve extreme conditions. Today a very small real body and decline in volume make the warning for caution over this upwards trend a little louder.
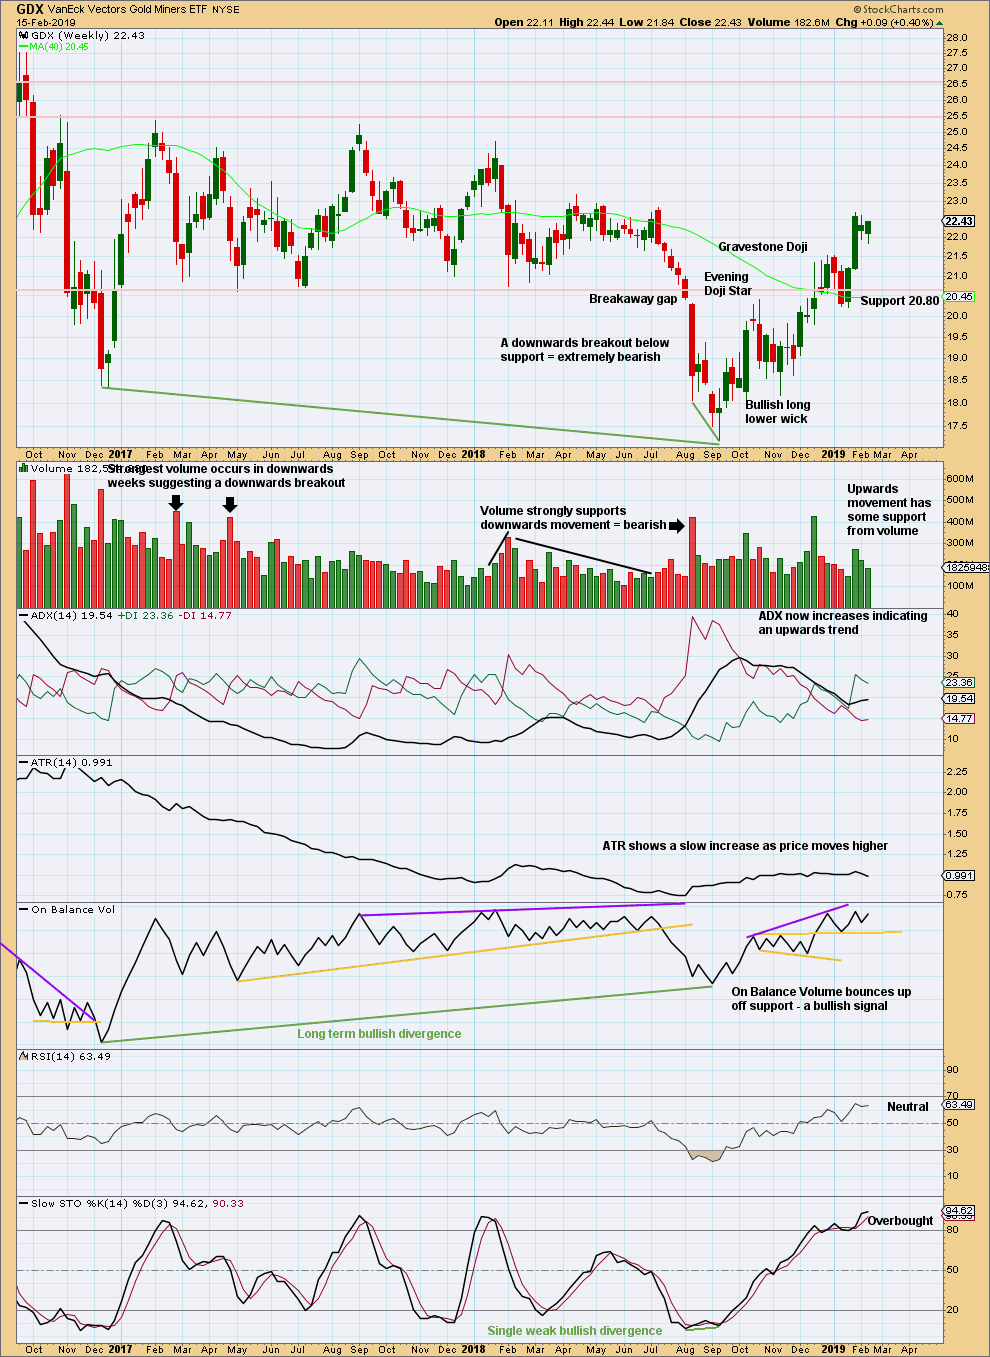
GDX WEEKLY CHART
Click chart to enlarge. Chart courtesy of StockCharts.com.
A downwards week closes green and the balance of volume is upwards. Upwards movement within the last week lacks support from volume.
ADX indicates an upwards trend. RSI indicates there is room for price to continue higher. Next resistance is about 23.0, and there is strong resistance above about 25.5.
GDX DAILY CHART
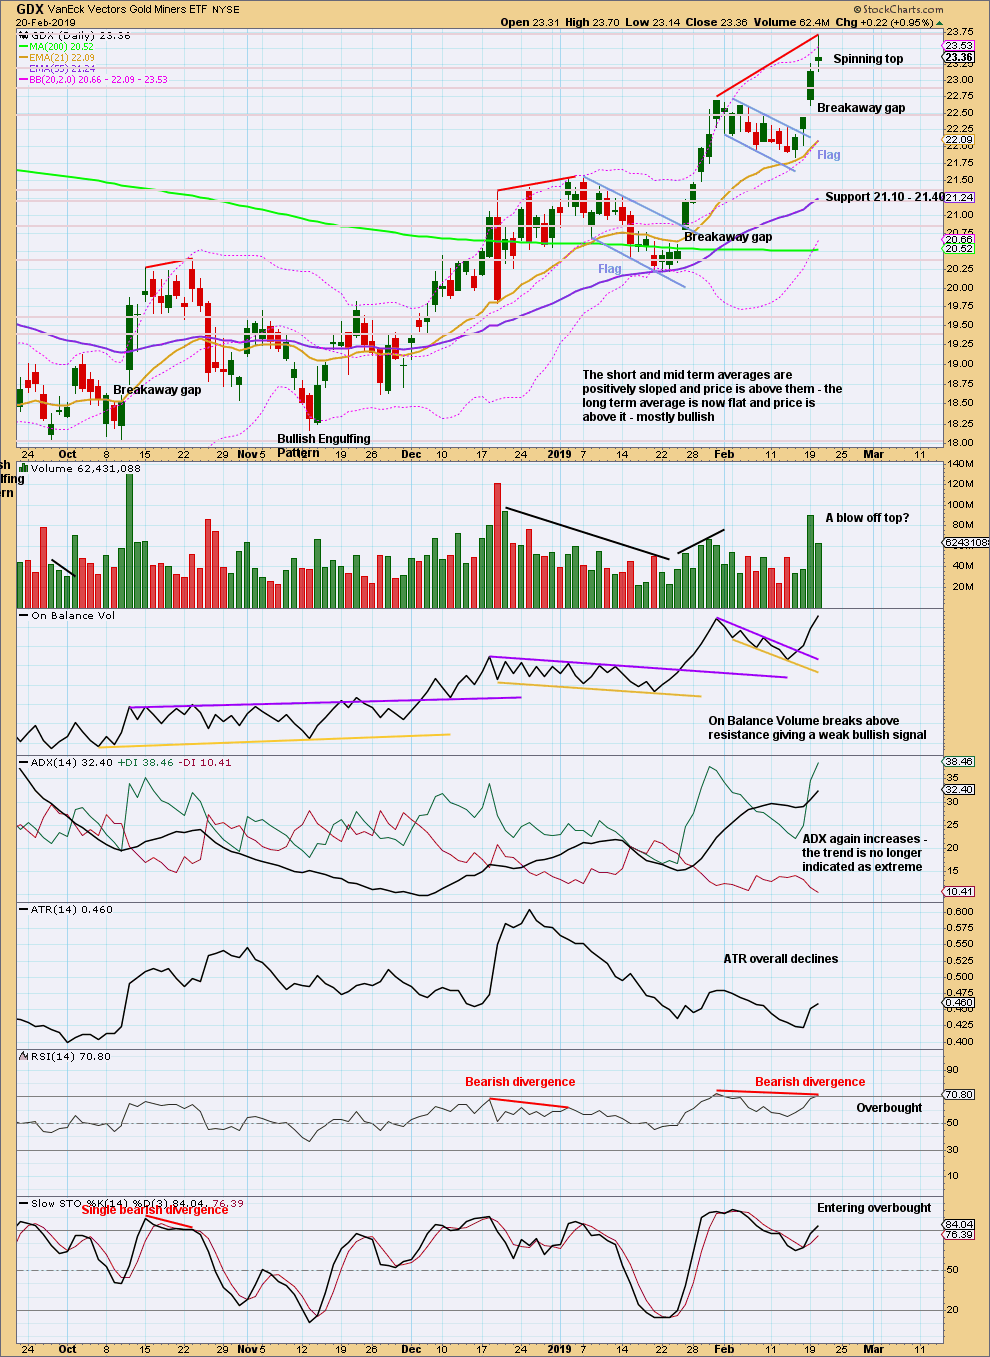
Click chart to enlarge. Chart courtesy of StockCharts.com.
The target from the last flag pattern is calculated at 24.65.
Breakaway gaps may be used in trading. In an upwards trend, breakaway gaps should remain open. The lower edge of this gap may be used to pull up stops to 22.64 to protect profits.
The Spinning Top candlestick pattern today shifts the trend for the short term from up to neutral. This is not a reversal pattern, but it is a warning of a potential high for the short or mid term.
Published @ 08:30 p.m. EST.
—
Careful risk management protects your trading account(s).
Follow my two Golden Rules:
1. Always trade with stops.
2. Risk only 1-5% of equity on any one trade.
Hourly chart updated:
So far, so good today. This is the kind of behaviour I’d expect to see at a major high.
Today may complete the third candlestick of a reversal pattern on the daily chart: an Evening Star.
If this downwards day has support from volume that would be good support for the preferred EW count, but downwards movement doesn’t need support from volume. It just adds more confidence.
Fantastic work Lara, I’ve made money long and now making money short.
I went short when gold hit a trend line I had on my chart. Good work Lara. You made me aware of a turning point so I looked out for it.
Thanks so much for letting me know Keith!
As this triangle has meandered to an end the comments section here has dried up, so I’m not really sure if members have been able to use my analysis to profit.
So it’s good to hear from you, and good to know you’re making $$
I’ve just got back into trading since my daughter mum passed away, I took a year off but kept your subscription.
My mind is ok again now.
With your help I have tripled my deposit in my trading account and that is over a couple of months and only trading gold.
Thanks again for your excellent work.
Sorry to hear that Keith. Hope you’re fine now. And yeah, I’ve almost doubled my fund since the opening balance from early this year. Can’t deny that Lara’s analysis is nothing but fantastic.