
The first point looked for to give confidence in the Elliott wave count is now seen in a candlestick reversal pattern. Today completes an Evening Star on the daily chart for Gold.
Summary: Today’s Evening Star reversal pattern indicates a high may be in place. Next, a close below support at 1,300 and a breach of the blue channel on the daily chart are required for confidence in the preferred Elliott wave count.
Expect a trend change here to either down or sideways.
New updates to this analysis are in bold.
Grand SuperCycle analysis is here.
Last historic analysis with monthly charts is here.
MAIN ELLIOTT WAVE COUNT
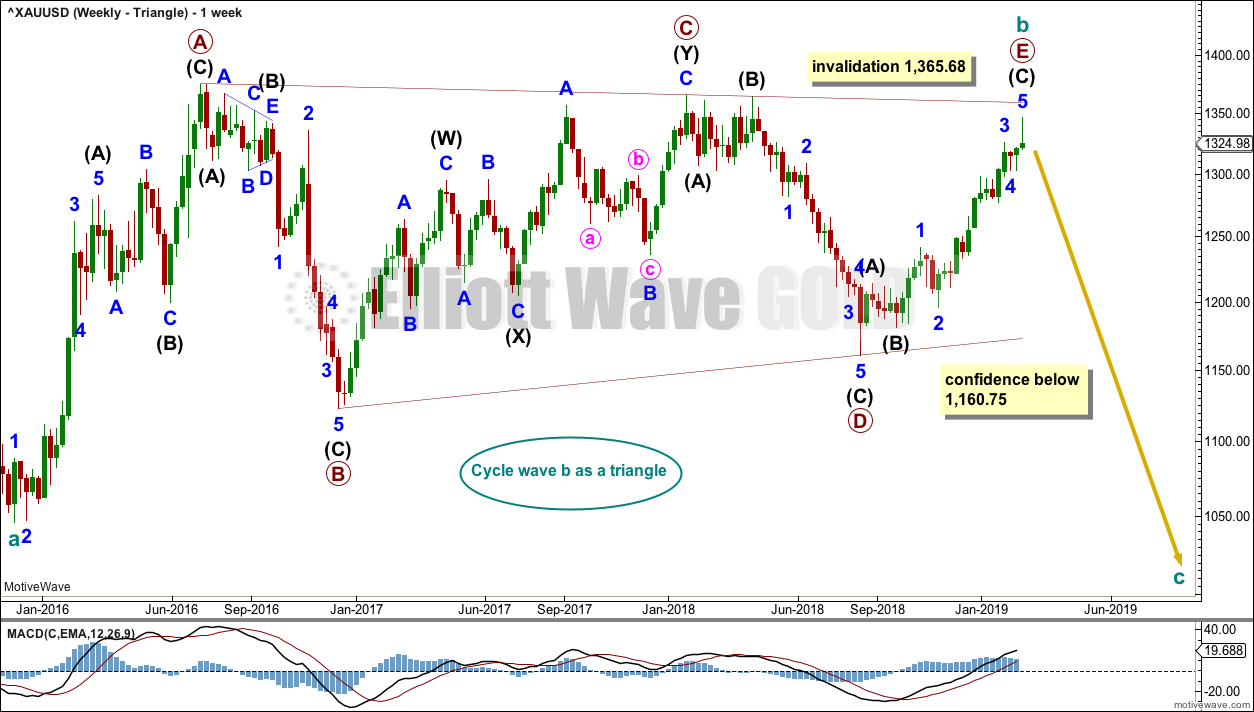
WEEKLY CHART – TRIANGLE
Click chart to enlarge.
This is the preferred wave count.
Cycle wave b may be a complete regular contracting triangle. If it continues further, then primary wave E may not move beyond the end of primary wave C above 1,365.68.
Within primary wave E, intermediate waves (A) and (B) may be complete. Intermediate wave (C) must subdivide as a five wave structure.
Four of the five sub-waves of a triangle must be zigzags, with only one sub-wave allowed to be a multiple zigzag. Wave C is the most common sub-wave to subdivide as a multiple, and this is how primary wave C for this example fits best. Primary wave E looks like it is unfolding as a single zigzag.
There are no problems in terms of subdivisions or rare structures for this wave count. It has an excellent fit and so far a typical look.
This wave count would expect a cycle degree trend change as imminent. Cycle wave c would most likely make new lows below the end of cycle wave a at 1,046.27 to avoid a truncation.
Primary wave E should exhibit reasonable weakness as it comes to an end. Triangles often end with declining ATR, weak momentum and weak volume.
If this weekly wave count is correct, then cycle wave c downwards should develop strength, ATR should show some increase, and MACD should exhibit an increase in downwards momentum.
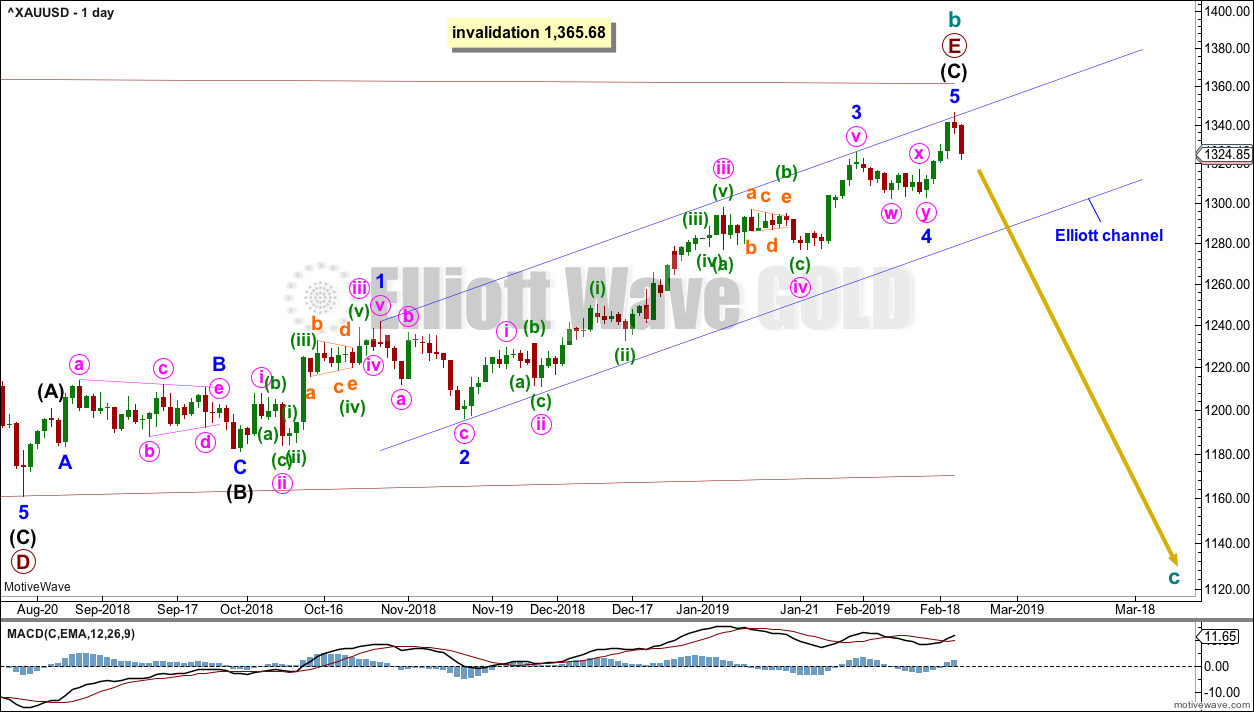
DAILY CHART – TRIANGLE
Click chart to enlarge.
Primary wave E should subdivide as a zigzag. Intermediate waves (A) and (B) may now be complete. Intermediate wave (C) may again be complete, and today there is some indication of a high in place.
This wave count now requires a trend change here or very soon indeed. The following things are now required for confidence in this wave count:
1. A bearish candlestick reversal pattern. This condition is now met with today’s completion of an Evening Star.
2. A new low below support at 1,300.
3. A breach of the blue channel.
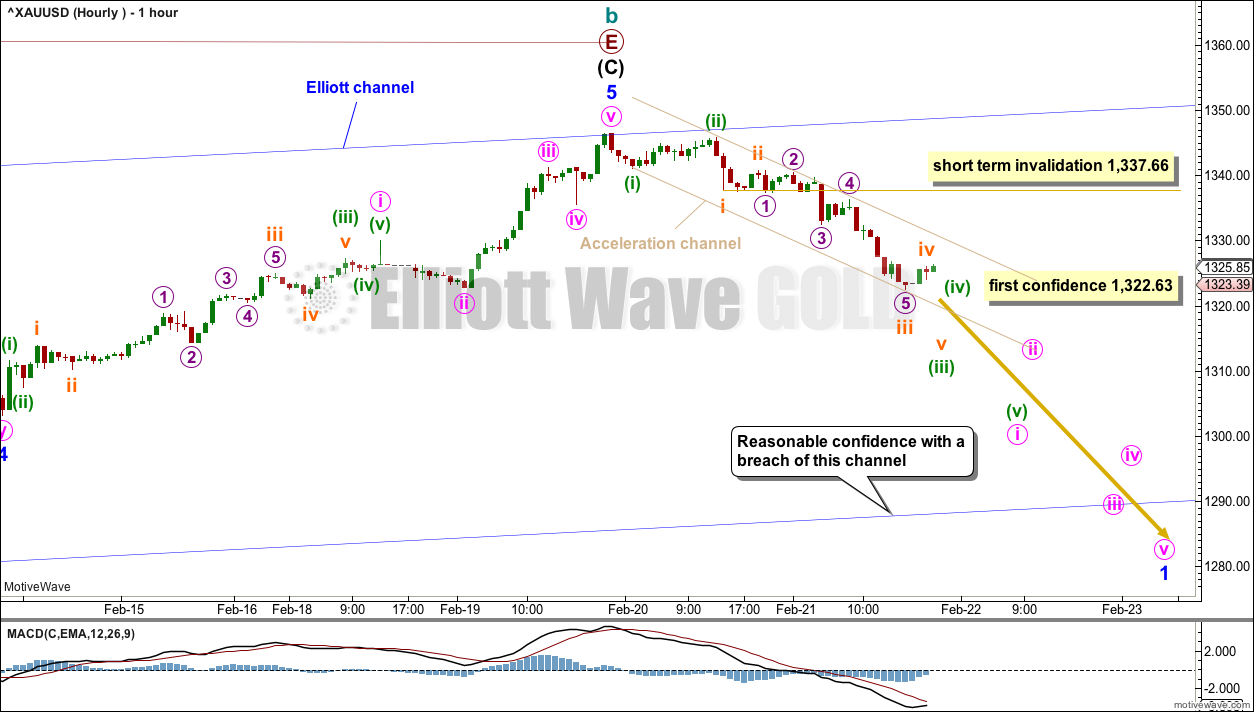
HOURLY CHART
Click chart to enlarge.
The hourly chart focusses on the strucutre of minor wave 5.
Minor wave 5 may be complete. A little confidence in a trend change has come with a new short-term swing low below 1,322.63.
If this wave count is correct, then the first five down of a new trend may be incomplete. This is labelled minute wave i. Within minute wave i, minuette wave (iv) may not move into minuette wave (i) price territory above 1,337.66.
Draw an acceleration channel about downwards movement: draw the first trend line from the low labelled minuette wave (i) to the last low, then place a parallel copy on the high labelled minuette wave (ii). As price keeps moving lower keep redrawing the channel. The upper edge may show where bounces find resistance.
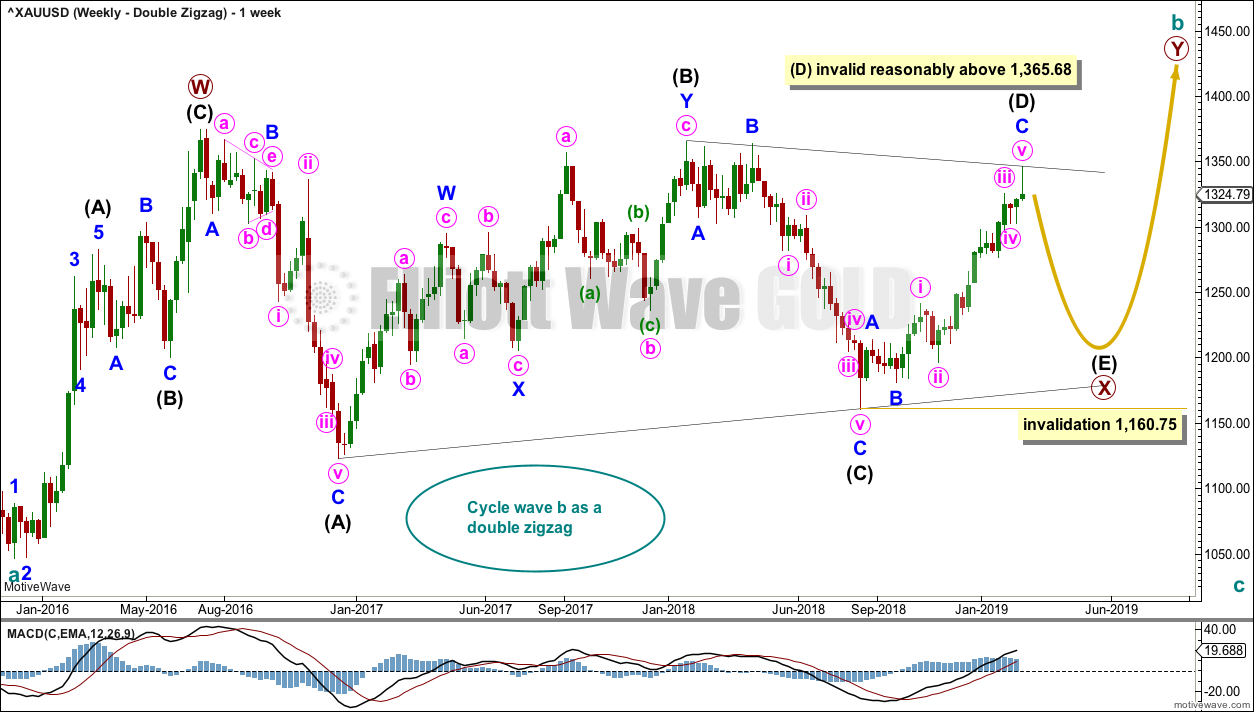
WEEKLY CHART – DOUBLE ZIGZAG
Click chart to enlarge.
It is possible that cycle wave b may be a double zigzag or a double combination.
The first zigzag in the double is labelled primary wave W. This has a good fit.
The double may be joined by a corrective structure in the opposite direction, a triangle labelled primary wave X. The triangle would be about four fifths complete.
Within multiples, X waves are almost always zigzags and rarely triangles. Within the possible triangle of primary wave X, it is intermediate wave (B) that is a multiple; this is acceptable, but note this is not the most common triangle sub-wave to subdivide as a multiple. These two points reduce the probability of this wave count.
Intermediate wave (D) may be complete. The (B)-(D) trend line is almost perfectly adhered to with the smallest overshoot within intermediate wave (C). This is acceptable.
Intermediate wave (E) should continue to exhibit weakness: ATR should continue to show a steady decline, and MACD may begin to hover about zero.
Intermediate wave (E) may not move beyond the end of intermediate wave (C) below 1,160.75.
This wave count may now expect downwards movement for several weeks.
Primary wave Y would most likely be a zigzag because primary wave X would be shallow; double zigzags normally have relatively shallow X waves.
Primary wave Y may also be a flat correction if cycle wave b is a double combination, but combinations normally have deep X waves. This would be less likely.
This wave count has good proportions and no problems in terms of subdivisions.
WEEKLY CHART – ALTERNATE BULLISH
Click chart to enlarge.
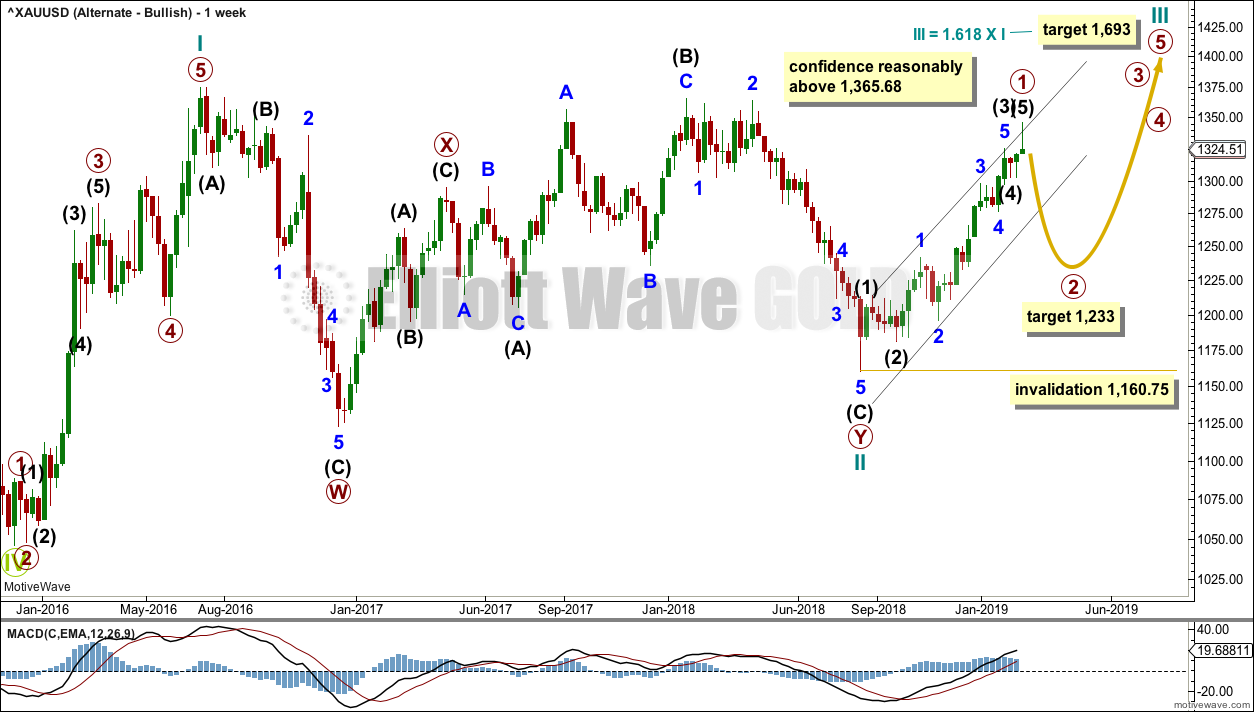
Because the preferred wave count is at a critical juncture in expecting a cycle degree trend change, it is time to consider an alternate which expects the continuation of the current upwards trend.
It is possible that the low in December 2015 was the end of a bear market and that Gold has been in a basing action for the past three years. Downwards movement to that low will subdivide as a double zigzag, a corrective structure.
If Gold is in a new bull market, then it should begin with a five wave structure upwards on the weekly chart. However, the biggest problem with this wave count is the structure labelled cycle wave I because this wave count must see it as a five wave structure, but it looks more like a three wave structure.
Commodities often exhibit swift strong fifth waves that force the fourth wave corrections coming just prior to be more brief and shallow than their counterpart second waves. It is unusual for a commodity to exhibit a quick second wave and a more time consuming fourth wave, and this is how cycle wave I is labelled. The probability of this wave count is low due to this problem.
Cycle wave II subdivides well as a double combination: zigzag – X – expanded flat.
Cycle wave III may have begun. Within cycle wave III, primary wave 1 may now be complete. The target for primary wave 2 is the 0.618 Fibonacci ratio of primary wave 1. Primary wave 2 may not move beyond the start of primary wave 1 below 1,160.75.
A black channel is drawn about primary wave 1. Primary wave 2 may breach the lower edge of this channel.
Cycle wave III so far for this wave count would have been underway now for 25 weeks. It should be beginning to exhibit some support from volume, increase in upwards momentum and increasing ATR. However, volume continues to decline, ATR continues to decline and is very low, and momentum is weak in comparison to cycle wave I. This wave count lacks support from classic technical analysis.
TECHNICAL ANALYSIS
WEEKLY CHART
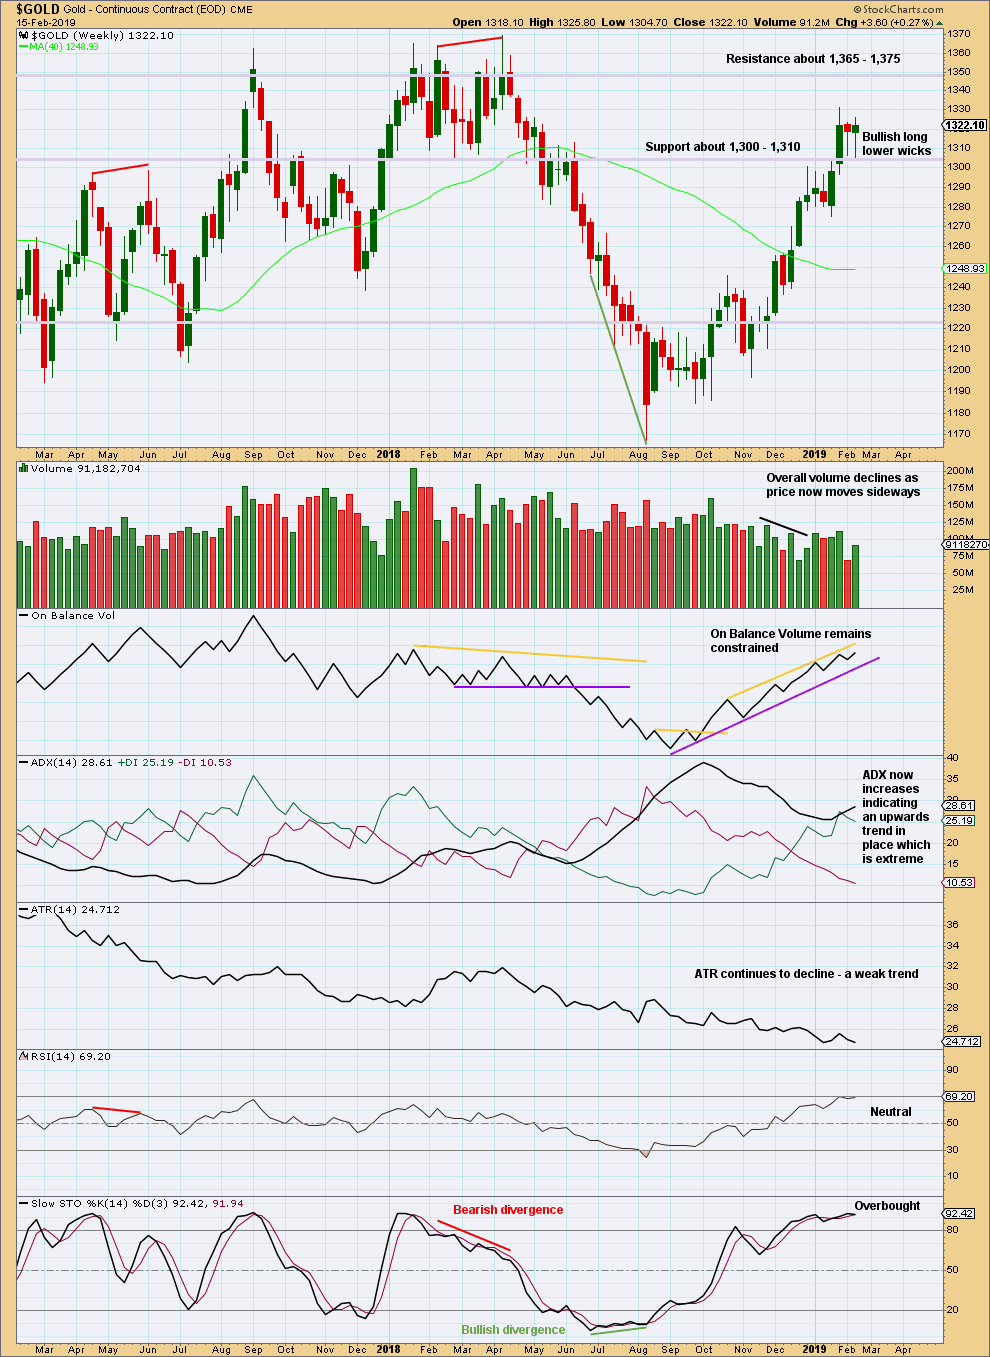
Click chart to enlarge. Chart courtesy of StockCharts.com.
Strong support about 1,300 continues. For the short term, the last two weeks look like a small consolidation within the ongoing upwards trend.
With the trend extreme at this time frame, upward movement may be limited.
DAILY CHART
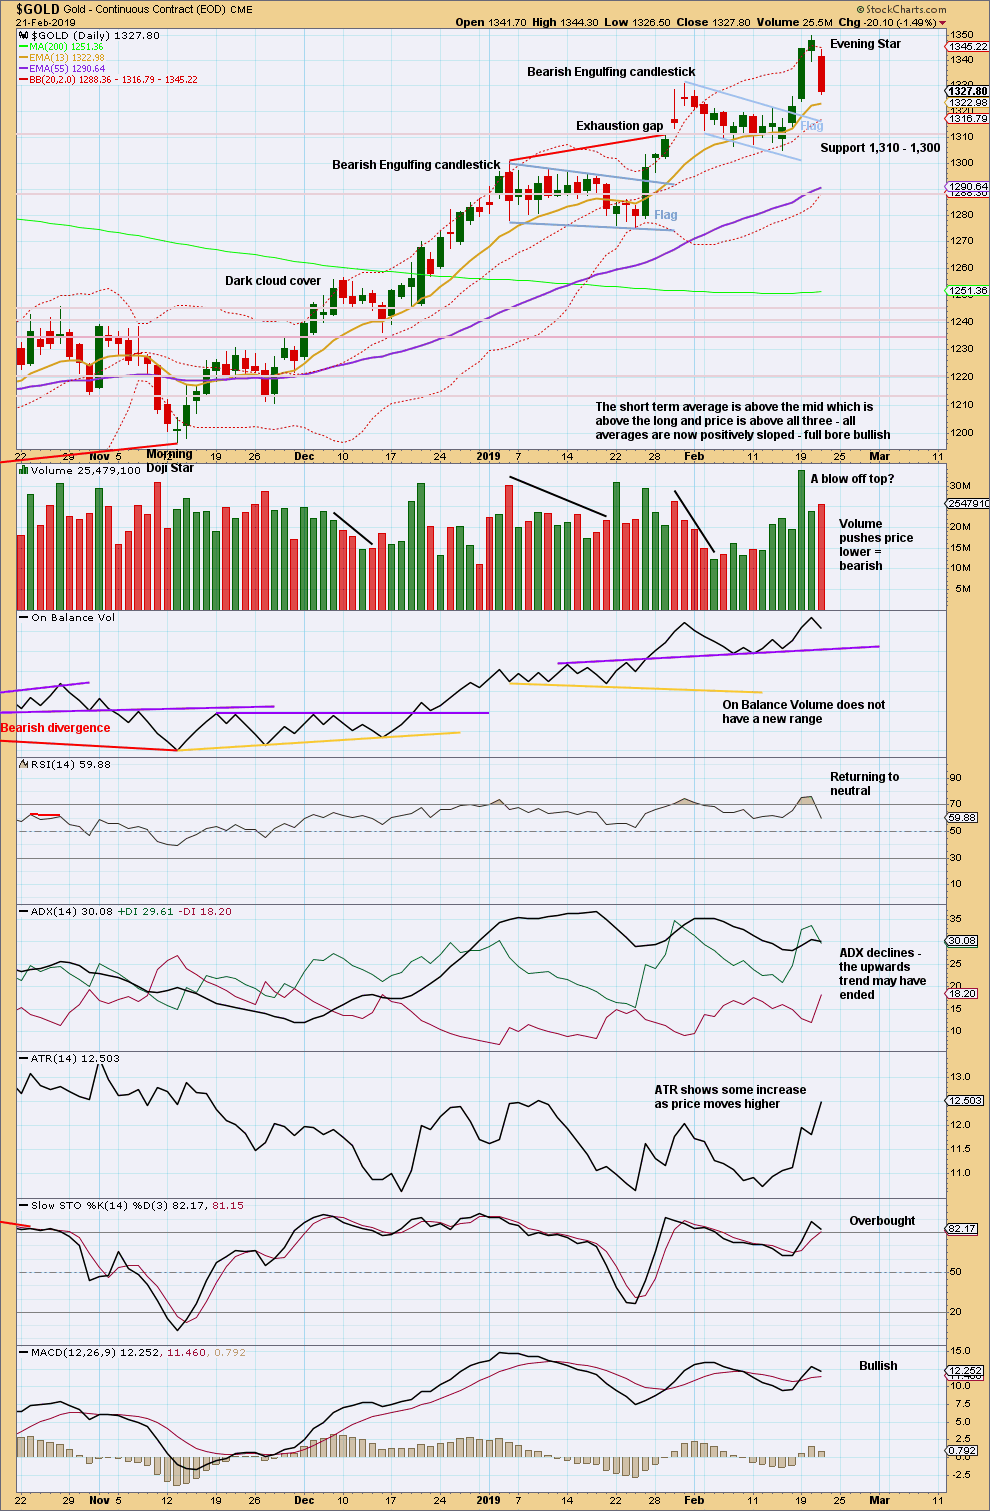
Click chart to enlarge. Chart courtesy of StockCharts.com.
The Evening Star reversal pattern indicates a trend change here to either down or sideways. The target calculated from the last flag pattern should now not be expected to be met.
Volume supports a trend change here.
GDX WEEKLY CHART
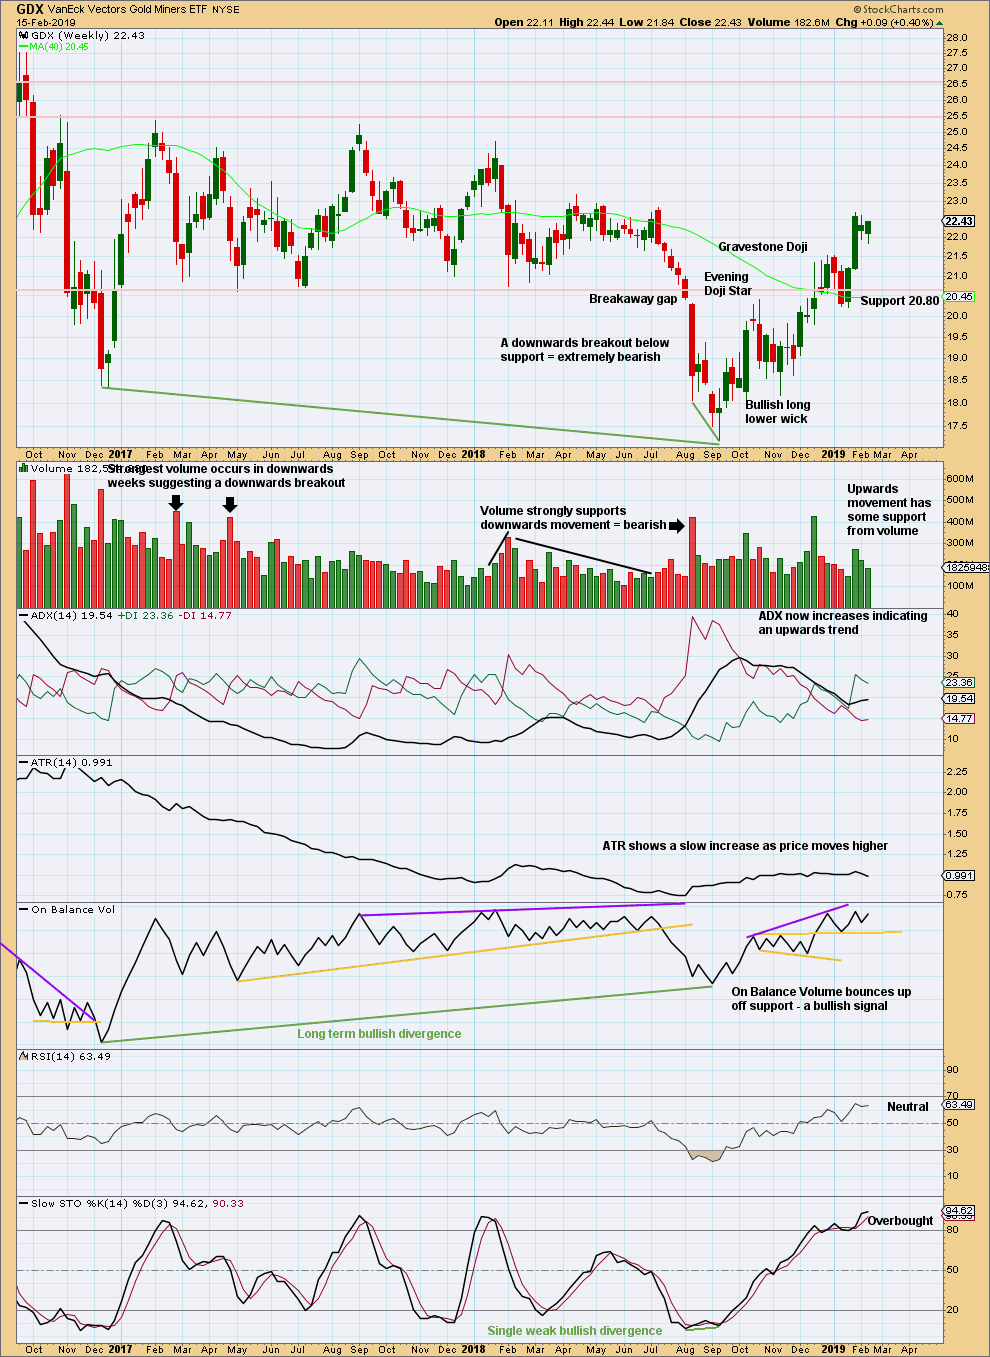
Click chart to enlarge. Chart courtesy of StockCharts.com.
A downwards week closes green and the balance of volume is upwards. Upwards movement within the last week lacks support from volume.
ADX indicates an upwards trend. RSI indicates there is room for price to continue higher. Next resistance is about 23.0, and there is strong resistance above about 25.5.
GDX DAILY CHART
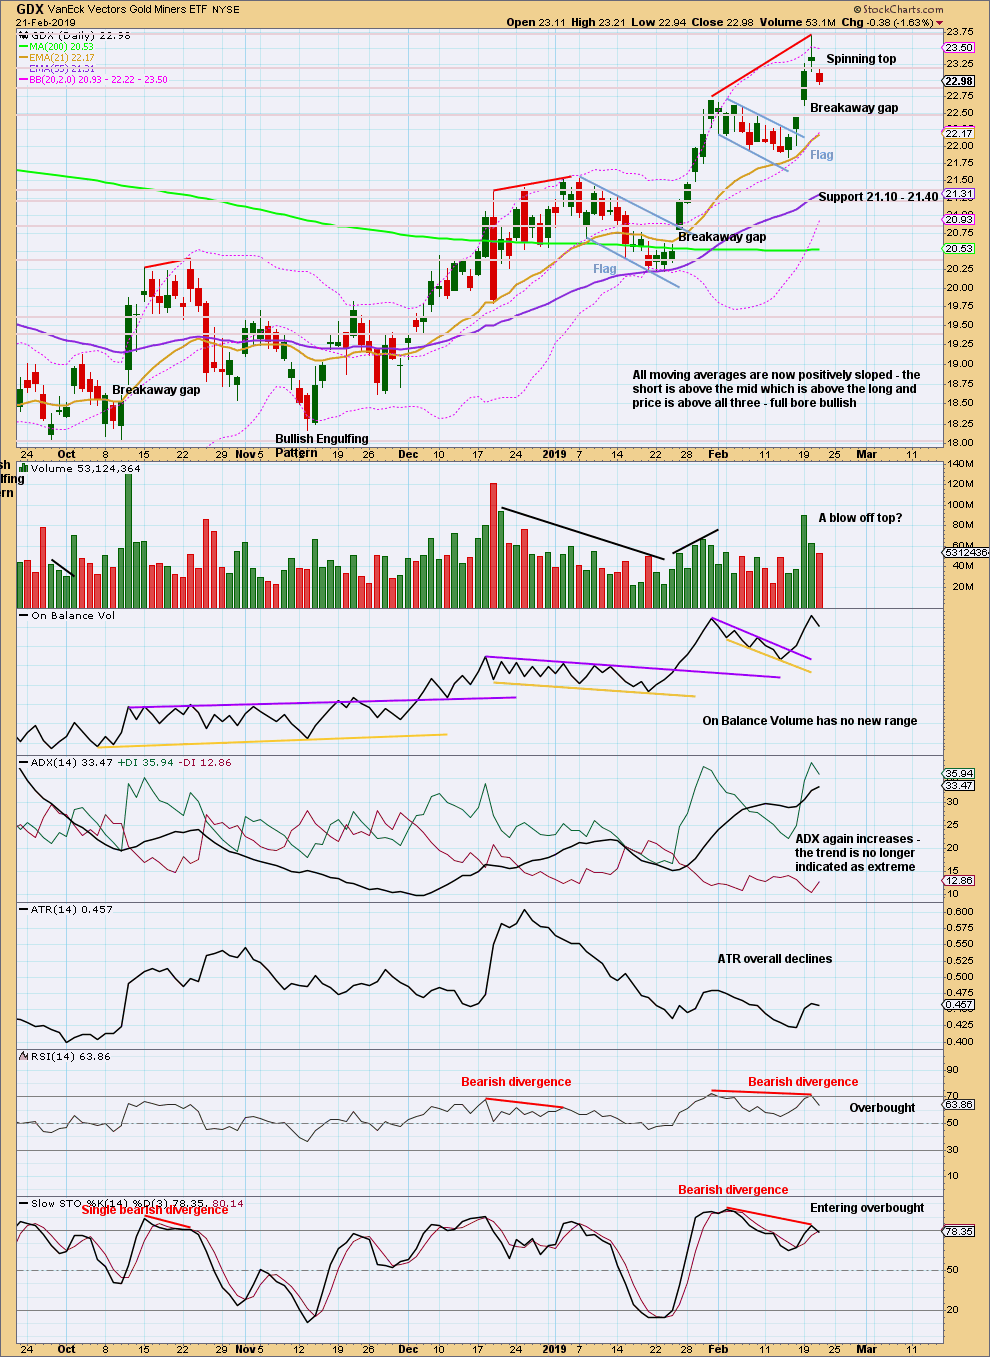
Click chart to enlarge. Chart courtesy of StockCharts.com.
The target from the last flag pattern is calculated at 24.65.
Breakaway gaps may be used in trading. In an upwards trend, breakaway gaps should remain open. The lower edge of this gap may be used to pull up stops to 22.64 to protect profits.
Assume the pullback here may be a brief interruption to the trend while the gap remains open at 22.64.
GDX does not exhibit a candlestick reversal pattern.
If the gap is closed, it would then be relabelled an exhaustion gap and the probability of a trend change would increase.
Published @ 08:54 p.m. EST.
—
Careful risk management protects your trading account(s).
Follow my two Golden Rules:
1. Always trade with stops.
2. Risk only 1-5% of equity on any one trade.
Updated hourly chart:
I’m going to now label a five down complete. This bounce has breached a channel drawn about the last five down using Elliott’s first technique. This is a new wave.
Target for minute ii is the 0.618 Fibonacci ratio of minute i at 1,337.40.
For more aggressive traders this bounce may offer the first and best opportunity to enter a very long term short position, it may be held for weeks or months. The risk / reward ratio here is exceptional.
Always remember, in trading the single most important thing is to manage risk. Always trade with stops, and invest only 1-5% of your equity on any one trade. In this case stops may be just above the last high, allow a little room for your broker spread.
I could be wrong, and a short position here could result in a loss. If it does, make sure it is a loss you can manage.
Also, the hourly analysis notes : Within minute wave i, minuette wave (iv) may not move into minuette wave (i) price territory above 1,337.66.
But isn’t the 1337.66 line for subminuette wave i?
And minuette wave (i) should be at about 1341.43?
Please advise. Thanks.
Hi Lara. You know we love your updates that you post.. but I’m wondering is there a way to load them on the page the same way you do in your regular analysis?
I’ve been noticing for some time now that the update image does not size the same as the regular analysis images, and it makes it so difficult to view the changes when I pop from one to the other in my browser tab.
If you could look into this I would appreciate it. I just love scrolling thru the changed charts to help me see how the wave count changes.
If I understand you correctly than this what you do: right click the chart and select “open in new tab” . Chart will open in new web page than you can zoom in or enlarge the chart or save/download the chart on your computer.
Yes Papudi. Its nice to have Lara’s chart on their own individual tab. But Lara’s daily update charts don’t open sized the same as her regular analysis charts.
I copy/paste the image address of the newest chart into the address bar of the tab I have open reserved for EWG counts– that way, when I use my back and forward button on that tab I can see how the wave count progressed/changed. It would be much more helpful if her update charts sized the same because using a zoom on an update chart will then cause future load-ups to be oversized. Understand what I’m saying??
Yeah, I get what your’e saying.
I’m thinking about how this would work, and I’ll ask Cesar.
But if it involves a bunch more work then I’ll probably not do it. Because when daylight savings ends in NZ and we move into our winter / your summer, I have very little time left in the morning to get up and check charts. You’ll notice I post an update later in the afternoon in your summer, that’s why. I’m quite pressed for time, especially if the market has done something unexpected.
I could add another piece of code to the bottom of the post and title the addition “updated hourly chart”. That’s how I’d do it.
Thanks for looking into this. I don’t mean for you to every day do extra work for this, please– I was thinking it is a coding /web/ Caesar kind of thing or a different procedure process for you but not extra steps. I think now I’m starting to get curious why it works differently. Anyway, don’t stress on it, please.:)
Hi Lara,
I think that your Weekly technical chart is from yesterday?
The weekly TA chart changes only once a week.
It’s going to be updated today, after the close of the Friday session.