
Overall, the week has begun with some sideways movement. For the short term, this is what the preferred Elliott wave count expected.
Summary: Both a Shooting Star on the weekly chart and an Evening Star on the daily chart indicate a high may be in place. Next, a close below support at 1,300 and a breach of the blue channel on the daily chart are required for confidence in the preferred Elliott wave count.
Expect a trend change here to either down or sideways.
For the very short term, this little upwards bounce may end about 1,337 and thereafter downwards movement may continue with increasing momentum. This bounce may possibly present a low risk high reward entry opportunity for a long term short position on Gold.
New updates to this analysis are in bold.
Grand SuperCycle analysis is here.
Last historic analysis with monthly charts is here.
MAIN ELLIOTT WAVE COUNT
WEEKLY CHART – TRIANGLE
Click chart to enlarge.
This is the preferred wave count.
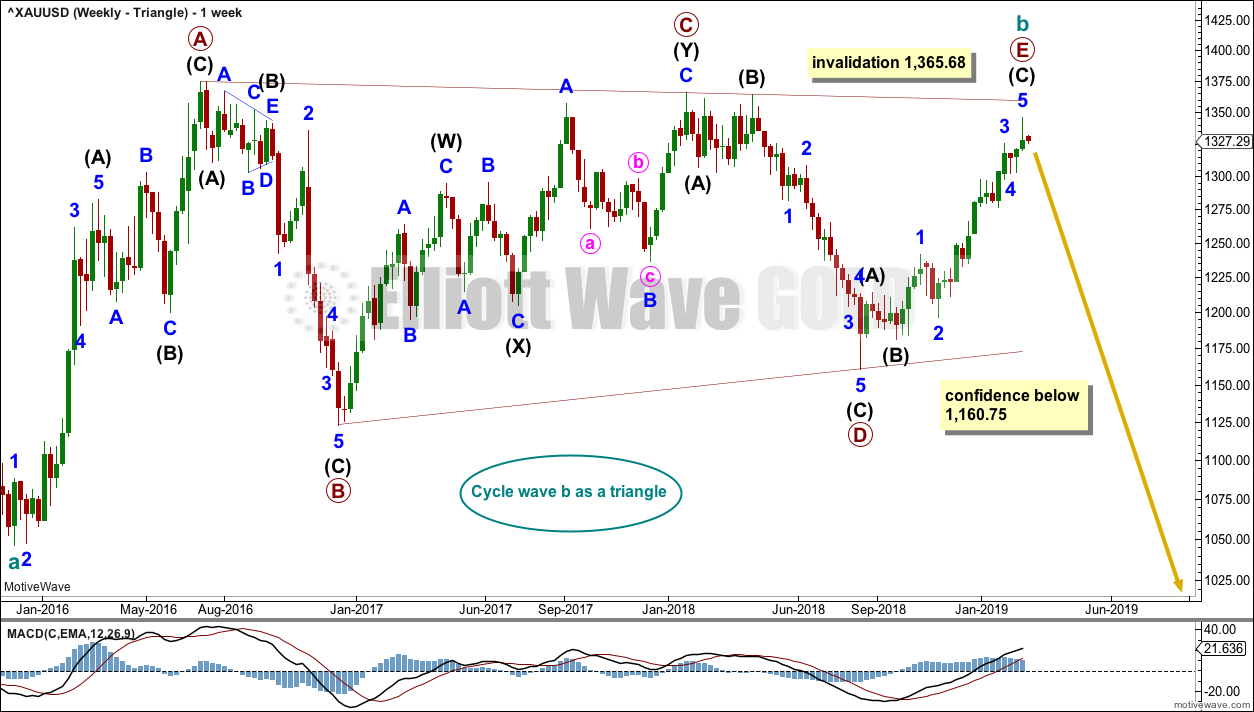
Cycle wave b may be a complete regular contracting triangle. If it continues further, then primary wave E may not move beyond the end of primary wave C above 1,365.68.
Four of the five sub-waves of a triangle must be zigzags, with only one sub-wave allowed to be a multiple zigzag. Wave C is the most common sub-wave to subdivide as a multiple, and this is how primary wave C for this example fits best.
There are no problems in terms of subdivisions or rare structures for this wave count. It has an excellent fit and so far a typical look.
This wave count would expect a cycle degree trend change has just occurred. Cycle wave c would most likely make new lows below the end of cycle wave a at 1,046.27 to avoid a truncation.
Primary wave E should exhibit reasonable weakness as it comes to an end. Triangles often end with declining ATR, weak momentum and weak volume.
If this weekly wave count is correct, then cycle wave c downwards should develop strength, ATR should show some increase, and MACD should exhibit an increase in downwards momentum.
DAILY CHART – TRIANGLE
Click chart to enlarge.
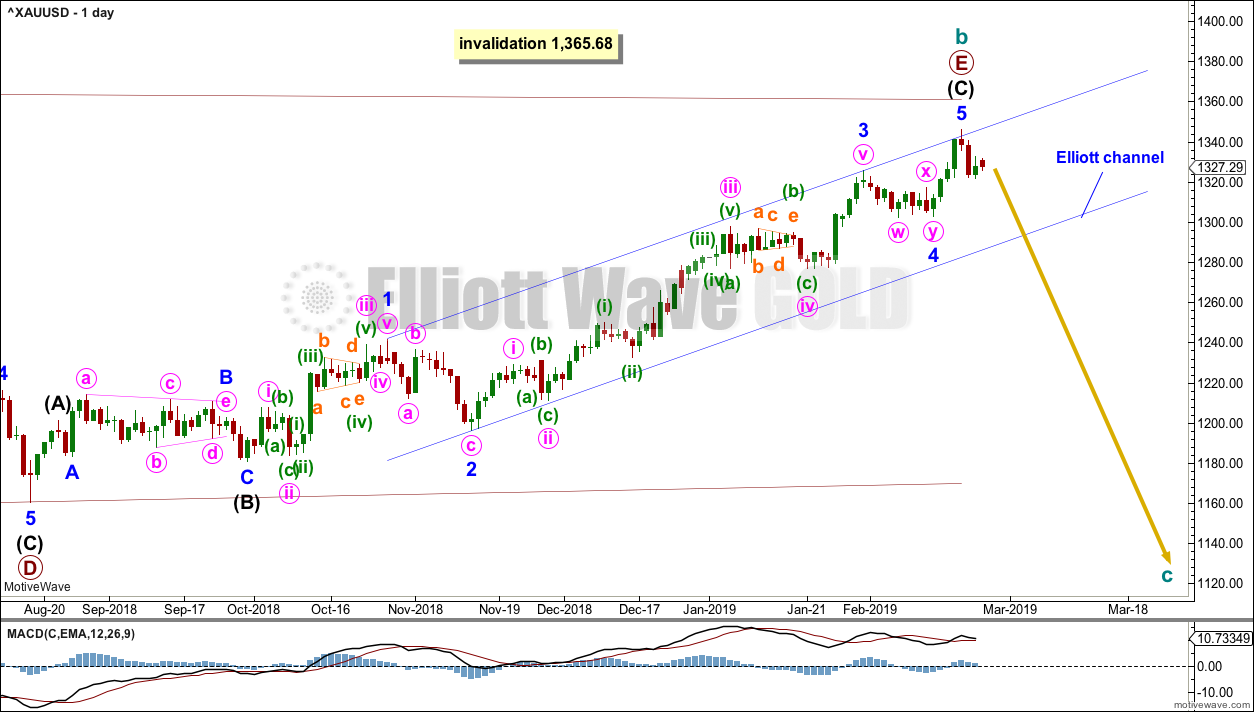
Primary wave E should subdivide as a zigzag. Intermediate waves (A) and (B) may now be complete. Intermediate wave (C) may again be complete, and there is some indication of a high in place.
This wave count now requires a trend change here or very soon indeed. The remaining two things are now required for confidence in this wave count:
1. A new low below support at 1,300.
2. A breach of the blue Elliott channel.
HOURLY CHART
Click chart to enlarge.
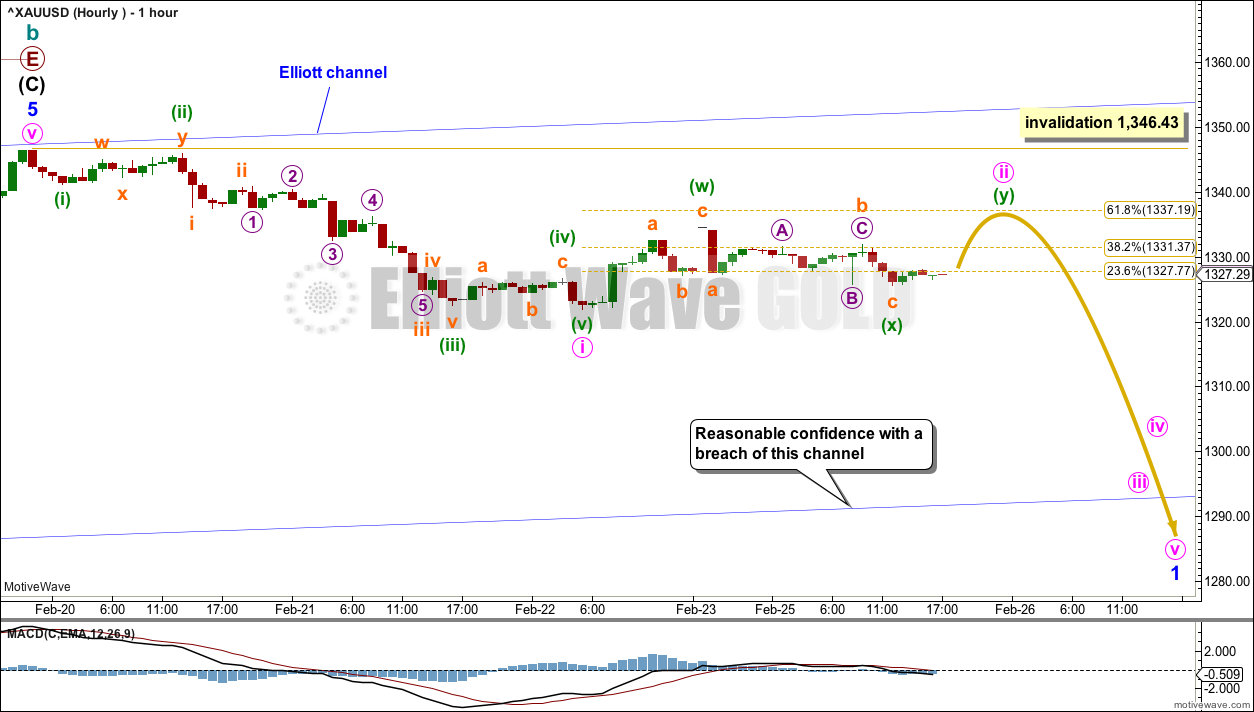
Minor wave 5 may be complete. A little confidence in a trend change has come with a new short-term swing low below 1,322.63.
If this wave count is correct, then the first five down of a new trend may be complete. This is labelled minute wave i. Minute wave ii may end close to the 0.618 Fibonacci ratio. Minute wave ii may be unfolding as a small double zigzag, which is a fairly common structure for a second wave correction.
Minute wave ii may not move beyond the start of minute wave i above 1,346.43.
When minute wave ii may be complete, then a base channel may be drawn about minute waves i and ii. Draw the first trend line from the start of minute wave i to the end of minute wave ii, then place a parallel copy on the end of minute wave i. The upper edge of the base channel may provide resistance for bounces along the way down. Minute wave iii may have the power to break below support at the lower edge.
WEEKLY CHART – DOUBLE ZIGZAG
Click chart to enlarge.
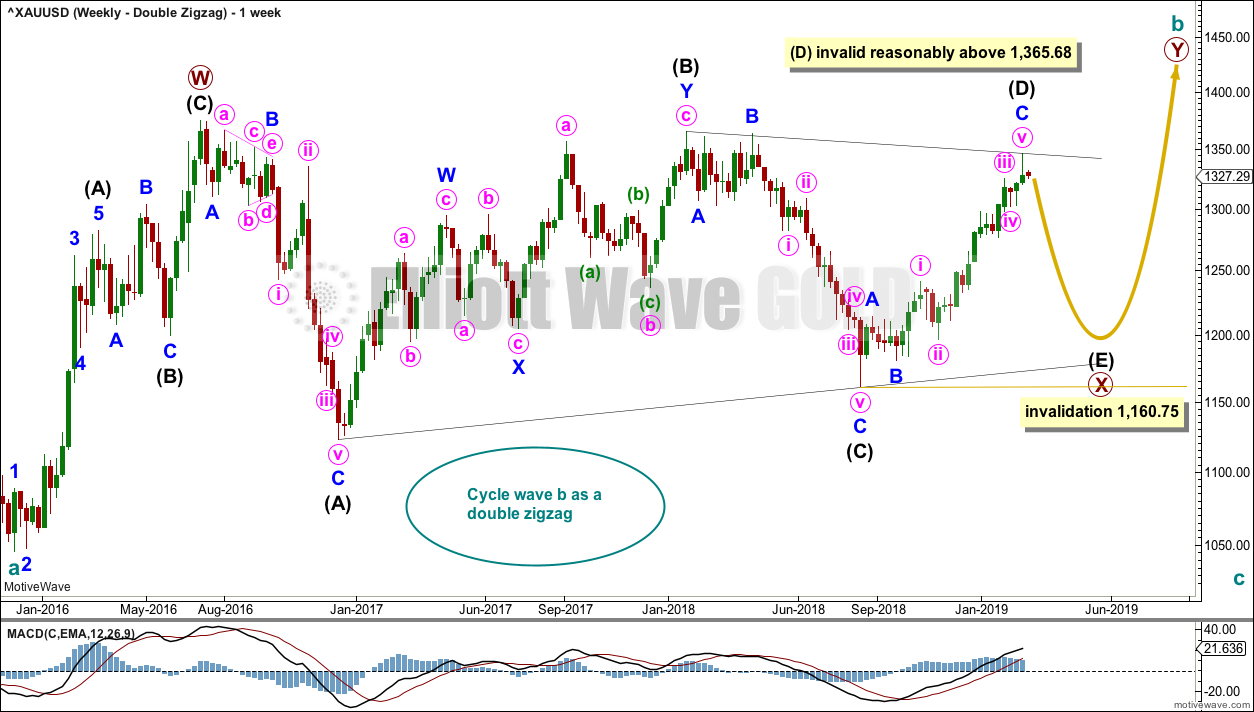
It is possible that cycle wave b may be a double zigzag or a double combination.
The first zigzag in the double is labelled primary wave W. This has a good fit.
The double may be joined by a corrective structure in the opposite direction, a triangle labelled primary wave X. The triangle would be about four fifths complete.
Within multiples, X waves are almost always zigzags and rarely triangles. Within the possible triangle of primary wave X, it is intermediate wave (B) that is a multiple; this is acceptable, but note this is not the most common triangle sub-wave to subdivide as a multiple. These two points reduce the probability of this wave count.
Intermediate wave (D) may be complete. The (B)-(D) trend line is almost perfectly adhered to with the smallest overshoot within intermediate wave (C). This is acceptable.
Intermediate wave (E) should continue to exhibit weakness: ATR should continue to show a steady decline, and MACD may begin to hover about zero.
Intermediate wave (E) may not move beyond the end of intermediate wave (C) below 1,160.75.
This wave count may now expect downwards movement for several weeks.
Primary wave Y would most likely be a zigzag because primary wave X would be shallow; double zigzags normally have relatively shallow X waves.
Primary wave Y may also be a flat correction if cycle wave b is a double combination, but combinations normally have deep X waves. This would be less likely.
This wave count has good proportions and no problems in terms of subdivisions.
WEEKLY CHART – ALTERNATE BULLISH
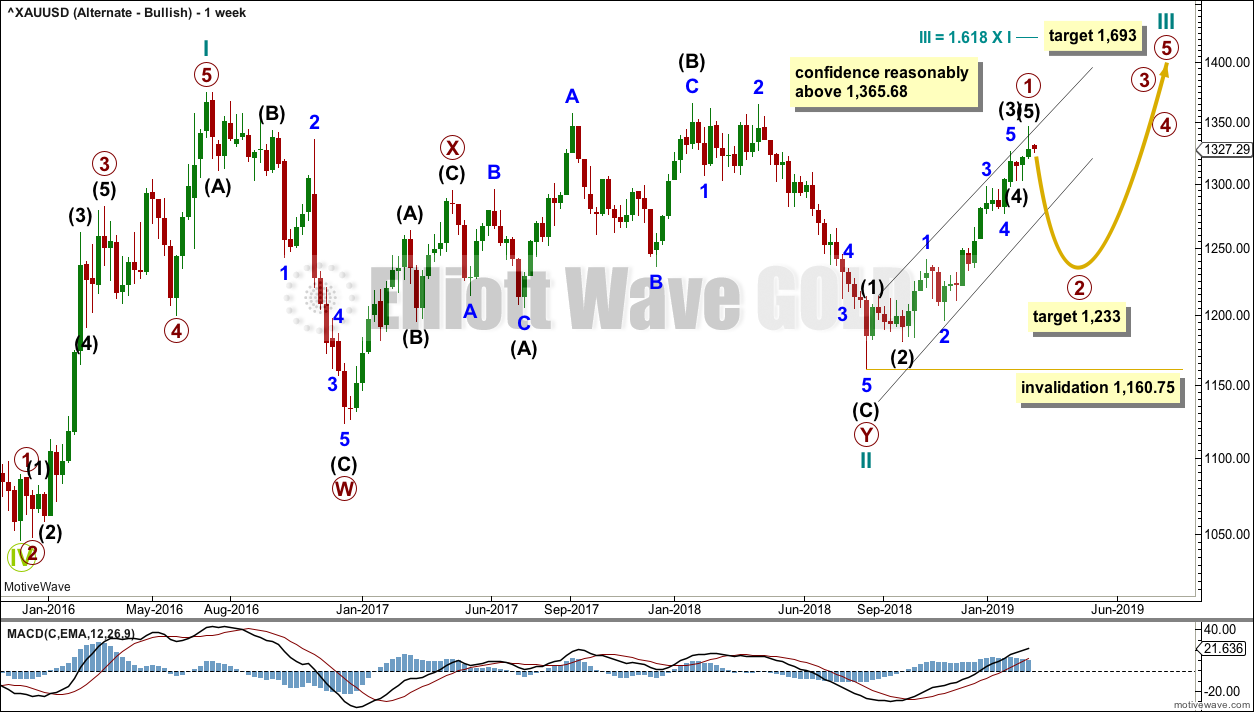
Click chart to enlarge.
Because the preferred wave count is at a critical juncture in expecting a cycle degree trend change, it is time to consider an alternate which expects the continuation of the current upwards trend.
It is possible that the low in December 2015 was the end of a bear market and that Gold has been in a basing action for the past three years. Downwards movement to that low will subdivide as a double zigzag, a corrective structure.
If Gold is in a new bull market, then it should begin with a five wave structure upwards on the weekly chart. However, the biggest problem with this wave count is the structure labelled cycle wave I because this wave count must see it as a five wave structure, but it looks more like a three wave structure.
Commodities often exhibit swift strong fifth waves that force the fourth wave corrections coming just prior to be more brief and shallow than their counterpart second waves. It is unusual for a commodity to exhibit a quick second wave and a more time consuming fourth wave, and this is how cycle wave I is labelled. The probability of this wave count is low due to this problem.
Cycle wave II subdivides well as a double combination: zigzag – X – expanded flat.
Cycle wave III may have begun. Within cycle wave III, primary wave 1 may now be complete. The target for primary wave 2 is the 0.618 Fibonacci ratio of primary wave 1. Primary wave 2 may not move beyond the start of primary wave 1 below 1,160.75.
A black channel is drawn about primary wave 1. Primary wave 2 may breach the lower edge of this channel.
Cycle wave III so far for this wave count would have been underway now for 27 weeks. It should be beginning to exhibit some support from volume, increase in upwards momentum and increasing ATR. However, volume continues to decline, ATR continues to decline and is very low, and momentum is weak in comparison to cycle wave I. This wave count lacks support from classic technical analysis.
TECHNICAL ANALYSIS
WEEKLY CHART
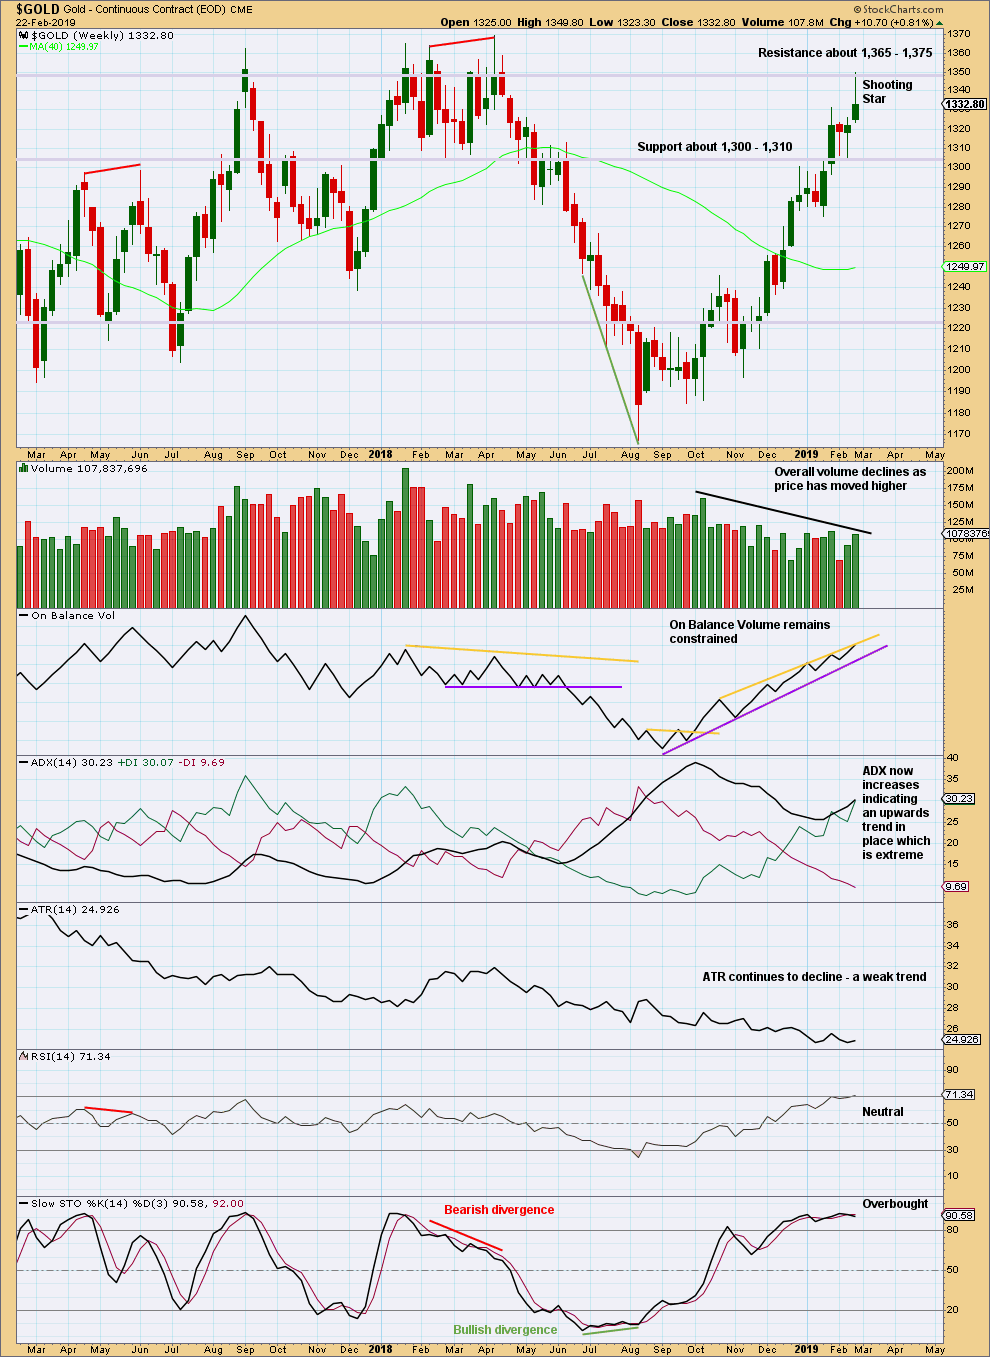
Click chart to enlarge. Chart courtesy of StockCharts.com.
Last week’s upper candlestick wick is 2.18 times the length of the real body. This fits the requirements for a star pattern (the wick needs to be a minimum of twice the length of the real body). Shooting Star candlestick patterns appearing within an upwards trend are bearish reversal patterns.
The longer-term volume profile is bearish, but the short-term volume profile is bullish. On balance my judgement is that the volume profile is more bearish than bullish.
This chart warns that a high may be in place.
DAILY CHART
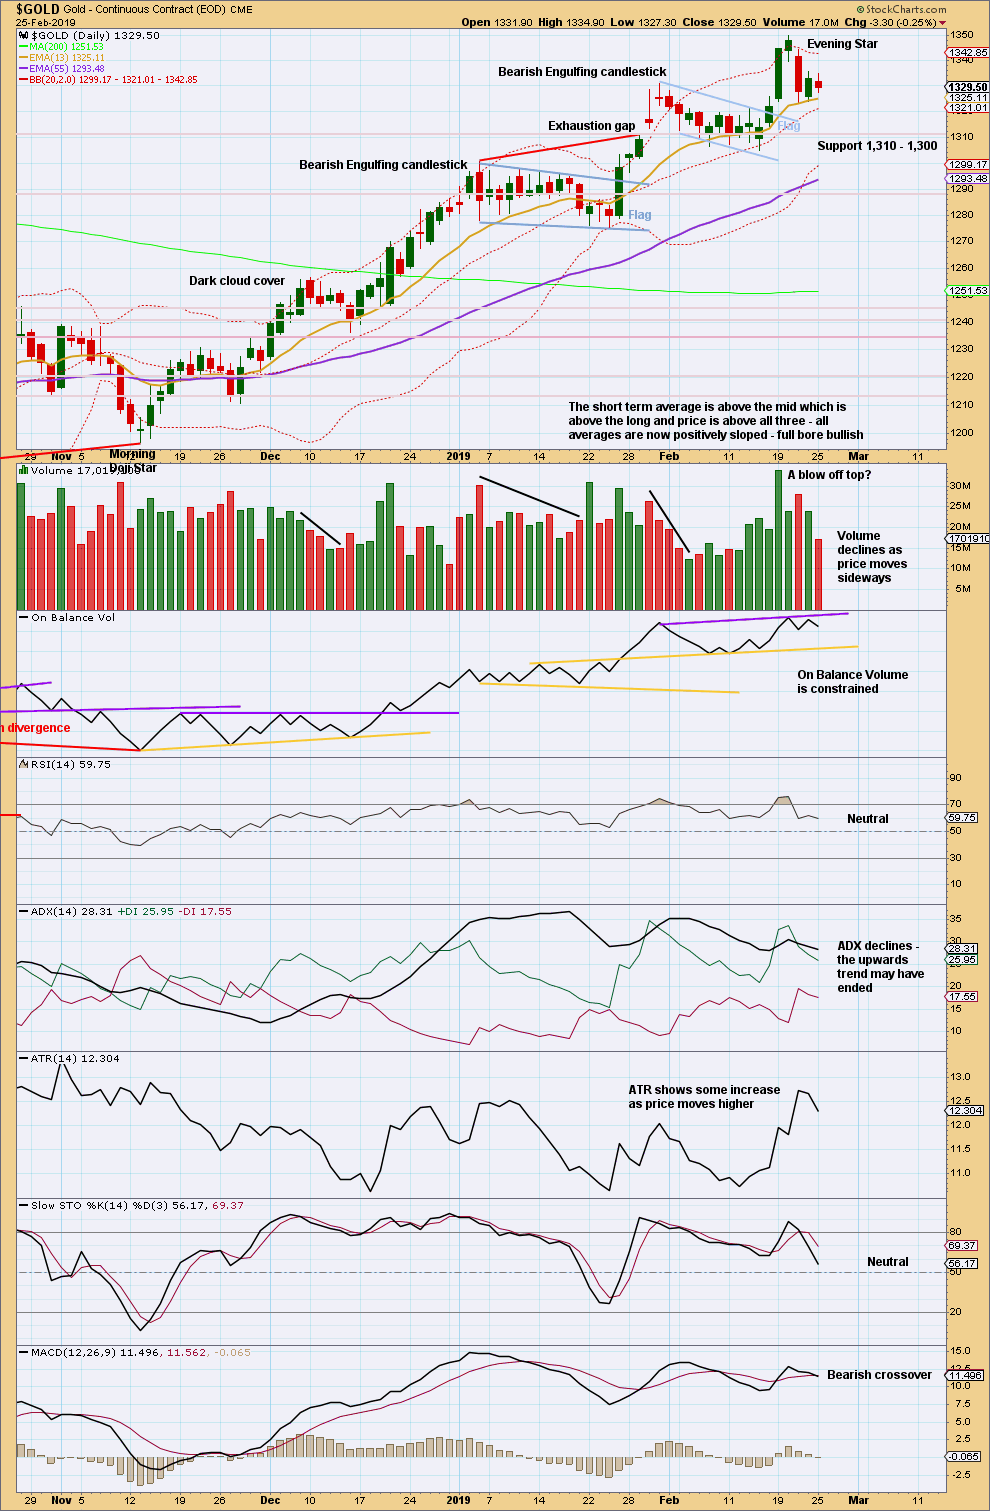
Click chart to enlarge. Chart courtesy of StockCharts.com.
The Evening Star reversal pattern indicates a trend change here to either down or sideways.
The short-term volume profile is bearish. ADX suggests the upwards trend may be over. This chart offers some support to the Elliott wave analysis.
GDX WEEKLY CHART
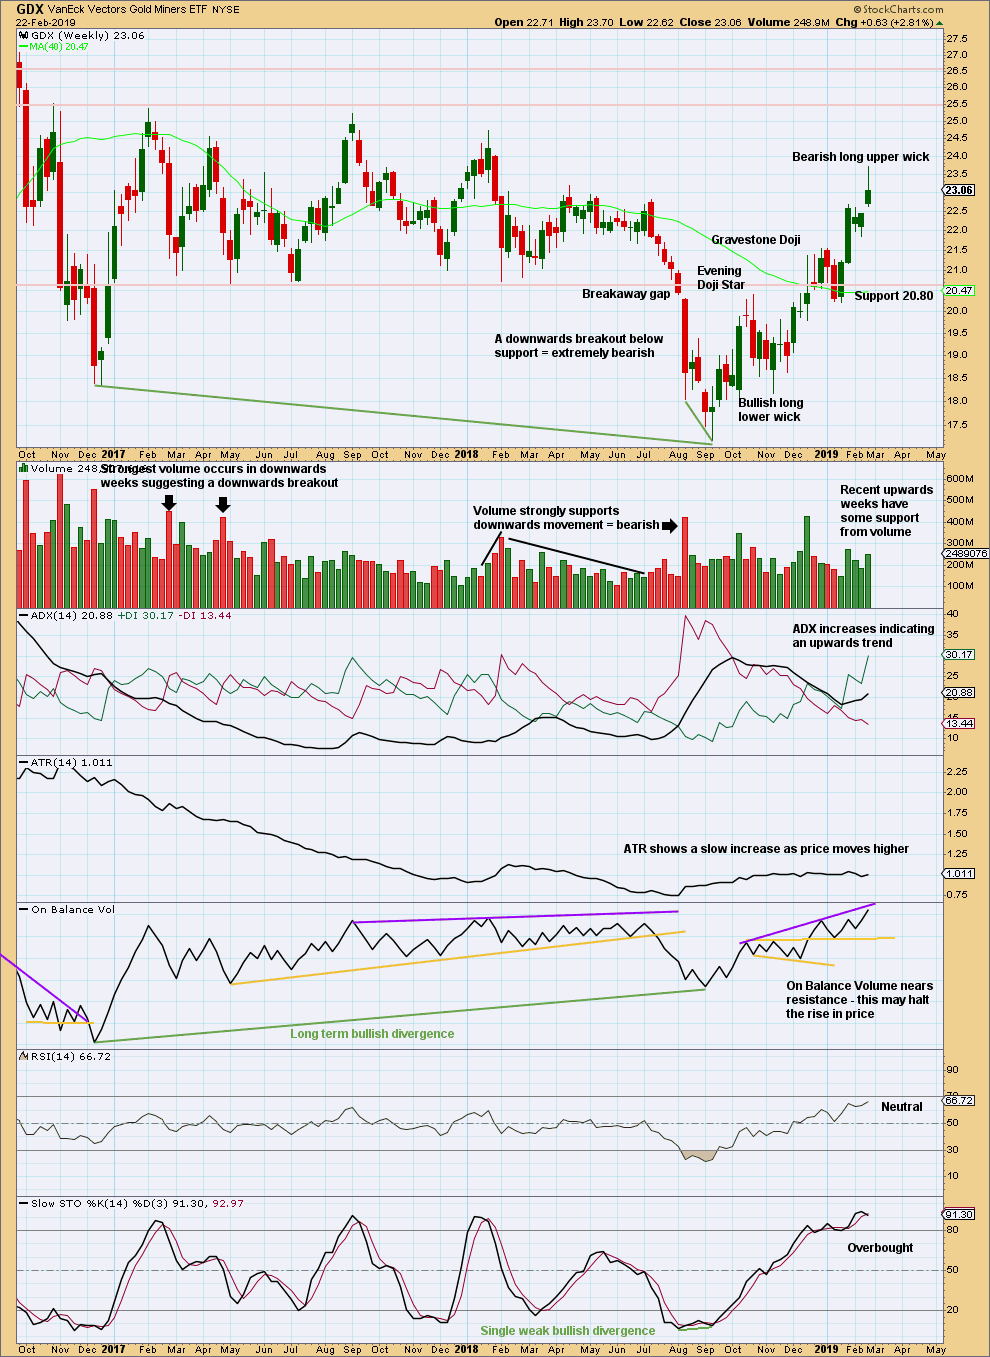
Click chart to enlarge. Chart courtesy of StockCharts.com.
Last week’s candlestick for GDX is not a Shooting Star pattern. The upper wick at 1.83 times the real body is less than the required length of 2. However, the long upper wick still carries a bearish implication.
At this time frame there is as yet no evidence this trend is over. This view may be held while the last gap remains open if price does not make a new low below 22.44.
GDX DAILY CHART
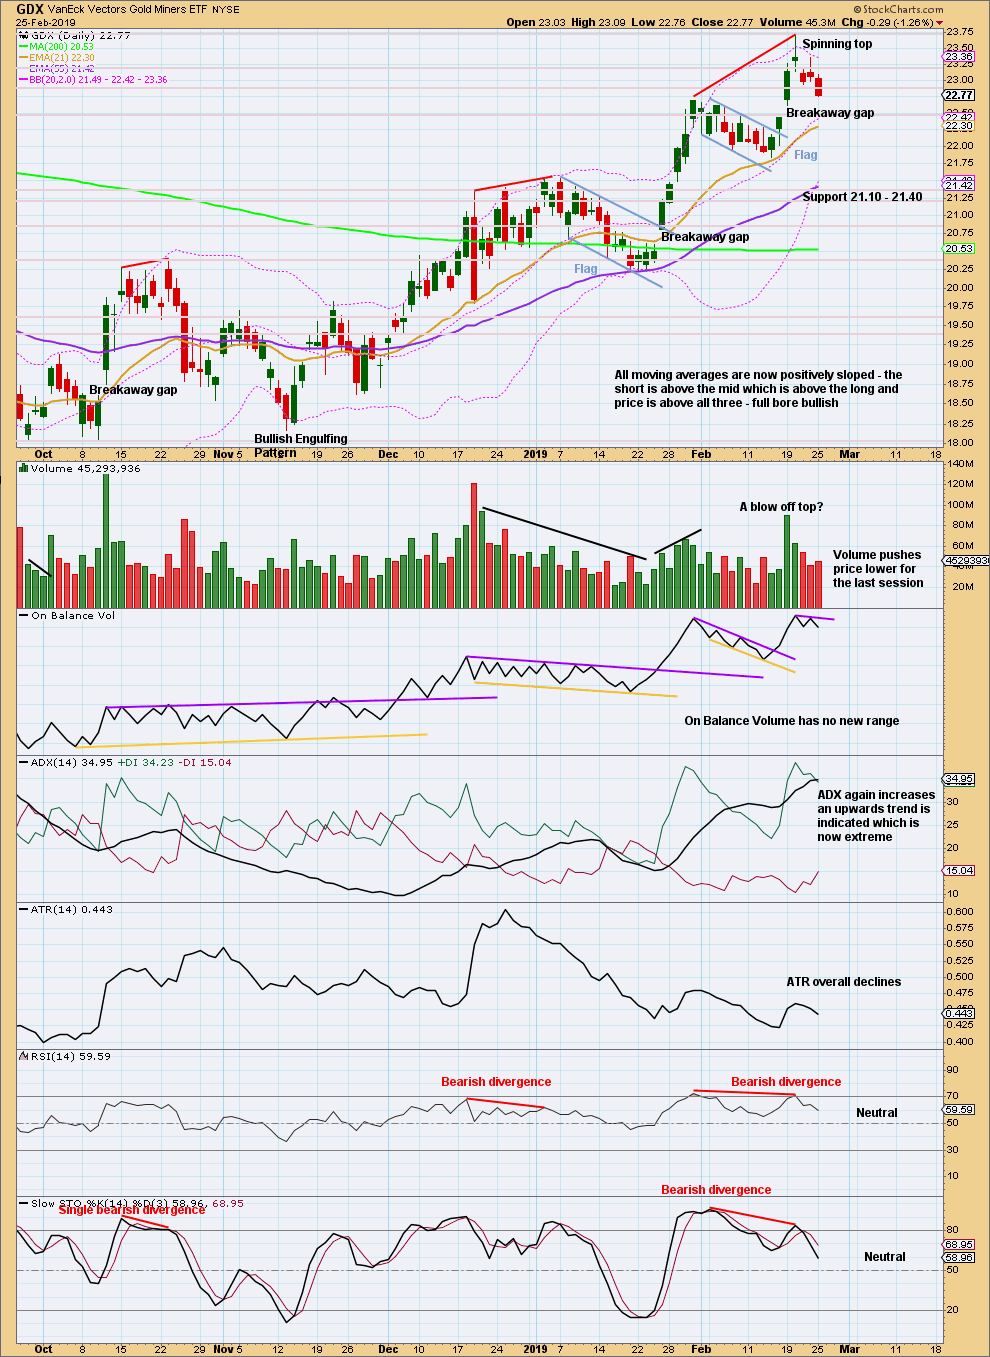
Click chart to enlarge. Chart courtesy of StockCharts.com.
The target from the last flag pattern is calculated at 24.65.
Breakaway gaps may be used in trading. In an upwards trend, breakaway gaps should remain open. The lower edge of this gap may be used to pull up stops to 22.44 to protect profits.
Assume the pullback here may be a brief interruption to the trend while the gap remains open at 22.44.
GDX does not exhibit a candlestick reversal pattern.
If the gap is closed, it would then be relabelled an exhaustion gap and the probability of a trend change would increase. This possibility should be considered more seriously today. This session sees price close almost at the low and volume has pushed price lower. It looks like downwards movement may continue tomorrow.
Published @ 06:13 p.m. EST.
—
Careful risk management protects your trading account(s).
Follow my two Golden Rules:
1. Always trade with stops.
2. Risk only 1-5% of equity on any one trade.
I’m still waiting for minute ii to end.
It still looks like a double zigzag. I can’t relabel it as a flat, it doesn’t meet the rules in that its B wave wouldn’t be 0.9 the length of its A wave.
Within this double zigzag, minuette (x) fits as a zigzag. Within minuette (x), subminuette c fits very neatly as an ending contracting diagonal. There is a little overshoot of the 1-3 trend line by wave 5, this looks typical. That piece of movement looks to be correctly labelled.
no, waiting for end of minute ii
Lots of choppy movements today, does anyone have a position in Gold?