
Two targets are provided: one using Elliott wave and the other a classic analysis target using the last gap.
Summary: The next Elliott wave target is at 1,338. The next classic analysis target is at 1,349.
Assume the trend remains the same until proven otherwise.
For confidence in a trend change the following things may be seen:
1. A candlestick reversal pattern on the daily chart – Friday completes a Bearish Engulfing pattern, but it is not a very strong one.
2. A new low below 1,276.84.
3. A breach of the blue channel on the daily chart.
Once a trend change is indicated, then a new wave down to last years may be expected to make new lows below 1,046.27.
New updates to this analysis are in bold.
Grand SuperCycle analysis is here.
Last historic analysis with monthly charts is here.
Only two remaining wave counts have a reasonable probability and are published below: a triangle (the preferred wave count) and a double zigzag.
MAIN ELLIOTT WAVE COUNT
WEEKLY CHART – TRIANGLE
Click chart to enlarge.
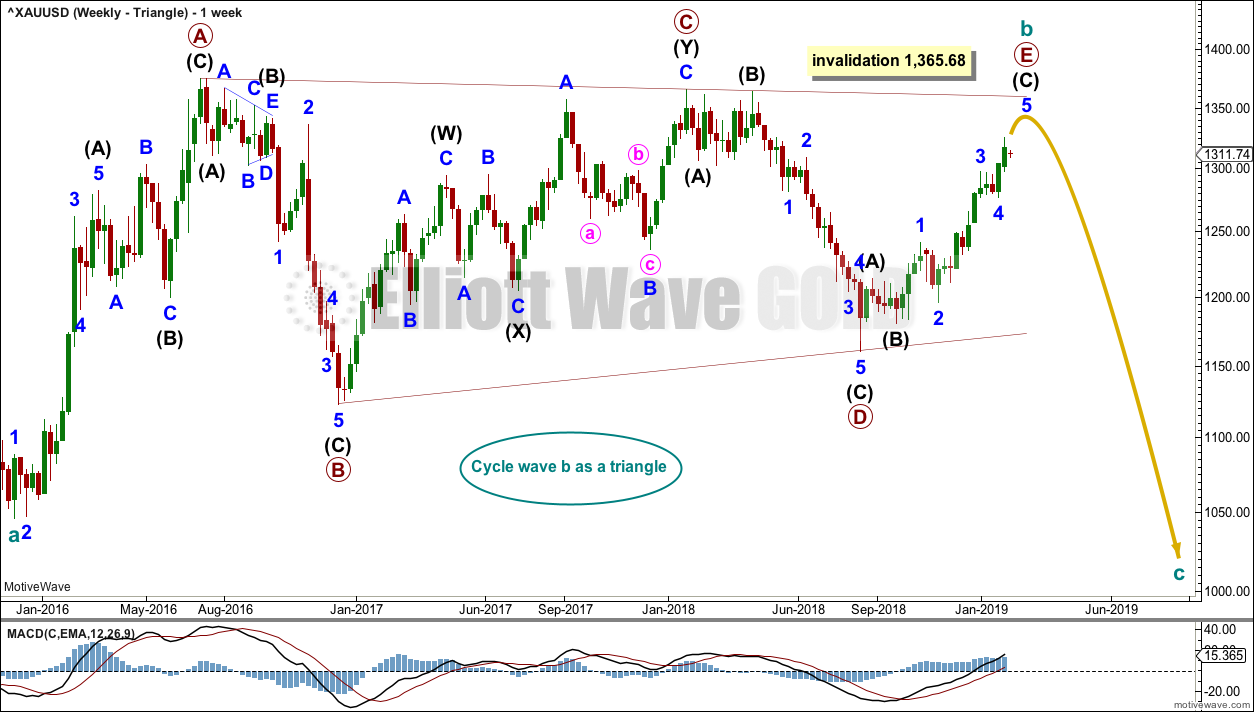
Cycle wave b may be an almost complete regular contracting triangle. Primary wave E may not move beyond the end of primary wave C above 1,365.68.
Within primary wave E, intermediate waves (A) and (B) may be complete. Intermediate wave (C) must subdivide as a five wave structure. This structure is now almost complete.
Four of the five sub-waves of a triangle must be zigzags, with only one sub-wave allowed to be a multiple zigzag. Wave C is the most common sub-wave to subdivide as a multiple, and this is how primary wave C for this example fits best. Primary wave E looks like it is unfolding as a single zigzag.
There are no problems in terms of subdivisions or rare structures for this wave count. It has an excellent fit and so far a typical look.
When primary wave E is a complete three wave structure, then this wave count would expect a cycle degree trend change. Cycle wave c would most likely make new lows below the end of cycle wave a at 1,046.27 to avoid a truncation.
It is possible now that primary wave E may end this week. It is also possible it could have been over at last week’s high. Some reasonable weakness should be expected at its end. Triangles often end with declining ATR, weak momentum and weak volume.
If this weekly wave count is correct, then cycle wave c downwards should begin with some strength, ATR should show some increase, and MACD should exhibit an increase in downwards momentum.
DAILY CHART – TRIANGLE
Click chart to enlarge.
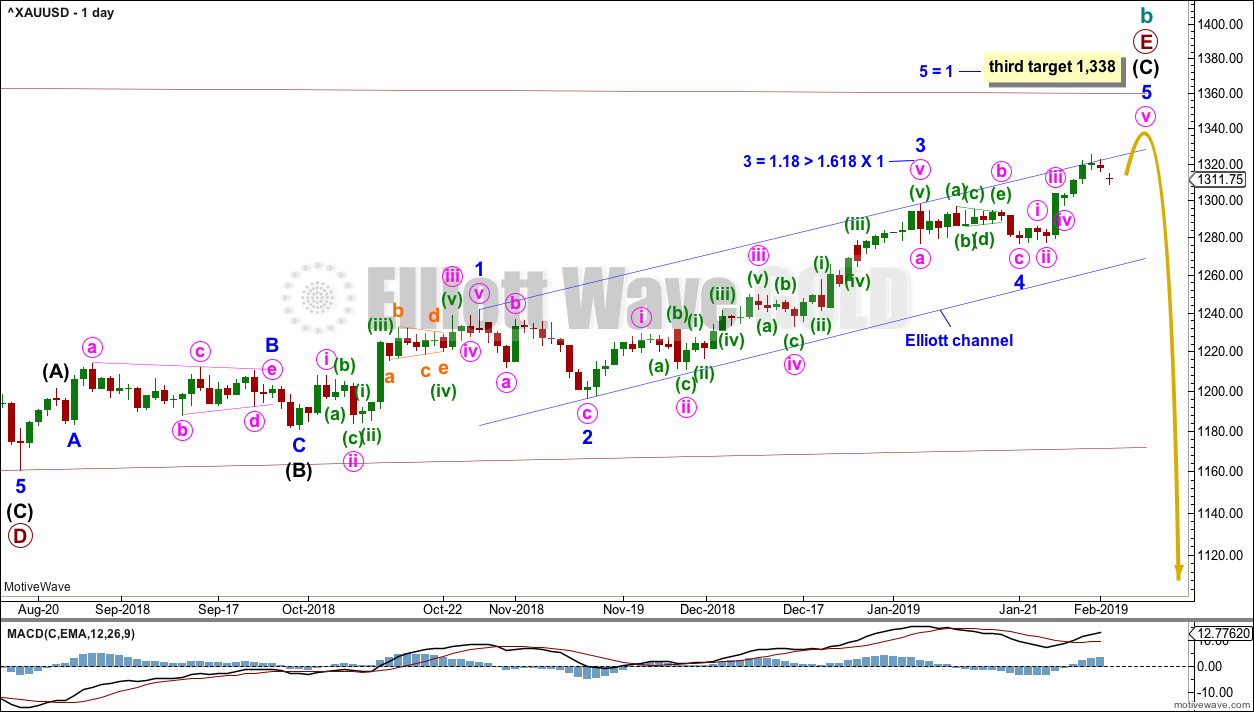
Primary wave E may now be almost complete for this wave count.
Primary wave E should subdivide as a zigzag. Intermediate waves (A) and (B) may now be complete. Intermediate wave (C) may be complete, but as yet there is no confidence in a high.
It is now possible to see minor wave 5 complete at the daily and hourly chart level. However, it is always safest to assume the trend remains the same until proven otherwise. For any confidence in a trend change it needs to be indicated by one or more of the following:
1. A candlestick reversal pattern on the daily chart – Friday’s candlestick is a Bearish Engulfing pattern, but it is not a strong one.
2. A new low below 1,276.84.
3. A breach of the blue channel on the daily chart.
One target now remains for minor wave 5 to end.
The target would expect primary wave E to fall short of the maroon A-C trend line. This is the most common look for E waves of Elliott wave triangles.
MAIN HOURLY CHART
Click chart to enlarge.
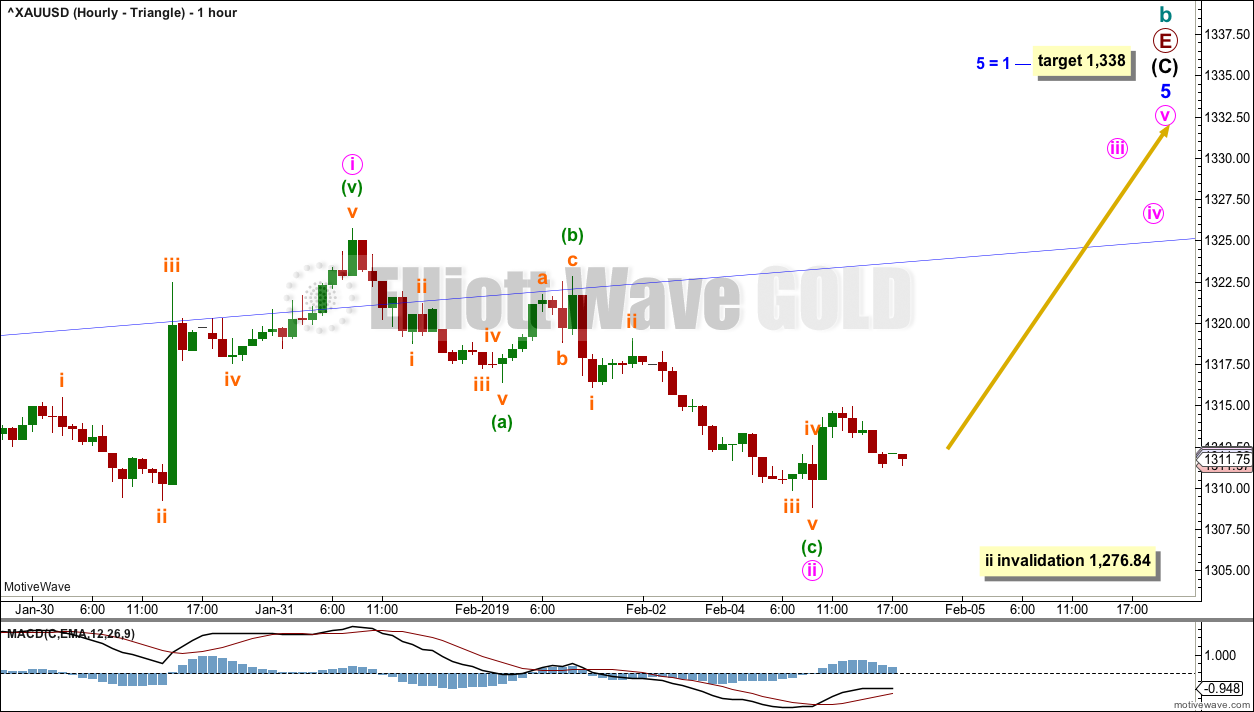
Both hourly charts today will be labelled the same, with the exception of the degree of labelling within minor wave 5. This main wave count is the main count only because we should assume the trend remains the same until proven otherwise.
If minor wave 5 is incomplete, then the best wave count at this stage would move the degree of labelling within it all down one degree to see only minute wave i complete at the last high.
Minute wave ii may not move beyond the start of minute wave i below 1,276.84.
Minute wave ii may be a complete zigzag, subdividing 5-3-5. Minute wave iii must move above the end of minute wave i.
ALTERNATE HOURLY CHART
Click chart to enlarge.
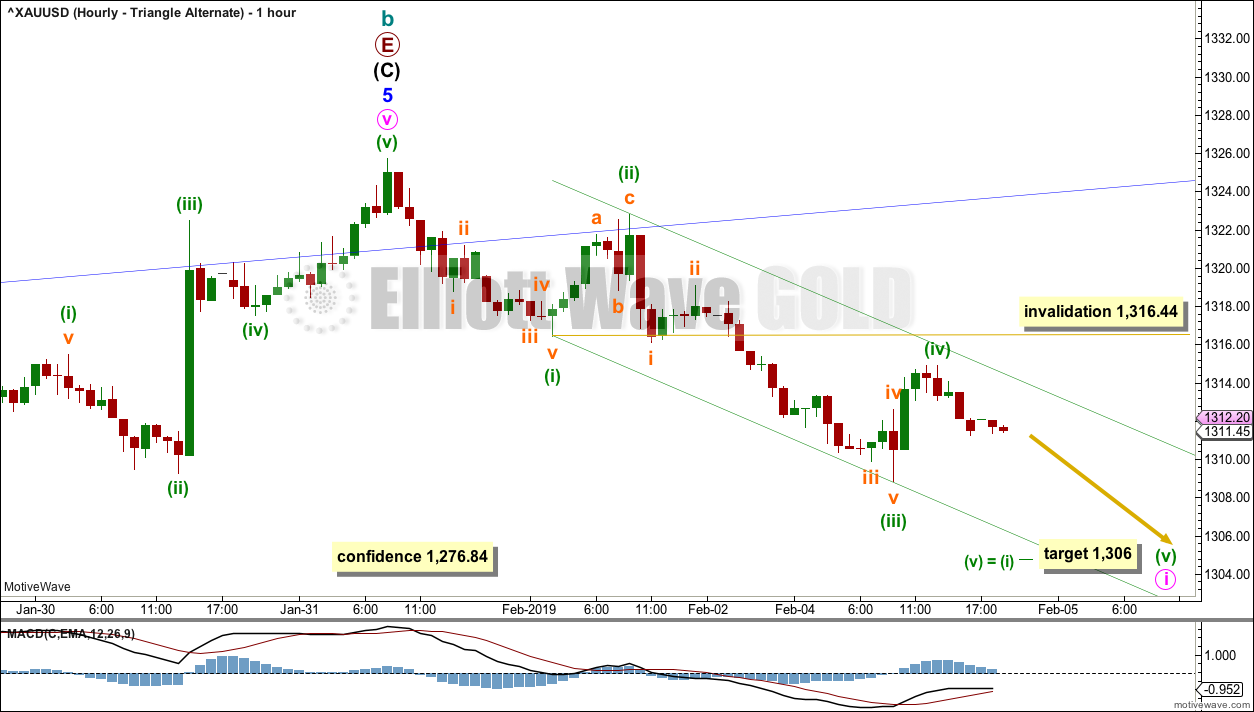
This wave count moves the degree of labelling within minor wave 5 back up one degree. It is possible that minor wave 5 could have been over at the last high.
This wave count assumes a cycle degree trend change at the last high.
Cycle wave c must begin with a clear five wave structure at hourly and daily chart levels. While that is incomplete, no second wave correction may move beyond its start above 1,325.73.
A five wave impulse may be unfolding lower. So far minuette waves (i) through to (iv) may be complete. Minuette wave (iv) may not move into minuette wave (i) price territory above 1,316.44.
The green Elliott channel may provide support for minuette wave (v).
WEEKLY CHART – DOUBLE ZIGZAG
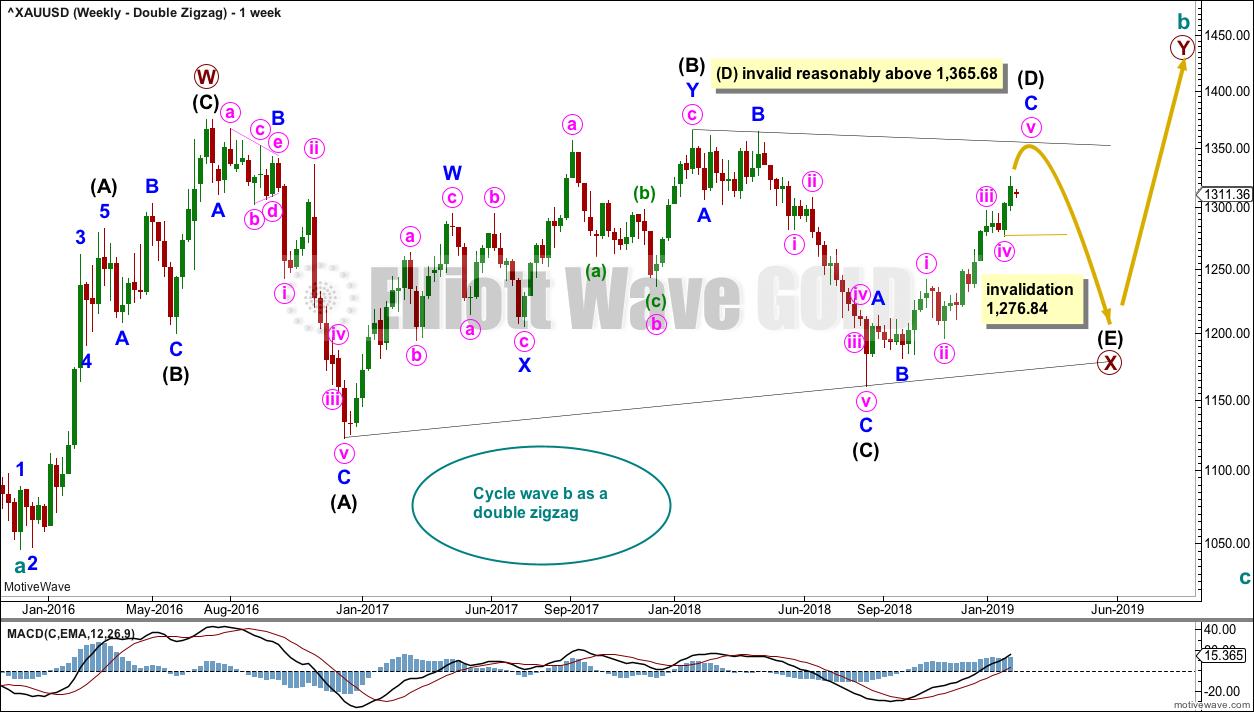
Click chart to enlarge.
It is possible that cycle wave b may be a double zigzag or a double combination.
The first zigzag in the double is labelled primary wave W. This has a good fit.
The double may be joined by a corrective structure in the opposite direction, a triangle labelled primary wave X. The triangle would be about three quarters complete.
Within the triangle of primary wave X, intermediate wave (C) should be complete. Within intermediate wave (D), minor waves A and B may be complete. Minor wave C must subdivide as a five wave structure. Within minor wave C, minute wave iv should now be over. Within minute wave v, no second wave correction may move beyond its start below 1,276.84.
Intermediate wave (D) would most likely subdivide as a single zigzag. Intermediate wave (D) should end at the upper (B)-(D) trend line for this wave count, so that the triangle adheres neatly to this trend line. That price point is about 1,354. This wave count now requires upwards movement to continue. It would not be acceptable for the upper (B)-(D) trend line to have breaches or substantial overshoots. Elliott wave triangles almost always adhere very neatly to their trend lines.
Intermediate wave E should continue to exhibit weakness: ATR should continue to show a steady decline, and MACD may begin to hover about zero.
This wave count may now expect choppy overlapping movement in an ever decreasing range for a few more months.
Primary wave Y would most likely be a zigzag because primary wave X would be shallow; double zigzags normally have relatively shallow X waves.
Primary wave Y may also be a flat correction if cycle wave b is a double combination, but combinations normally have deep X waves. This would be less likely.
This wave count has good proportions and no problems in terms of subdivisions.
TECHNICAL ANALYSIS
WEEKLY CHART
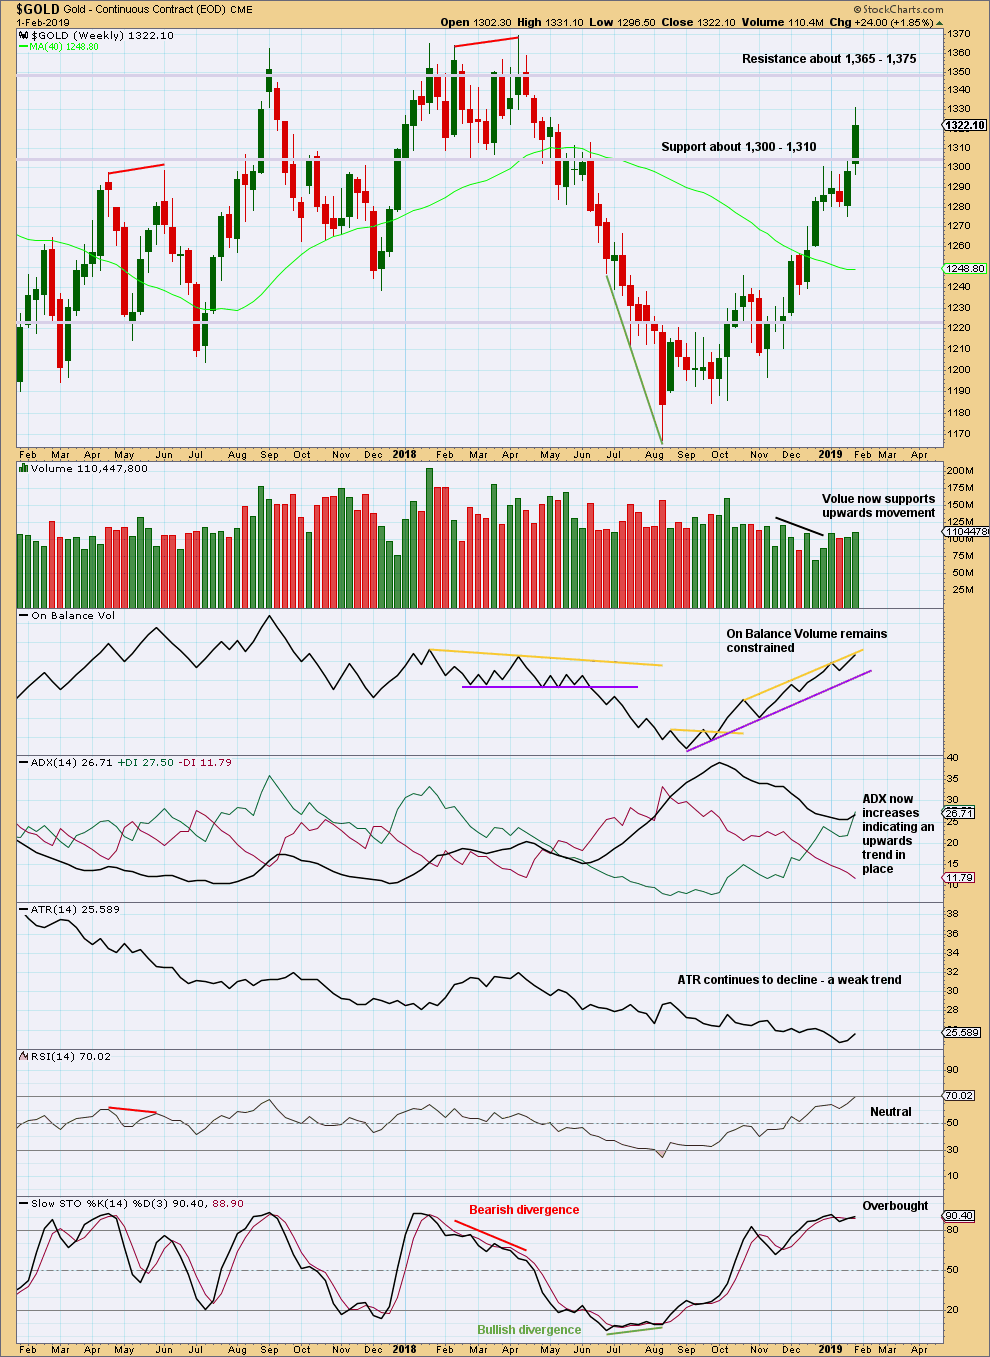
Click chart to enlarge. Chart courtesy of StockCharts.com.
ADX now indicates an upwards trend. Volume supports it. This chart is mostly bullish. There is strong resistance ahead at 1,365 – 1,375.
DAILY CHART
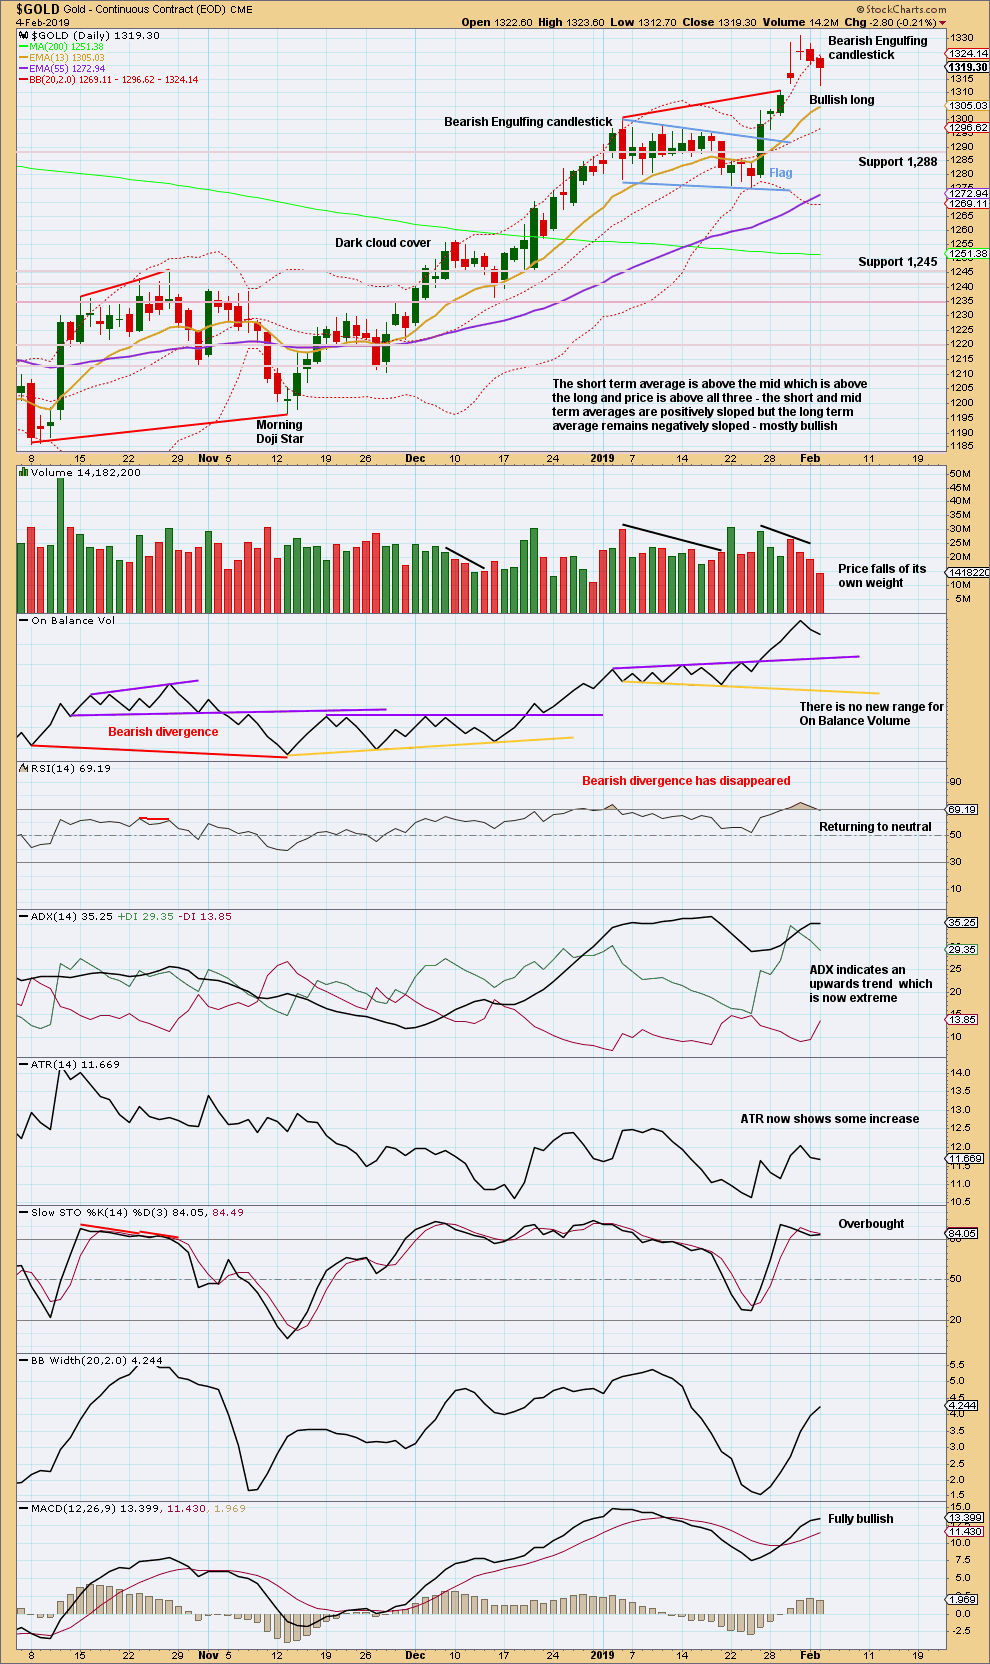
Click chart to enlarge. Chart courtesy of StockCharts.com.
Using the flag pole length, a target at 1,359 is calculated. This target looks rather optimistic.
The last gap may be a measuring gap. A shorter-term target calculated using this gap is at 1,349.
With the trend now extreme and a bearish candlestick reversal pattern, some caution regarding the above targets would be advisable. However, Friday’s candlestick has a small real body; this is not a strong Bearish Engulfing pattern.
Now the bullish long lower wick on Monday’s candlestick puts a little further doubt on the bearishness of Friday’s candlestick reversal pattern. Another flag or pennant pattern may be currently unfolding.
If the last gap is closed with a new low at or below 1,310.80, then it would be considered an exhaustion gap. That would add a little confidence that a high may be in place.
GDX WEEKLY CHART
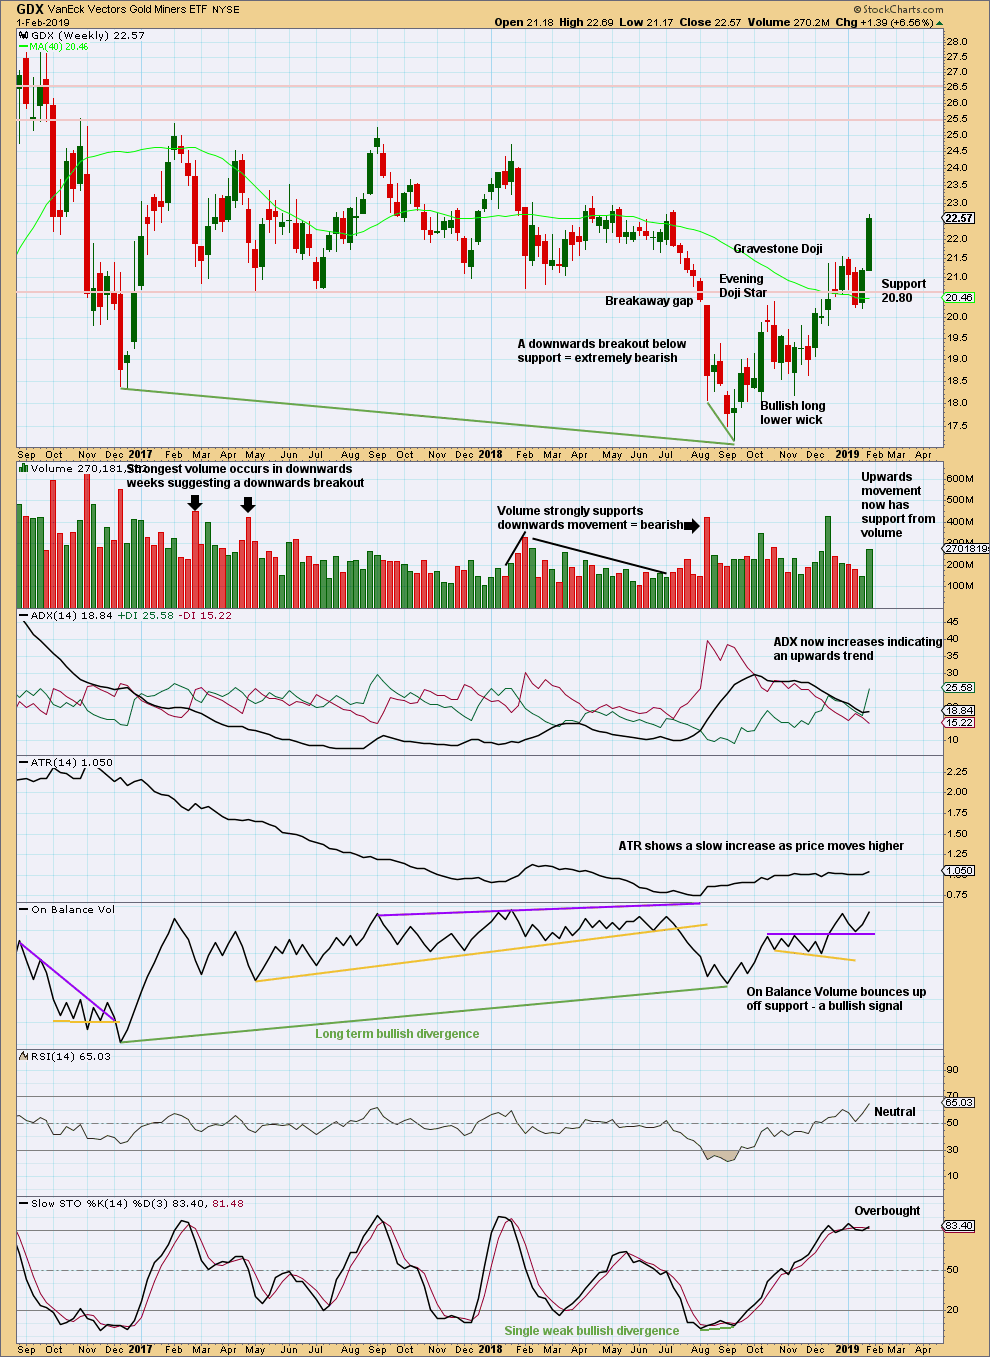
Click chart to enlarge. Chart courtesy of StockCharts.com.
A close back above 20.80 switches the short-term outlook from bearish to neutral or bullish. Last weekly candlestick is very strong and has good support from volume. This is bullish for the short term.
GDX DAILY CHART
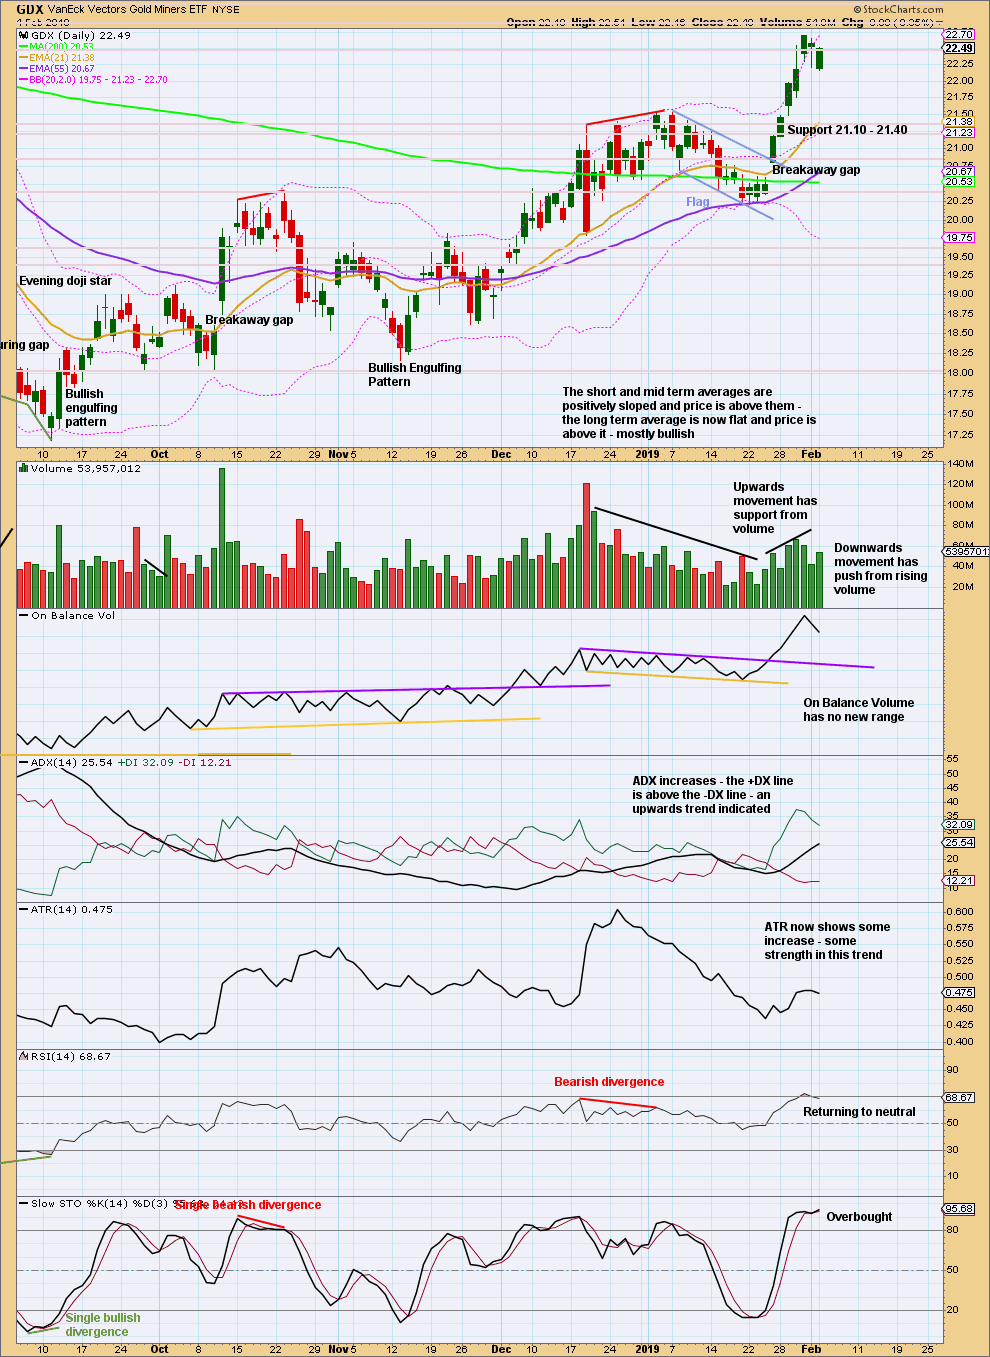
Click chart to enlarge. Chart courtesy of StockCharts.com.
The flag pattern remains valid for GDX. It lasted 14 sessions and now looks complete with an upwards breakout on Friday.
Flags are continuation patterns. The target would be about 22.60.
Assume the trend remains the same until proven otherwise. There is no evidence of a trend change for GDX; assume price will keep moving higher to the target.
Published @ 07:55 p.m. EST.
—
Careful risk management protects your trading account(s).
Follow my two Golden Rules:
1. Always trade with stops.
2. Risk only 1-5% of equity on any one trade.
Thnks Lara for the update, and — enjoyed seeing the process of developing a wave count 2/1 video.
Great. I’ll do another one.
Triangle alternate hourly chart updated:
I’m labelling minute i now as complete. Within it minuette (iv) is much more brief than minuette (ii) and that’s okay because it is a common tendency for Gold to exhibit more brief fourth waves than counterpart second waves. This looks fairly typical for this market.
Gold also typically exhibits very deep second wave corrections at the beginning of a new move. Look out for minute ii to maybe be deeper than the 0.618 Fibonacci ratio of minute i.
If it gets that high then look for a possible back test of the blue trend line. Copy this channel over from the daily chart.