

S&P 500
The first target at 2,767 was met and price kept rising. The next target is now used.
Summary: The target is at 2,856. The upwards trend should be assumed to continue as long as price remains within the blue Elliott channel.
The bigger picture still expects that a low may now be in place.
The final target is at 3,045 with a limit at 3,477.39.
This upwards trend shows increasing internal strength: It began with two 90% upwards days close to the low and now the AD line and On Balance Volume have both made new all time highs.
The biggest picture, Grand Super Cycle analysis, is here.
The monthly chart was last published here.
ELLIOTT WAVE COUNT
WEEKLY CHART
Click chart to enlarge.
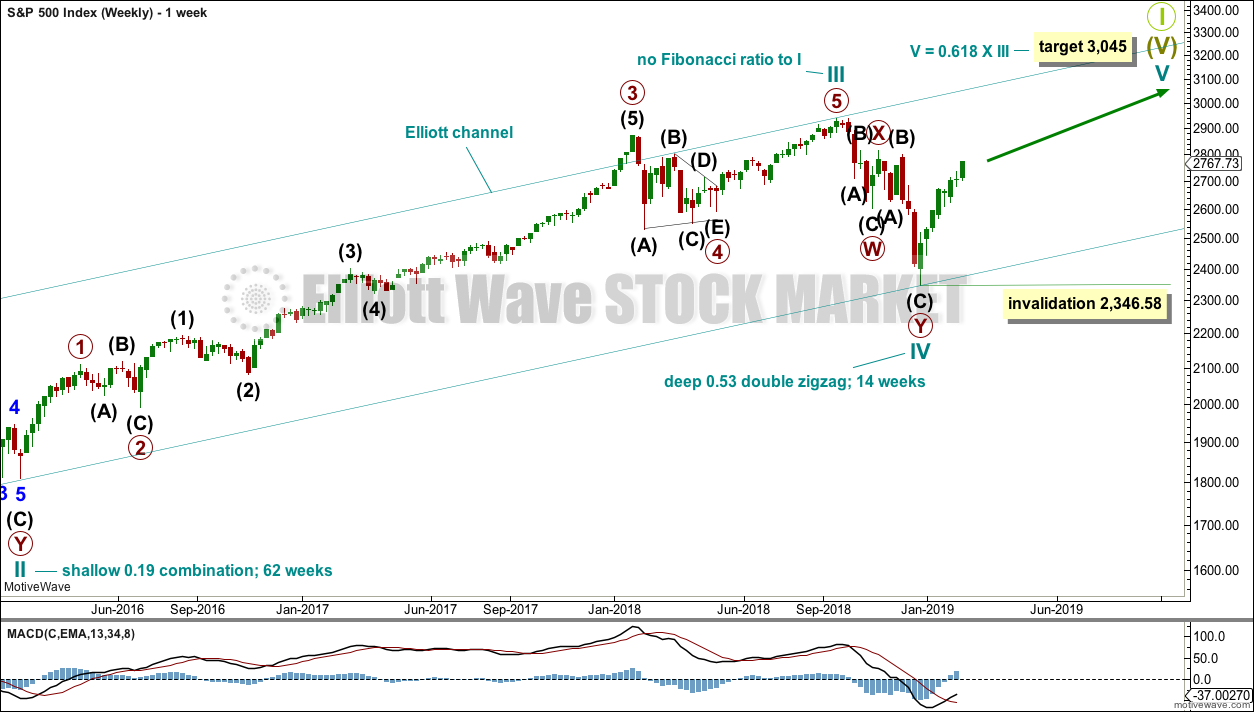
This weekly chart shows all of cycle waves III, IV and V so far.
Cycle wave II fits as a time consuming double combination: flat – X – zigzag. Combinations tend to be more time consuming corrective structures than zigzags. Cycle wave IV has completed as a multiple zigzag that should be expected to be more brief than cycle wave II.
Cycle wave IV may have ended at the lower edge of the Elliott channel.
Within cycle wave V, no second wave correction may move beyond the start of its first wave below 2,346.58.
Although both cycle waves II and IV are labelled W-X-Y, they are different corrective structures. There are two broad groups of Elliott wave corrective structures: the zigzag family, which are sharp corrections, and all the rest, which are sideways corrections. Multiple zigzags belong to the zigzag family and combinations belong to the sideways family. There is perfect alternation between the possible double zigzag of cycle wave IV and the combination of cycle wave II.
Although there is gross disproportion between the duration of cycle waves II and IV, the size of cycle wave IV in terms of price makes these two corrections look like they should be labelled at the same degree. Proportion is a function of either or both of price and time.
Draw the Elliott channel about Super Cycle wave (V) with the first trend line from the end of cycle wave I (at 2,079.46 on the week beginning 30th November 2014) to the high of cycle wave III, then place a parallel copy on the low of cycle wave II. Cycle wave V may find resistance about the upper edge.
It is possible that cycle wave V may end in October 2019. If it does not end there, or if the AD line makes new all time highs during or after June 2019, then the expectation for cycle wave V to end would be pushed out to March 2020 as the next possibility.
DAILY CHART
Click chart to enlarge.
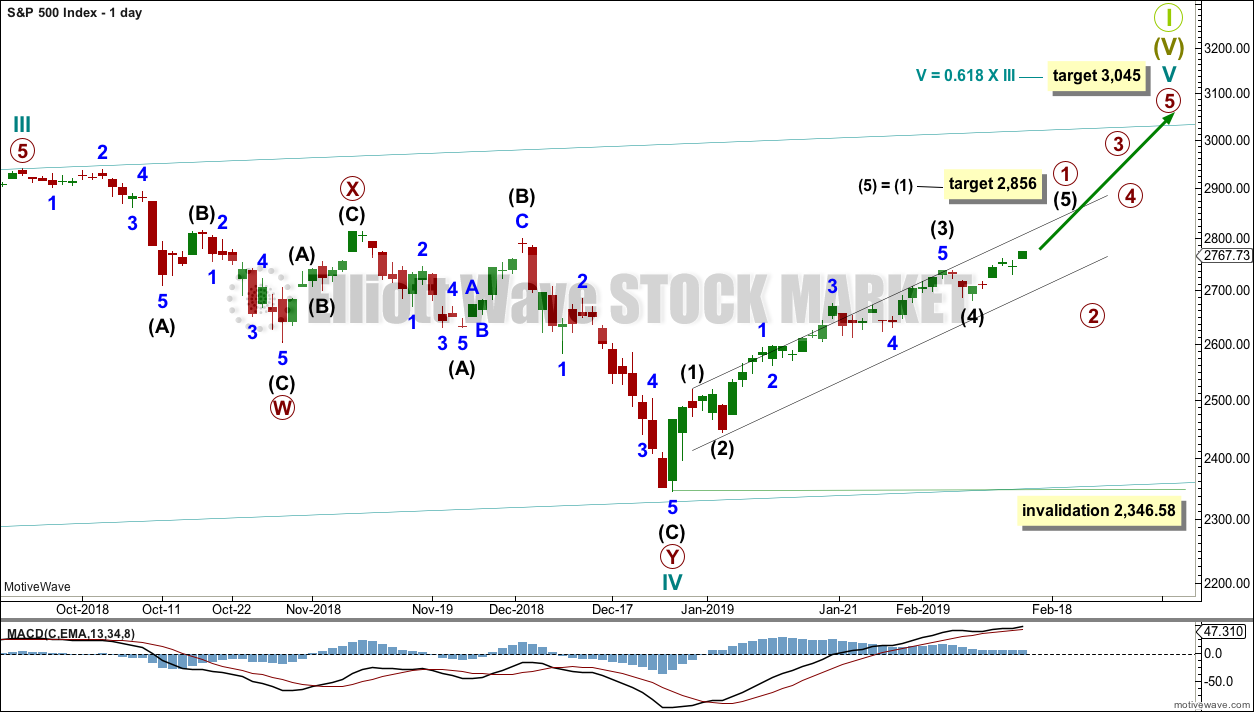
The daily chart will focus on the structure of cycle waves IV and V.
Cycle wave IV now looks like a complete double zigzag. This provides perfect alternation with the combination of cycle wave II. Double zigzags are fairly common corrective structures.
Within Super Cycle wave (V), cycle wave III may not be the shortest actionary wave. Because cycle wave III is shorter than cycle wave I, this limits cycle wave V to no longer than equality in length with cycle wave III at 3,477.39. A target is calculated for cycle wave V to end prior to this point.
Cycle wave V must subdivide as a five wave motive structure, either an impulse or an ending diagonal. An impulse is much more common and that will be how it is labelled. A diagonal would be considered if overlapping suggests it.
Primary wave 1 is labelled as incomplete.
Primary wave 2 may not move beyond the start of primary wave 1 below 2,346.58.
TECHNICAL ANALYSIS
WEEKLY CHART
Click chart to enlarge. Chart courtesy of StockCharts.com.
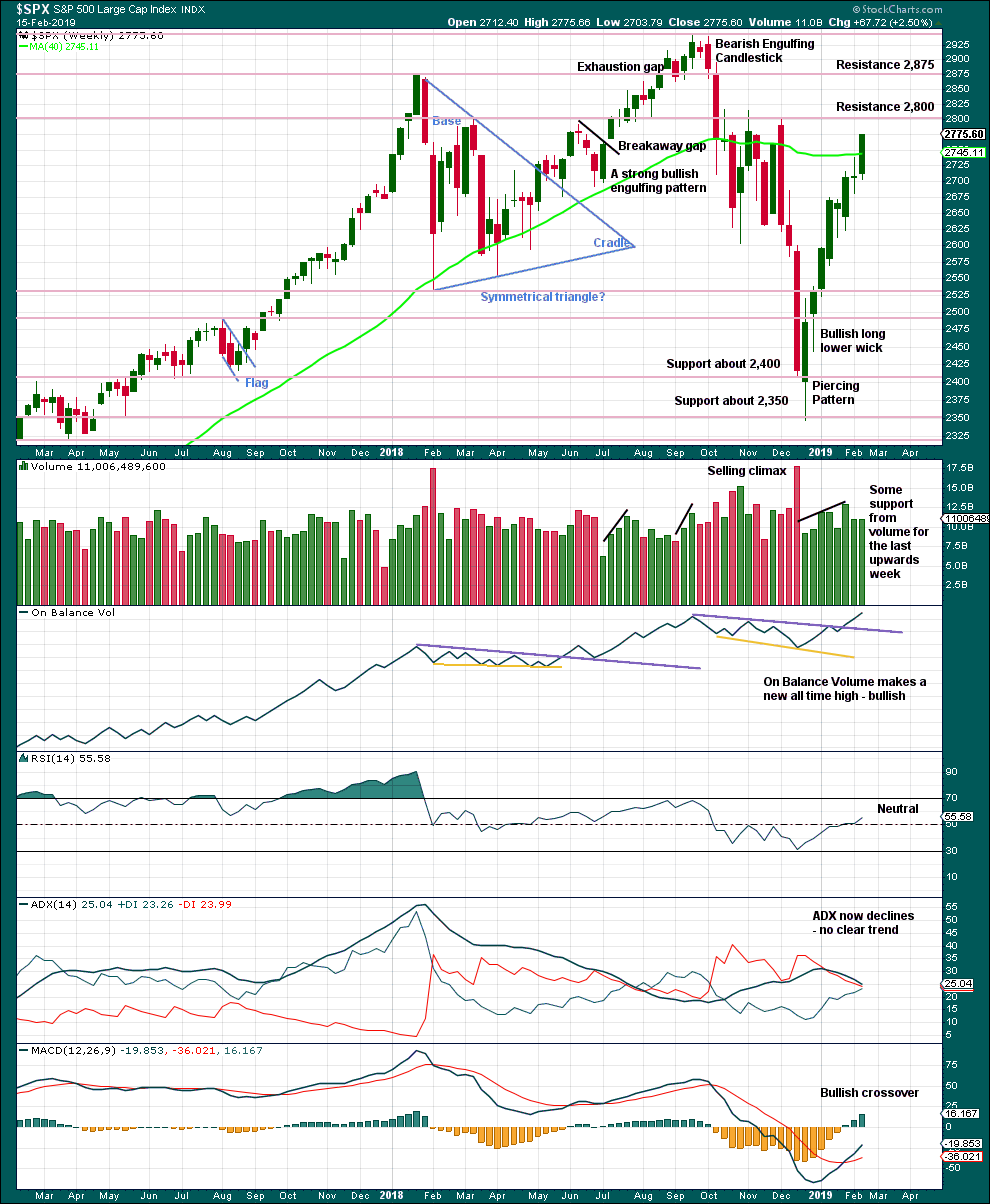
This week completes a very bullish week. The lower wick and shaven head of this green candlestick is bullish. A little support from volume is bullish.
ADX has not yet caught up with the upwards trend. RSI indicates there is room for it to continue for a reasonable distance.
DAILY CHART
Click chart to enlarge. Chart courtesy of StockCharts.com.
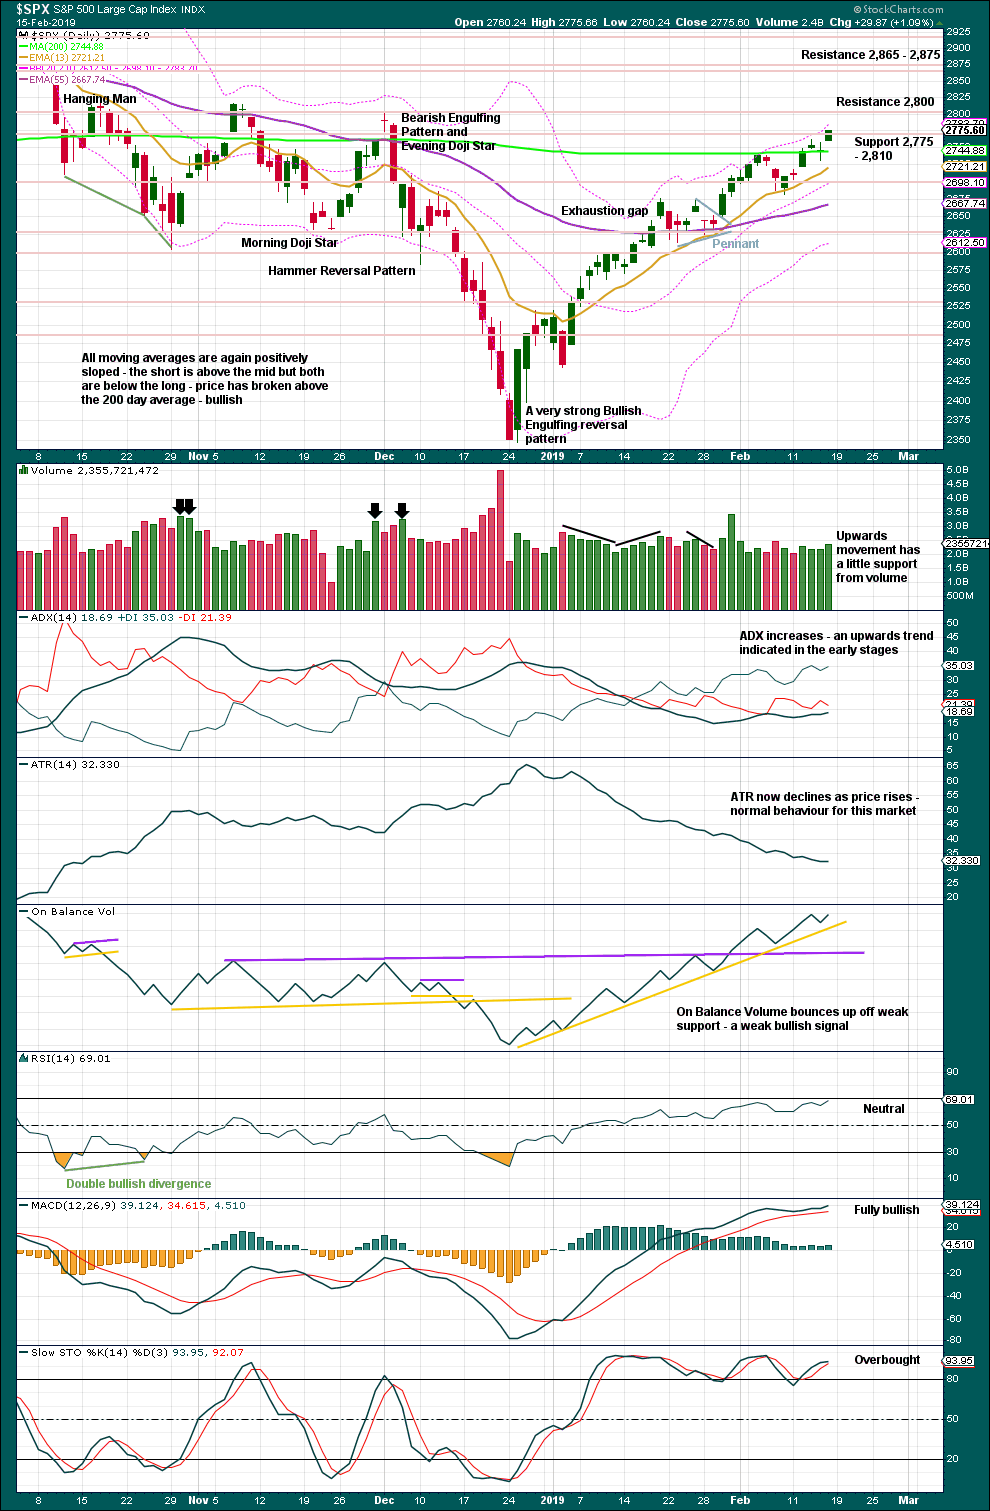
Over a fairly long period of time this ageing bull market has been characterised by upwards movement on light and declining volume and low ATR. For the short to mid term, little concern may be had if price now rises again on declining volume. Current market conditions have allowed for this during a sustained rise in price.
It is also normal for this market to have lower ATR during bullish phases, and strongly increasing ATR during bearish phases. Currently, declining ATR is normal and not of a concern.
Considering the larger picture from the Elliott wave count, some weakness approaching the end of Grand Super Cycle wave I is to be expected.
From Kirkpatrick and Dhalquist, “Technical Analysis” page 152:
“A 90% downside day occurs when on a particular day, the percentage of downside volume exceeds the total of upside and downside volume by 90% and the percentage of downside points exceeds the total of gained points and lost points by 90%. A 90% upside day occurs when both the upside volume and points gained are 90% of their respective totals”…
and “A major reversal is singled when an NPDD is followed by a 90% upside day or two 80% upside days back-to-back”.
The current situation saw two 80% downside days on December 20th and 21st, then a near 90% downside day with 88.97% downside on December 24th. This very heavy selling pressure on three sessions together may be sufficient to exhibit the pressure observed in a 90% downside day.
This has now been followed by two 90% upside days: on December 26th and again on 4th January.
The current situation looks very much like a major low has been found.
This chart is overall very bullish. Only the moving averages are not yet full bore bullish.
Price does not move in straight lines though. There will be small and large pullbacks within the trend. Use them as opportunities.
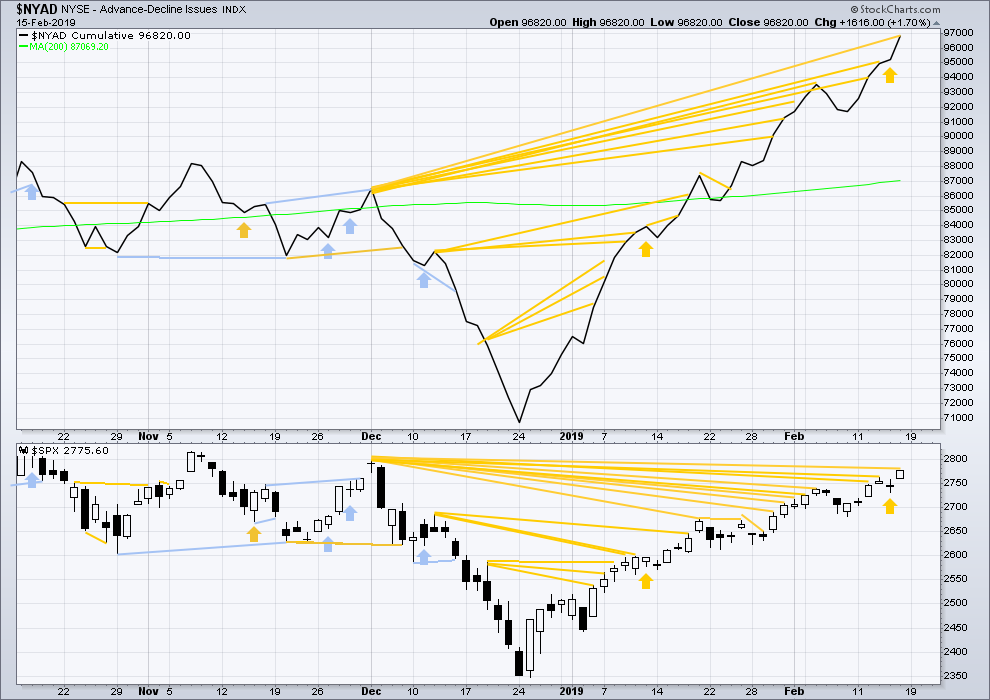
BREADTH – AD LINE
WEEKLY CHART

Click chart to enlarge. Chart courtesy of StockCharts.com. So that colour blind members are included, bearish signals
will be noted with blue and bullish signals with yellow.
Every single bear market from the Great Depression and onwards has been preceded by a minimum of 4-6 months divergence between price and the AD line. With the AD line making a new all time high this week, the end of this bull market and the start of a new bear market must be a minimum of 4 months away, which is mid June 2019 at this time.
DAILY CHART
Click chart to enlarge. Chart courtesy of StockCharts.com. So that colour blind members are included, bearish signals
will be noted with blue and bullish signals with yellow.
Breadth should be read as a leading indicator.
There is now a cluster of bullish signals from the AD line. This supports the Elliott wave count.
The AD line has made another new high above the high of the 3rd of December, but price has not. This divergence is bullish.
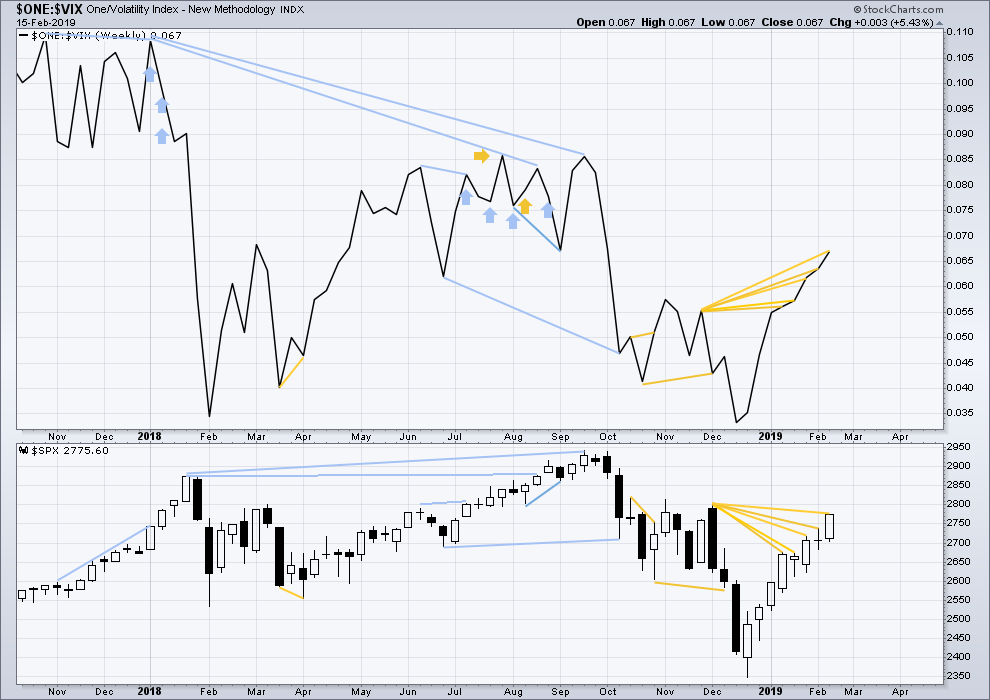
VOLATILITY – INVERTED VIX CHART
WEEKLY CHART
Click chart to enlarge. Chart courtesy of StockCharts.com. So that colour blind members are included, bearish signals
will be noted with blue and bullish signals with yellow.
Inverted VIX has made yet another new high above the prior swing high of the weeks beginning 26th of November and 3rd of December 2018, but price has not. This divergence is bullish for the mid term.
DAILY CHART
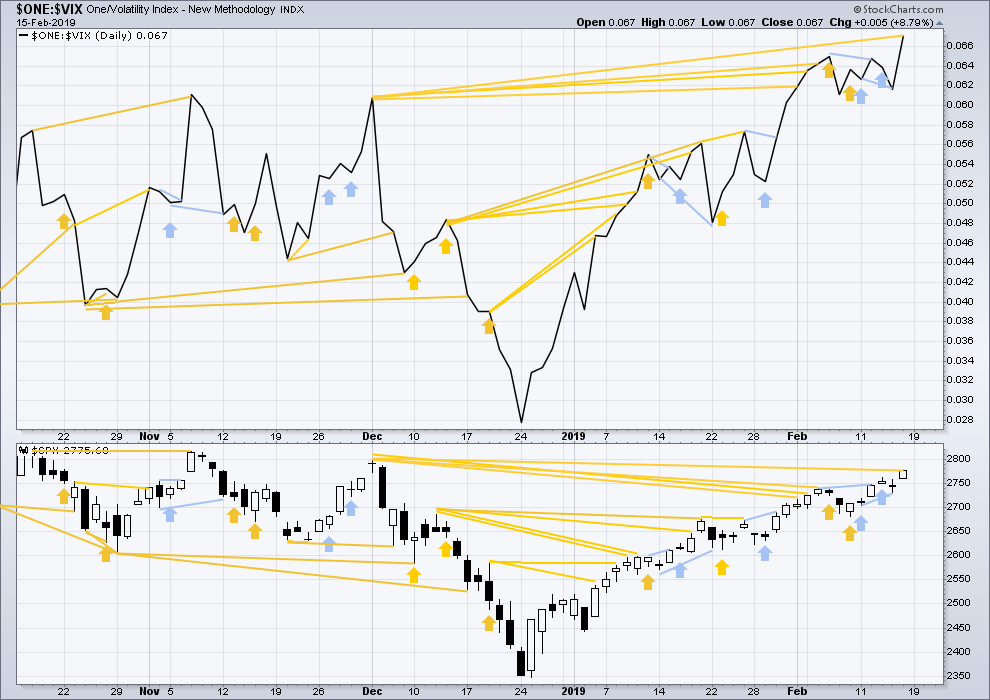
Click chart to enlarge. Chart courtesy of StockCharts.com. So that colour blind members are included, bearish signals
will be noted with blue and bullish signals with yellow.
Inverted VIX has made a new high above the prior high of the 3rd of December, but price has not. This divergence is bullish.
DOW THEORY
Dow Theory confirms a bear market. This does not necessarily mean a bear market at Grand Super Cycle degree though; Dow Theory makes no comment on Elliott wave counts. On the 25th of August 2015 Dow Theory also confirmed a bear market. The Elliott wave count sees that as part of cycle wave II. After Dow Theory confirmation of a bear market in August 2015, price went on to make new all time highs and the bull market continued.
DJIA: 23,344.52 – a close on the 19th of December at 23,284.97 confirms a bear market.
DJT: 9,806.79 – price has closed below this point on the 13th of December.
S&P500: 2,532.69 – a close on the 19th of December at 2,506.96 provides support to a bear market conclusion.
Nasdaq: 6,630.67 – a close on the 19th of December at 6,618.86 provides support to a bear market conclusion.
With all the indices moving now higher, Dow Theory would confirm a bull market if the following highs are made:
DJIA: 26,951.81
DJT: 11,623.58
S&P500: 2,940.91
Nasdaq: 8,133.30.
GOLD
Price still remains within an identified consolidation zone. Friday’s strong upwards day lacks support from volume. The breakout from a flag pattern is suspicious.
Summary: A new high above 1,325.74 is required for confidence that the upwards trend remains. The target would be at 1,341.
A new low below 1,300 would indicate a high may be in place.
Some indication of a trend change is seen by a weak bearish engulfing reversal pattern and closure of the last gap.
For reasonable confidence in a trend change the remaining things may be seen:
1. A new low below 1,302.62.
2. A breach of the blue channel on the daily chart.
Once a trend change is indicated, then a new wave down to last years may be expected to make new lows below 1,046.27.
Grand SuperCycle analysis is here.
Last historic analysis with monthly charts is here.
MAIN ELLIOTT WAVE COUNT
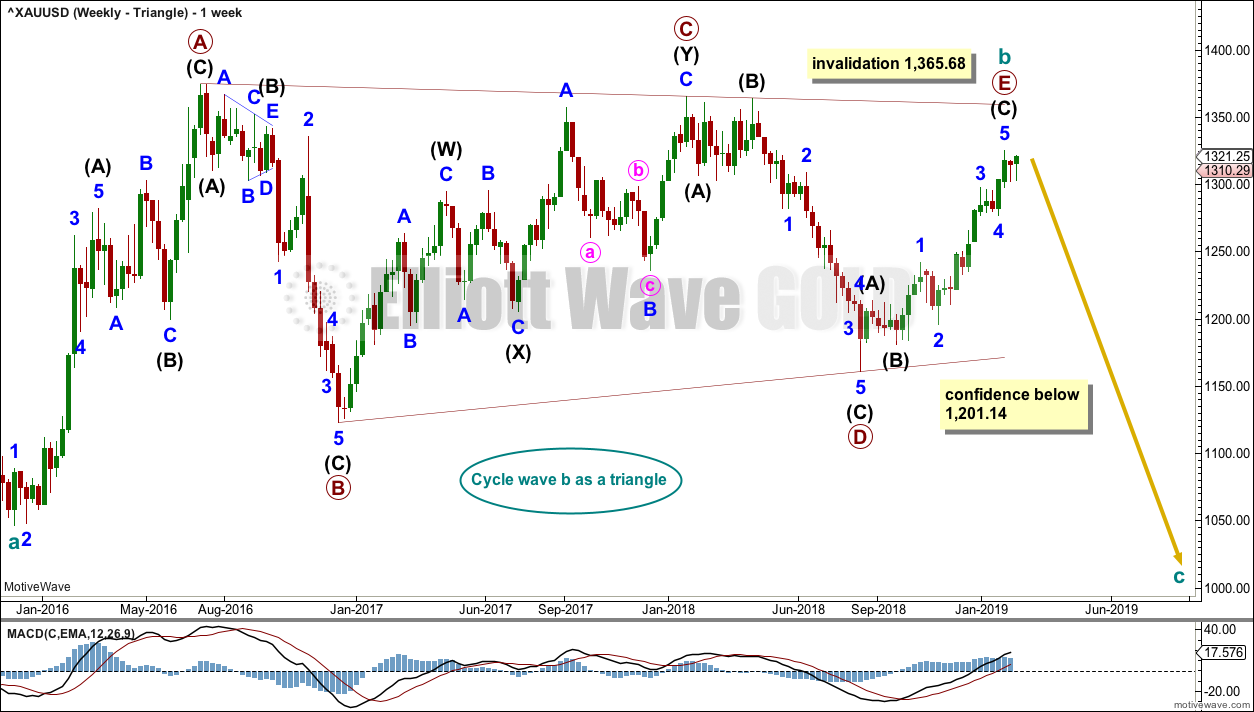
WEEKLY CHART – TRIANGLE
Click chart to enlarge.
Cycle wave b may be a complete regular contracting triangle. If it continues further, then primary wave E may not move beyond the end of primary wave C above 1,365.68.
Within primary wave E, intermediate waves (A) and (B) may be complete. Intermediate wave (C) must subdivide as a five wave structure.
Four of the five sub-waves of a triangle must be zigzags, with only one sub-wave allowed to be a multiple zigzag. Wave C is the most common sub-wave to subdivide as a multiple, and this is how primary wave C for this example fits best. Primary wave E looks like it is unfolding as a single zigzag.
There are no problems in terms of subdivisions or rare structures for this wave count. It has an excellent fit and so far a typical look.
This wave count would now expect a cycle degree trend change. Cycle wave c would most likely make new lows below the end of cycle wave a at 1,046.27 to avoid a truncation.
It is possible now that primary wave E could have been over the last high. Some reasonable weakness should be expected at its end. Triangles often end with declining ATR, weak momentum and weak volume.
If this weekly wave count is correct, then cycle wave c downwards should develop strength, ATR should show some increase, and MACD should exhibit an increase in downwards momentum.
DAILY CHART – TRIANGLE
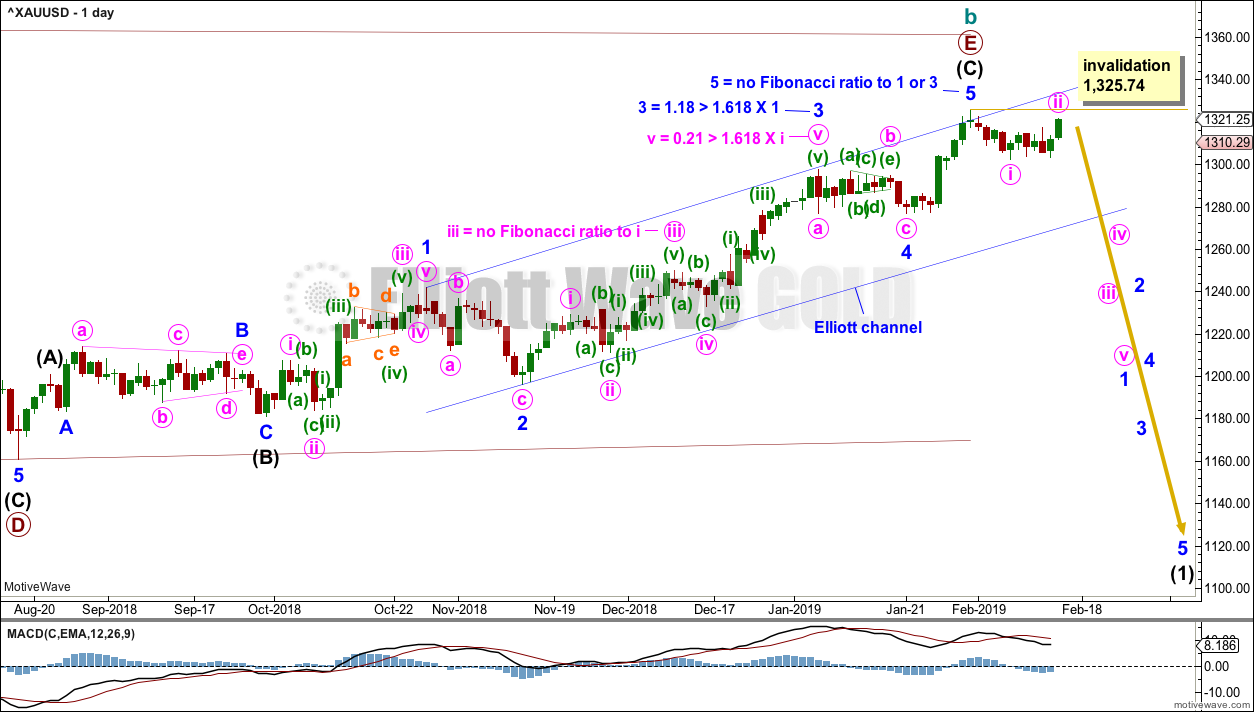
Click chart to enlarge.
Primary wave E should subdivide as a zigzag. Intermediate waves (A) and (B) may now be complete. Intermediate wave (C) may be complete, but as yet there is no confidence in a high.
It is now possible to see minor wave 5 complete at the daily level. However, it is always safest to assume the trend remains the same until proven otherwise. For reasonable confidence in a trend change the remaining two things need to be seen:
1. A new low below support at 1,300.
2. A breach of the blue channel.
If this wave count is invalidated, then the alternate below may be used.
DAILY CHART – TRIANGLE – ALTERNATE
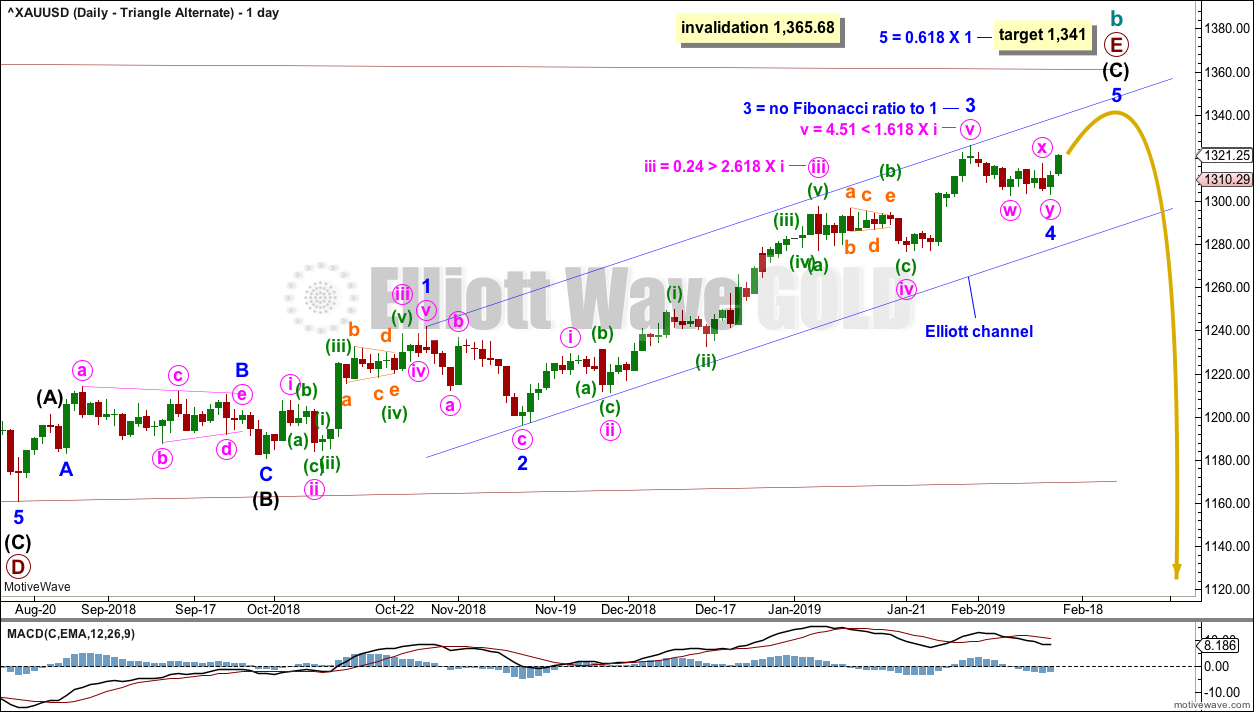
Click chart to enlarge.
It is also possible that intermediate wave (C) is incomplete and requires a final high; the last high may have been minor wave 3 and not minor wave 5.
Fibonacci ratios within intermediate wave (C) are given for minor degree waves, and Fibonacci ratios within minor wave 3 are given. Although there is very little difference, the main wave count has slightly better ratios than this alternate.
The Elliott channel is drawn here about intermediate wave (C). Minor wave 5 may find resistance about the upper edge.
A target is calculated for minor wave 5 that would see primary wave E end prior to the invalidation point.
WEEKLY CHART – DOUBLE ZIGZAG
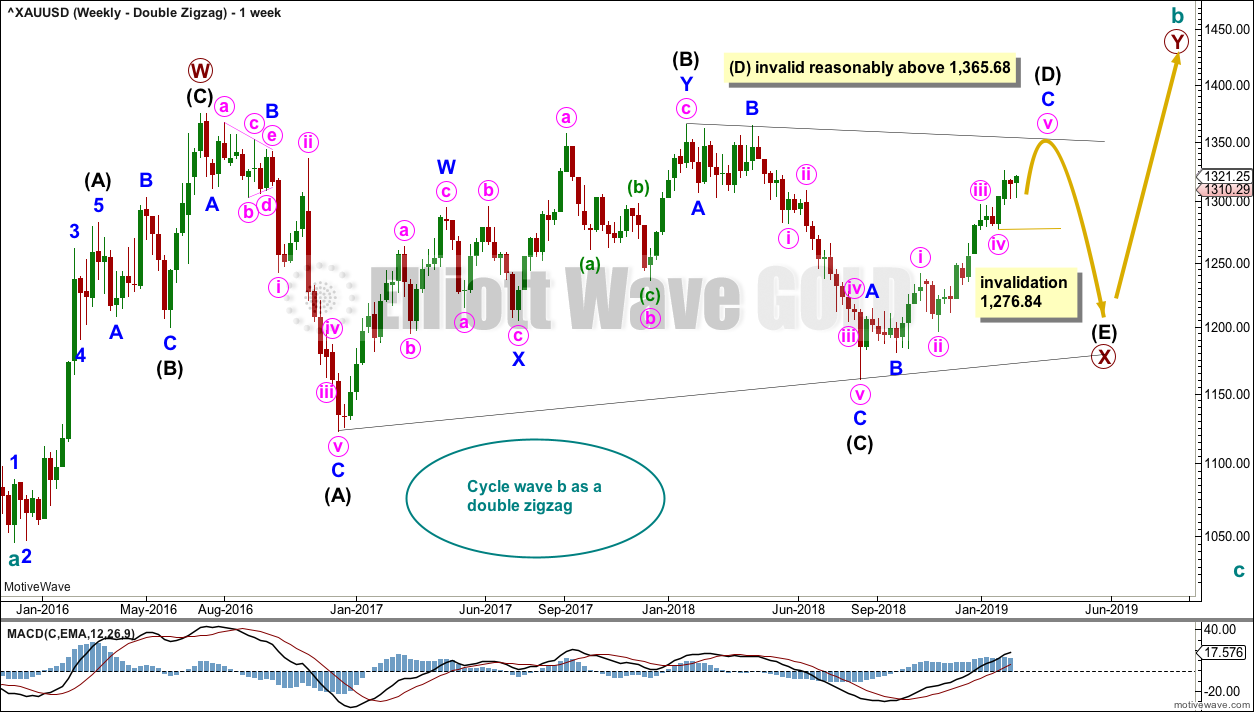
Click chart to enlarge.
It is possible that cycle wave b may be a double zigzag or a double combination.
The first zigzag in the double is labelled primary wave W. This has a good fit.
The double may be joined by a corrective structure in the opposite direction, a triangle labelled primary wave X. The triangle would be about three quarters complete.
Within the triangle of primary wave X, intermediate wave (C) should be complete. Within intermediate wave (D), minor waves A and B may be complete. Minor wave C must subdivide as a five wave structure. Within minor wave C, minute wave iv should now be over. Within minute wave v, no second wave correction may move beyond its start below 1,276.84.
Intermediate wave (D) would most likely subdivide as a single zigzag. Intermediate wave (D) should end at the upper (B)-(D) trend line for this wave count, so that the triangle adheres neatly to this trend line. That price point is about 1,352. This wave count now requires upwards movement to continue. It would not be acceptable for the upper (B)-(D) trend line to have breaches or substantial overshoots. Elliott wave triangles almost always adhere very neatly to their trend lines.
Intermediate wave E should continue to exhibit weakness: ATR should continue to show a steady decline, and MACD may begin to hover about zero.
This wave count may now expect choppy overlapping movement in an ever decreasing range for a few more months.
Primary wave Y would most likely be a zigzag because primary wave X would be shallow; double zigzags normally have relatively shallow X waves.
Primary wave Y may also be a flat correction if cycle wave b is a double combination, but combinations normally have deep X waves. This would be less likely.
This wave count has good proportions and no problems in terms of subdivisions.
WEEKLY CHART – ALTERNATE BULLISH
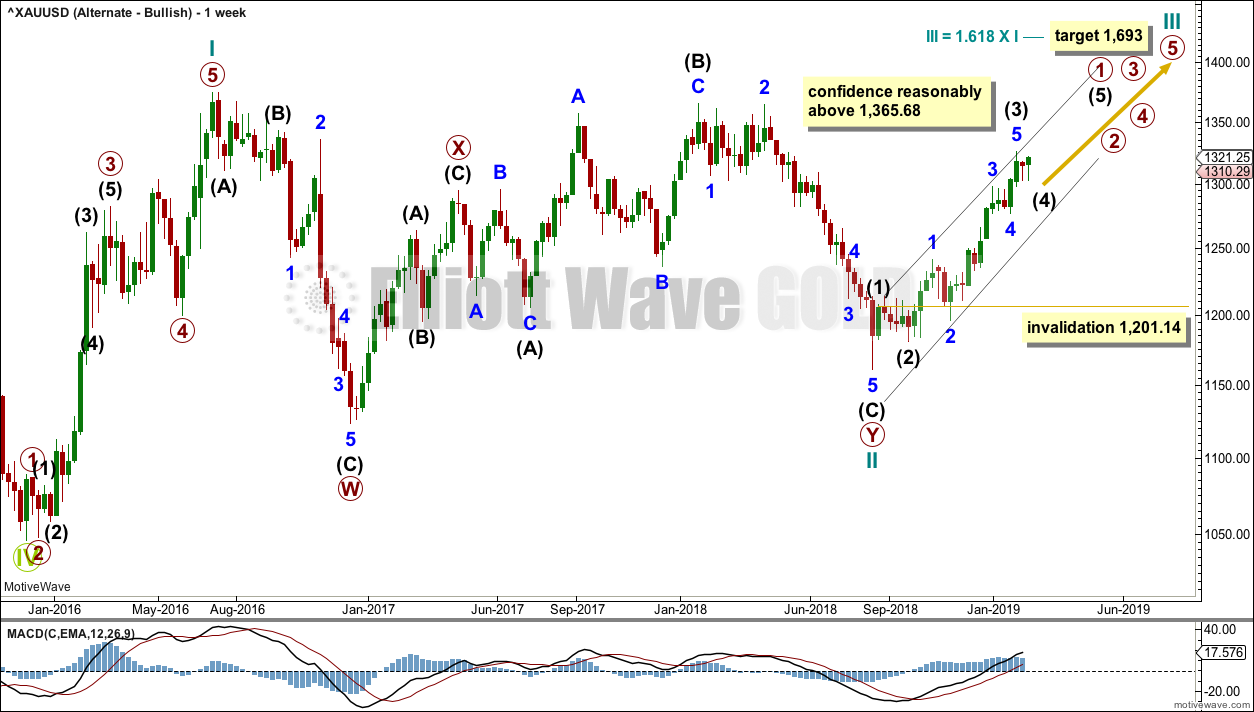
Click chart to enlarge.
Because the preferred wave count is at a critical juncture in expecting a cycle degree trend change, it is time to consider an alternate which expects the continuation of the current upwards trend.
It is possible that the low in December 2015 was the end of a bear market and that Gold has been in a basing action for the past three years. Downwards movement to that low will subdivide as a double zigzag, a corrective structure.
If Gold is in a new bull market, then it should begin with a five wave structure upwards on the weekly chart. However, the biggest problem with this wave count is the structure labelled cycle wave I because this wave count must see it as a five wave structure, but it looks more like a three wave structure.
Commodities often exhibit swift strong fifth waves that force the fourth wave corrections coming just prior to be more brief and shallow than their counterpart second waves. It is unusual for a commodity to exhibit a quick second wave and a more time consuming fourth wave, and this is how cycle wave I is labelled. The probability of this wave count is low due to this problem.
Cycle wave II subdivides well as a double combination: zigzag – X – expanded flat.
Cycle wave III may have begun. Within cycle wave III, primary wave 1 may be an incomplete impulse. Within primary wave 1, intermediate wave (4) may not move into intermediate wave (1) price territory below 1,201.14.
A black Elliott channel is drawn about primary wave 1. Intermediate wave (4) may find support about the lower edge.
Cycle wave III so far for this wave count would have been underway now for 25 weeks. It should be beginning to exhibit some support from volume, increase in upwards momentum and increasing ATR. However, volume continues to decline, ATR continues to decline and is very low, and momentum is weak in comparison to cycle wave I. This wave count lacks support from classic technical analysis.
TECHNICAL ANALYSIS
WEEKLY CHART
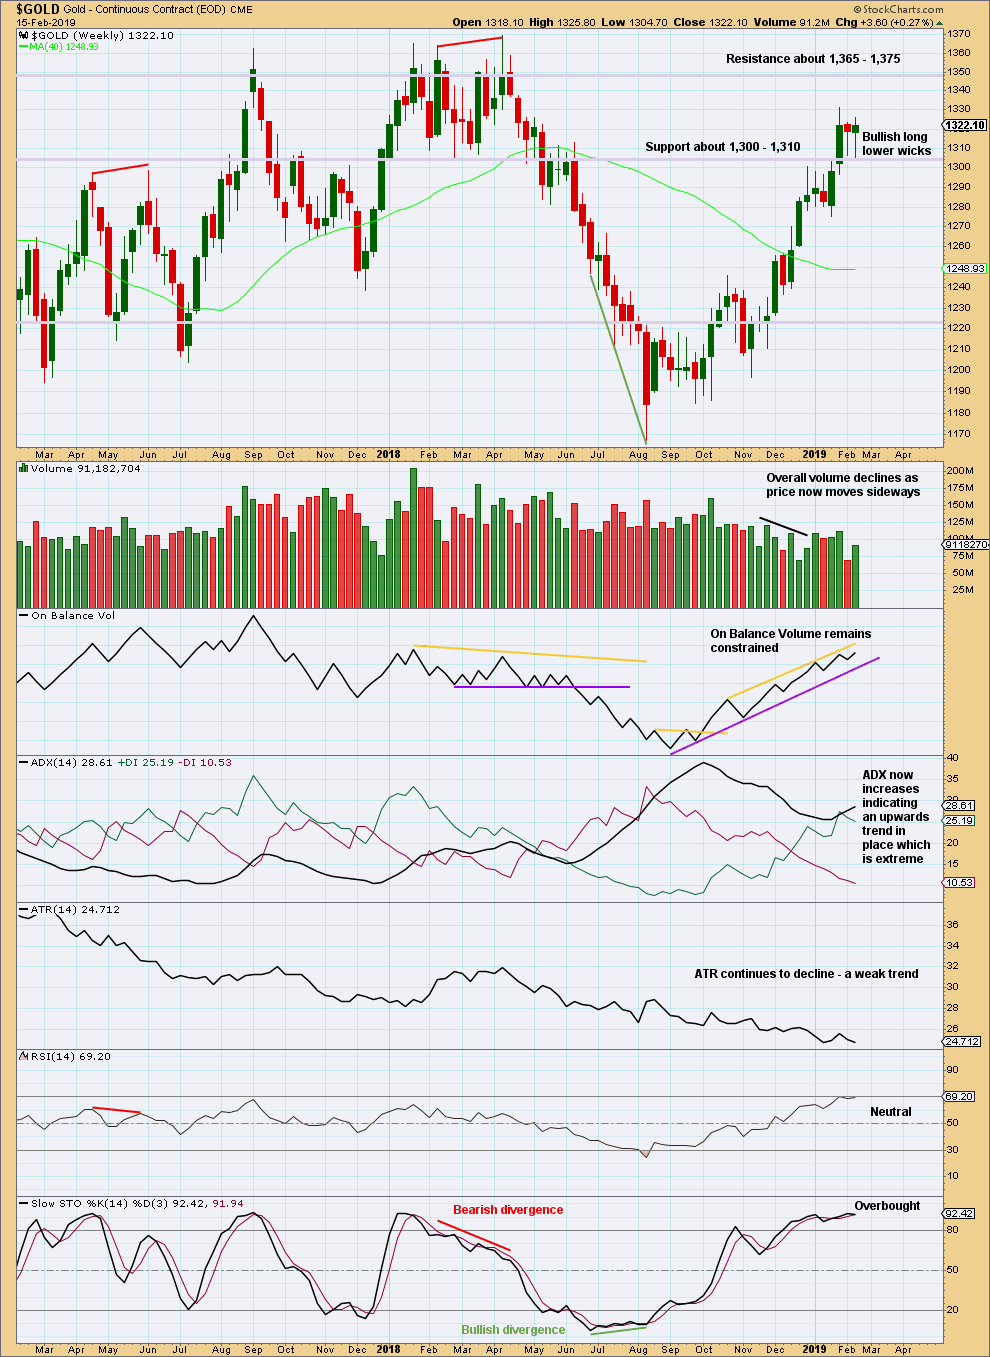
Click chart to enlarge. Chart courtesy of StockCharts.com.
Strong support about 1,300 continues. For the short term, the last two weeks look like a small consolidation within the ongoing upwards trend.
With the trend extreme at this time frame, upward movement may be limited.
DAILY CHART
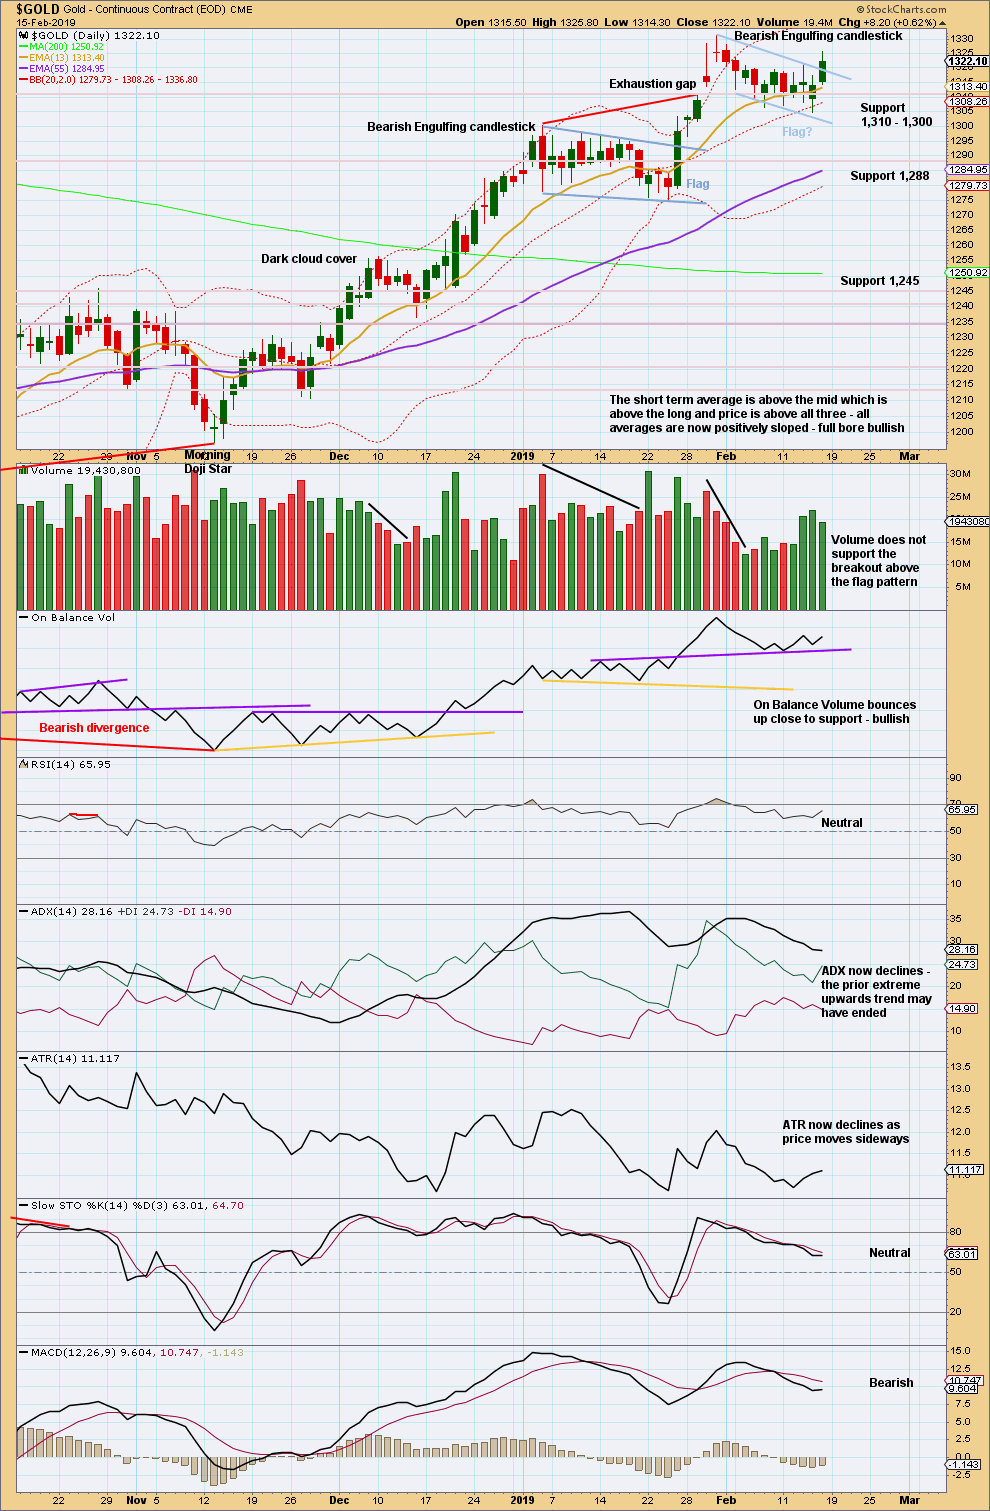
Click chart to enlarge. Chart courtesy of StockCharts.com.
Friday closed above the upper trend line of the flag without support from volume, so this upwards breakout is suspicious. Upwards breakouts require support from volume for confidence.
A target using the flag pole would be at 1,375.
GDX WEEKLY CHART
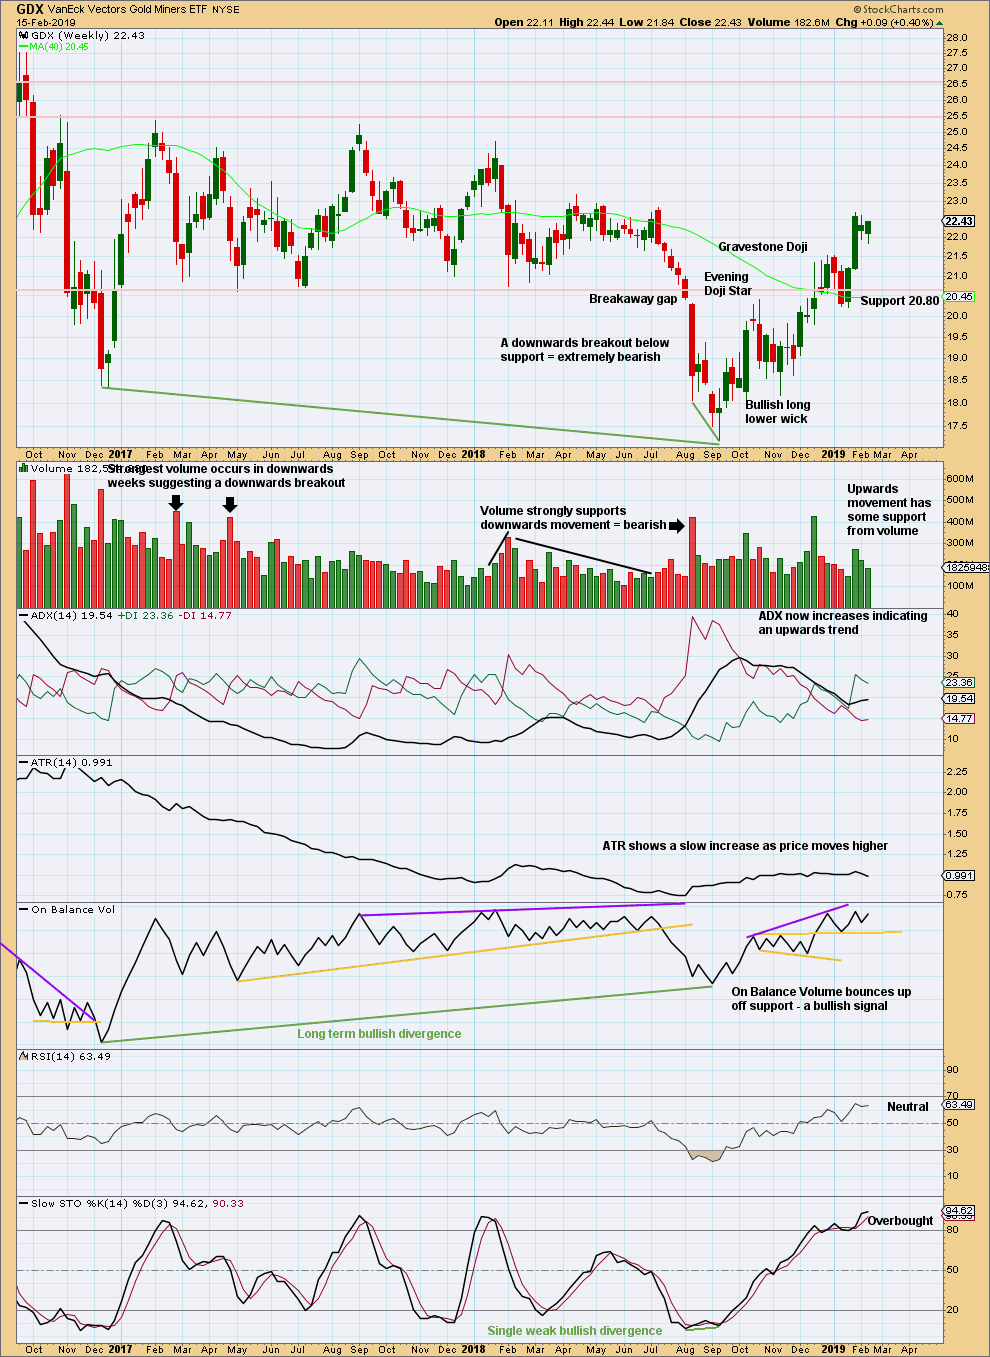
Click chart to enlarge. Chart courtesy of StockCharts.com.
A downwards week closes green and the balance of volume is upwards. Upwards movement within the last week lacks support from volume.
ADX indicates an upwards trend. RSI indicates there is room for price to continue higher. Next resistance is about 23.0, and there is strong resistance above about 25.5.
GDX DAILY CHART
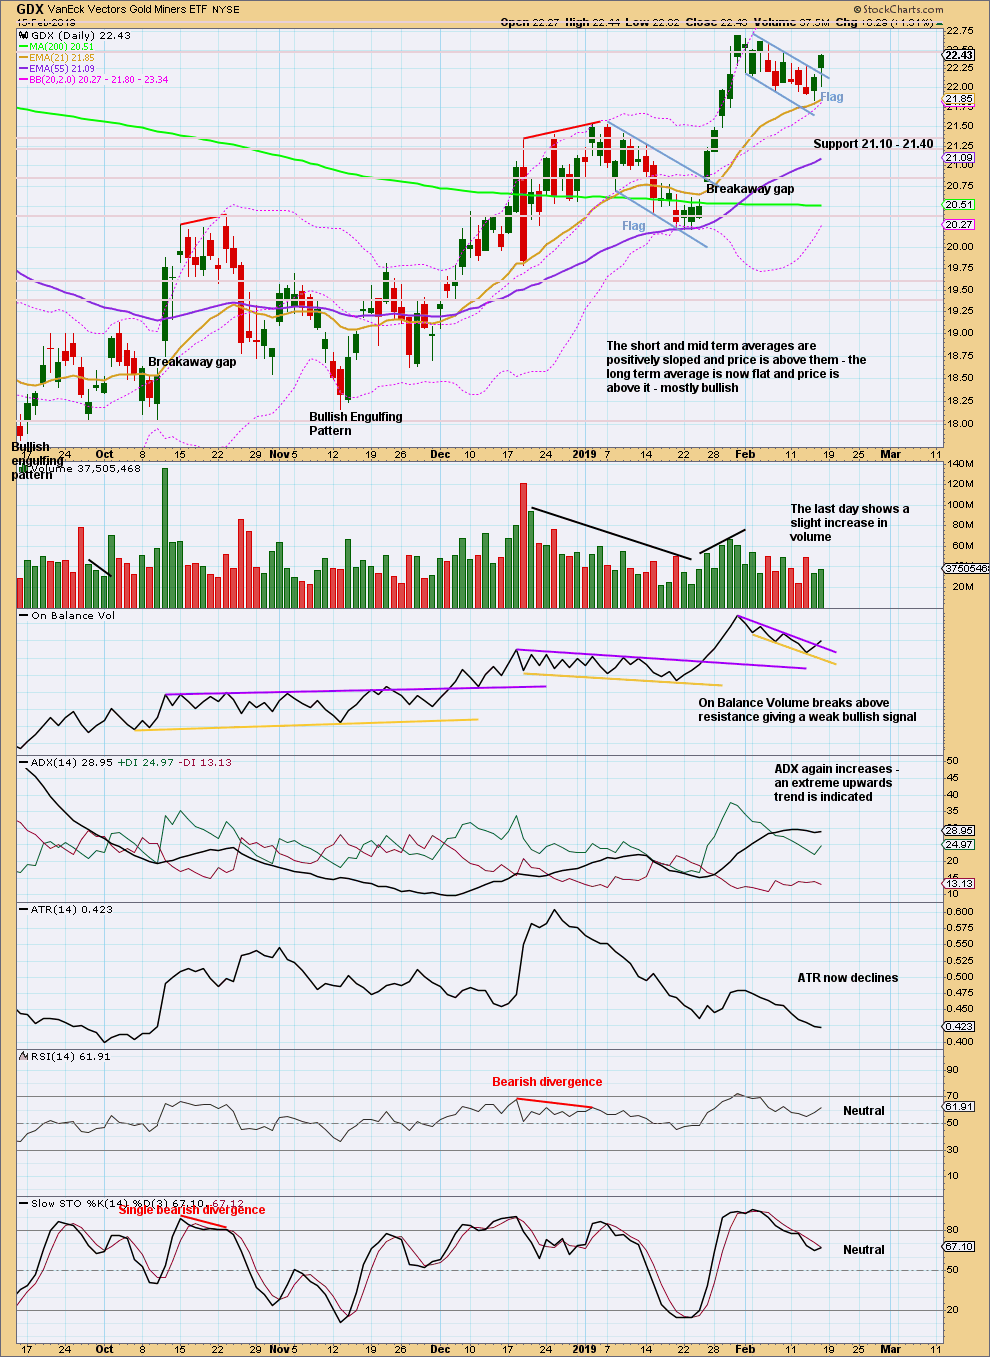
Click chart to enlarge. Chart courtesy of StockCharts.com.
For the short term, GDX is noticeably more bullish than Gold. The upwards breakout from its flag pattern has a little support from volume, and Friday’s candlestick has a bullish long lower wick and an almost shaven head.
The target from the last flag pattern is calculated at 24.65.
US OIL
The week was expected to begin with a little downwards movement to a target at 50.91 to 50.82. The week did begin with a little downwards movement, finding a low at 51.24, 0.33 short of the target zone.
An update for members intra-week, on the 13th of February, indicated a low was likely in place. Thereafter, price has moved higher to end the week.
Summary: The upwards bounce should continue to the final target zone about 63.19 to 63.71. This target may be met in another two to six weeks.
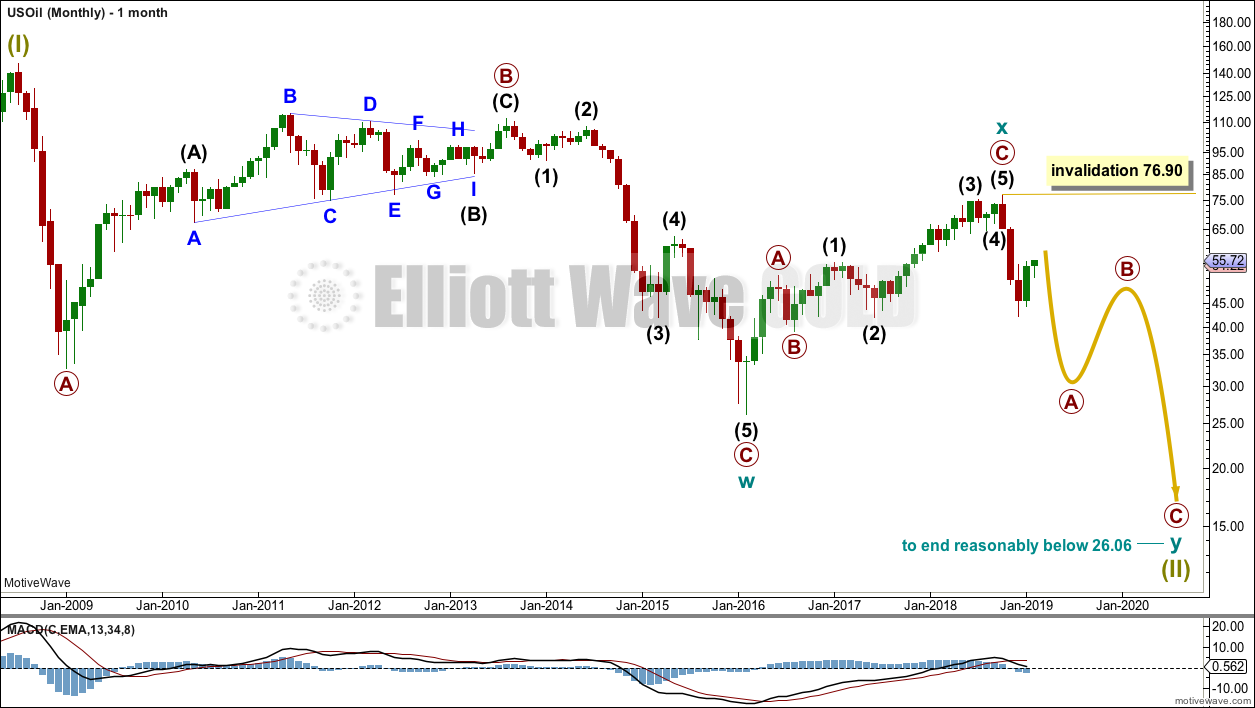
The larger picture still sees Oil in a new downwards trend to end reasonably below 26.06.
MAIN ELLIOTT WAVE COUNT
MONTHLY CHART
Click chart to enlarge.
Classic technical analysis favours a bearish wave count for Oil at this time.
The large fall in price from the high in June 2008 to February 2016 is seen as a complete three wave structure. This large zigzag may have been only the first zigzag in a deeper double zigzag.
The first zigzag down is labelled cycle wave w. The double is joined by a now complete three in the opposite direction, a zigzag labelled cycle wave x.
The purpose of a second zigzag in a double is to deepen the correction when the first zigzag does not move price deep enough. Cycle wave y would be expected to move reasonably below the end of cycle wave w to deepen the correction. Were cycle wave y to reach equality with cycle wave w that takes Oil into negative price territory, which is not possible. Cycle wave y would reach 0.618 the length of cycle wave w at $2.33.
A better target calculation would be using the Fibonacci ratios between primary waves A and C within cycle wave y. This cannot be done until both primary waves A and B are complete.
Within cycle wave y, no second wave correction nor B wave may move beyond its start above 76.90.
WEEKLY CHART

Click chart to enlarge.
This weekly chart is focussed on the start of cycle wave y.
Cycle wave y is expected to subdivide as a zigzag. A zigzag subdivides 5-3-5. Primary wave A must subdivide as a five wave structure if this wave count is correct.
Within primary wave A, intermediate wave (1) may now be complete. Intermediate wave (2) so far looks like it is unfolding as a zigzag, which is the most common Elliott wave structure for a second wave, and so far it has lasted seven weeks. If it completes in a total Fibonacci thirteen weeks, then it may continue now for a further six weeks. It may however not be as long lasting as that; it may not exhibit a Fibonacci duration.
Intermediate wave (2) may not move beyond the start of intermediate wave (1) above 76.90.
MAIN DAILY CHART
Click chart to enlarge.
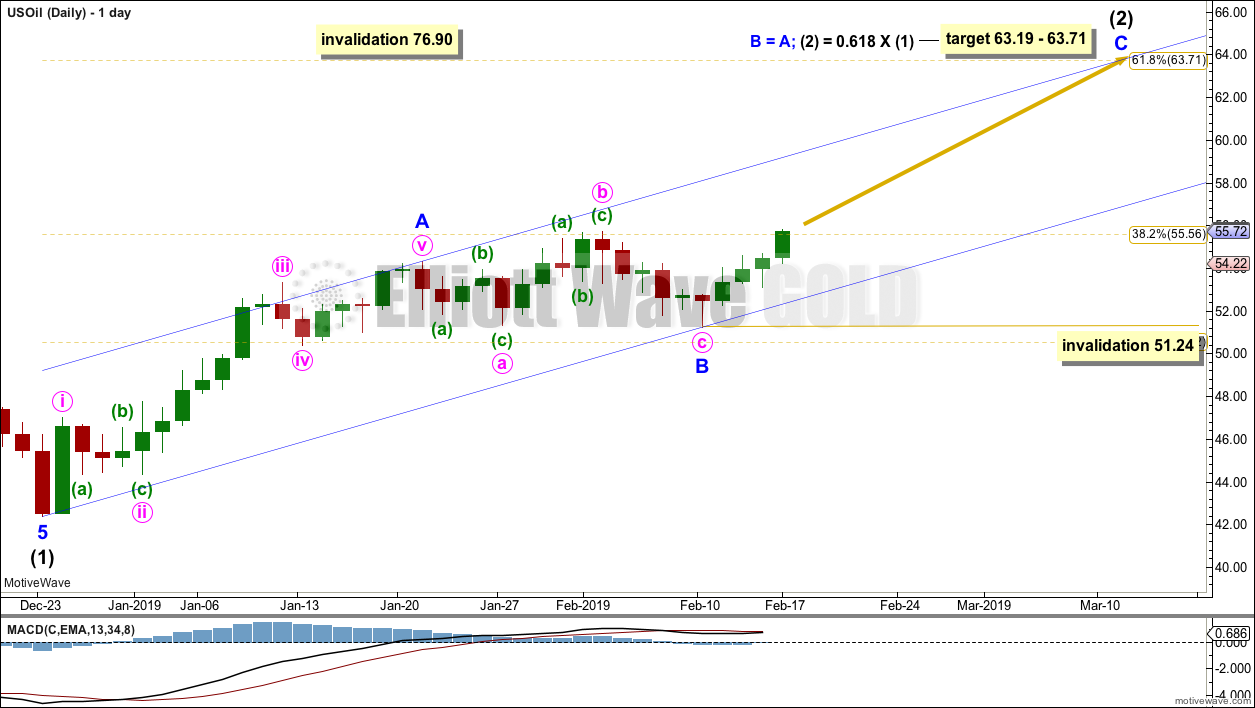
Intermediate wave (2) would most likely subdivide as a zigzag and at this stage that is how it will be labelled, and that is how it looks like it is subdividing. However, it may also subdivide as a flat or combination. It is impossible at this stage to be confident as to which structure it will unfold as. The labelling within it may yet change as it unfolds.
If intermediate wave (2) is unfolding as a zigzag, then within it minor waves A and B may now both be complete.
Another five wave structure upwards for minor wave C may be expected to unfold.
The target is now widened to a small zone calculated at two degrees.
The channel is drawn about intermediate wave (2) using Elliott’s technique for a correction. Any pullbacks along the way up within minor wave C may find support about the lower edge of this channel. Minor wave C may end either mid way within the channel or more likely about the upper edge.
Within minor wave C, no second wave correction may move beyond the start of its first wave below 51.24.
Intermediate wave (2) may be very deep.
Intermediate wave (2) may not move beyond the start of intermediate wave (1) above 76.90.
If price moves below the lower edge of the blue Elliott channel, then the alternate wave count below would be indicated.
ALTERNATE DAILY CHART
Click chart to enlarge.
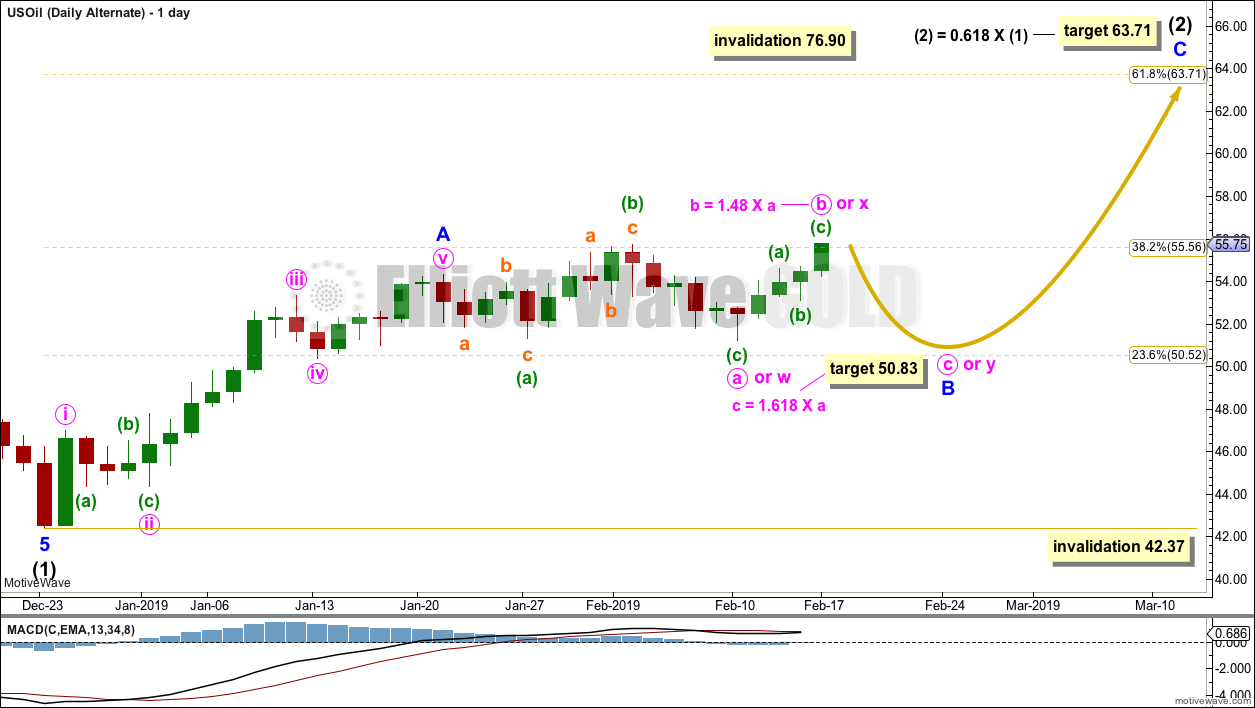
Upwards movement to a new high this week comes with reasonable weakness. This suggests that it may be a continuation of minor wave B; B waves should exhibit weakness.
The degree of labelling within minor wave B is moved one degree lower for this alternate wave count.
Minor wave B may be continuing sideways as a single flat, double flat or double combination.
If minor wave B is continuing as a single flat correction, then within it minute wave a may be a complete expanded flat correction. Minute wave b may be a complete zigzag and just beyond the most common length to minute wave a of 1 to 1.38, but within an allowable limit of up to 2 times the length of minute wave a. Minute wave c may end at the most common Fibonacci ratio to minute wave a of 1.618.
If minor wave B is continuing as a double flat correction, then within it the first flat may be complete, labelled minute wave w. The double may be joined by a complete three in the opposite direction, a zigzag labelled minute wave X. The second flat in the correction may now unfold, labelled minute wave y, that would likely end about the same level as minute wave w at 51.24.
If minor wave B is continuing as a double combination, then the second structure in the double may now unfold as a zigzag, labelled minute wave y, that would likely end about the same level as minute wave w at 51.24.
TECHNICAL ANALYSIS
MONTHLY CHART
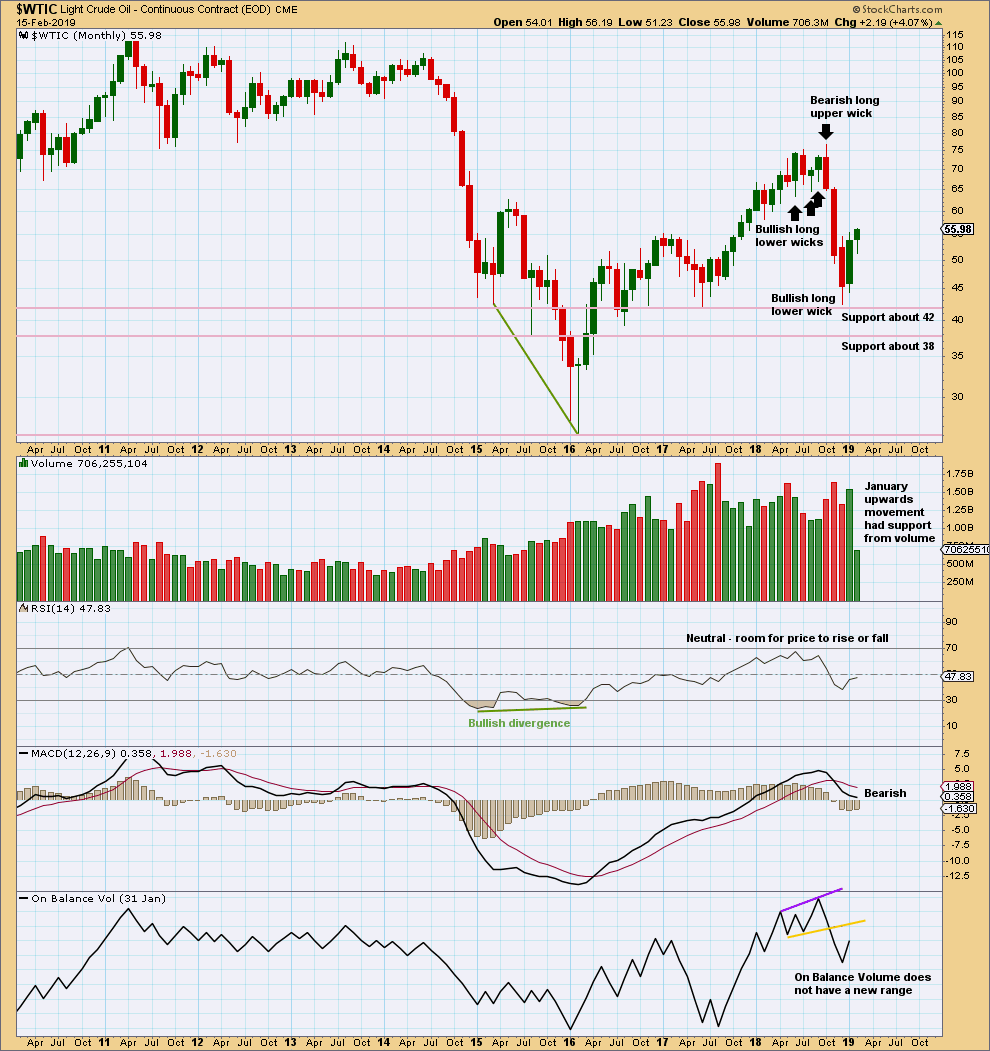
Click chart to enlarge. Chart courtesy of StockCharts.com.
Upwards movement within January has support from volume. This supports the Elliott wave count which expects overall more upwards movement in coming weeks.
WEEKLY CHART
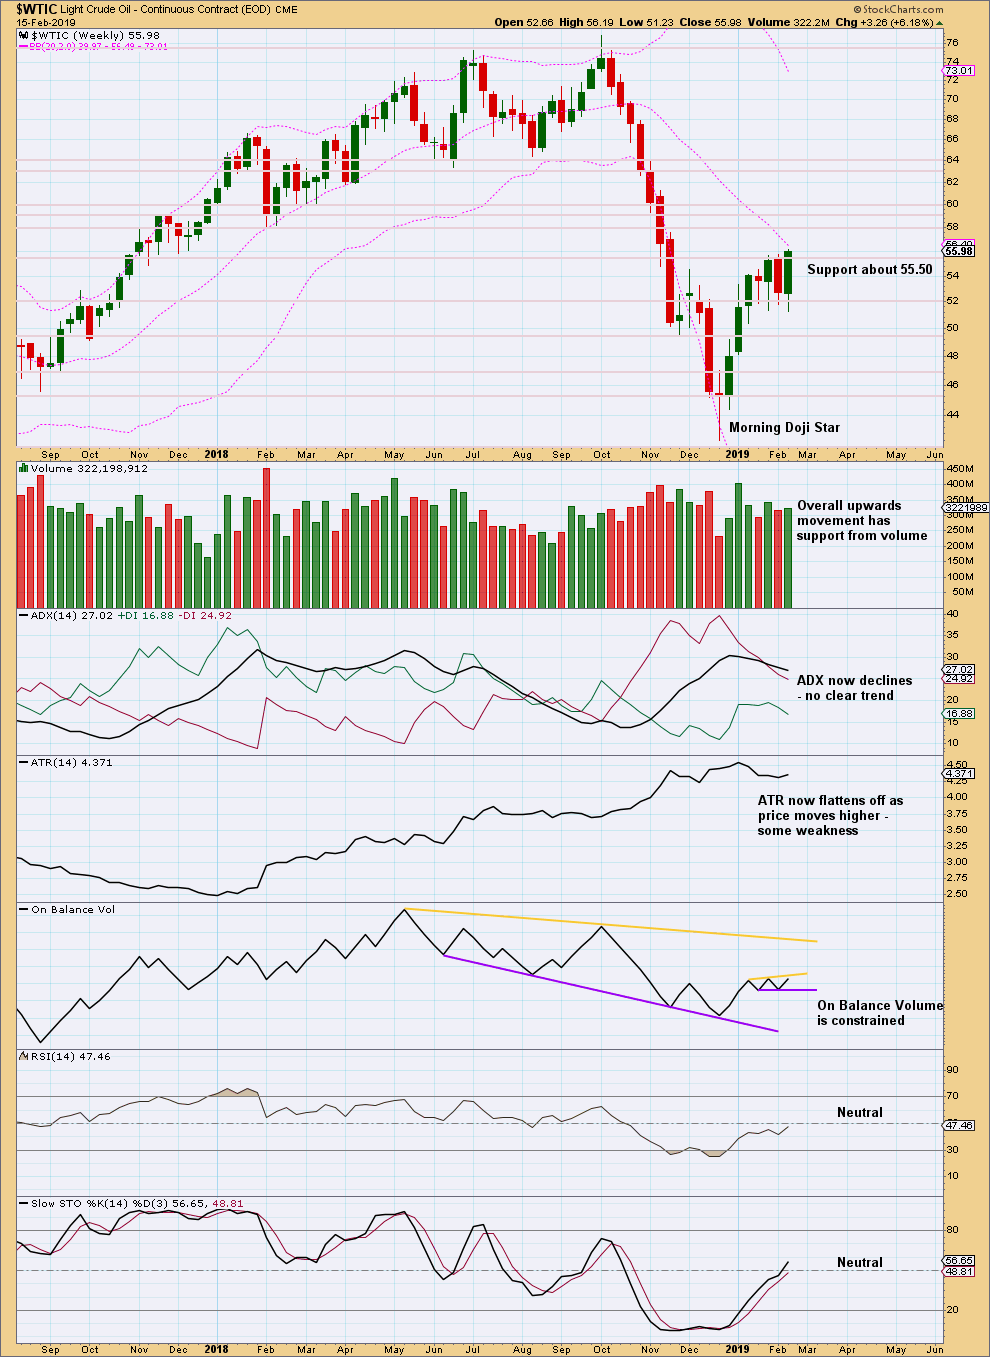
Click chart to enlarge. Chart courtesy of StockCharts.com.
An outside week closed green and the balance of volume was upwards. Upwards movement within the week looks to have support from volume, but for a clearer picture we should look inside the week at daily volume bars.
A new smaller range is drawn about On Balance Volume. A breakout would provide a weak signal.
DAILY CHART
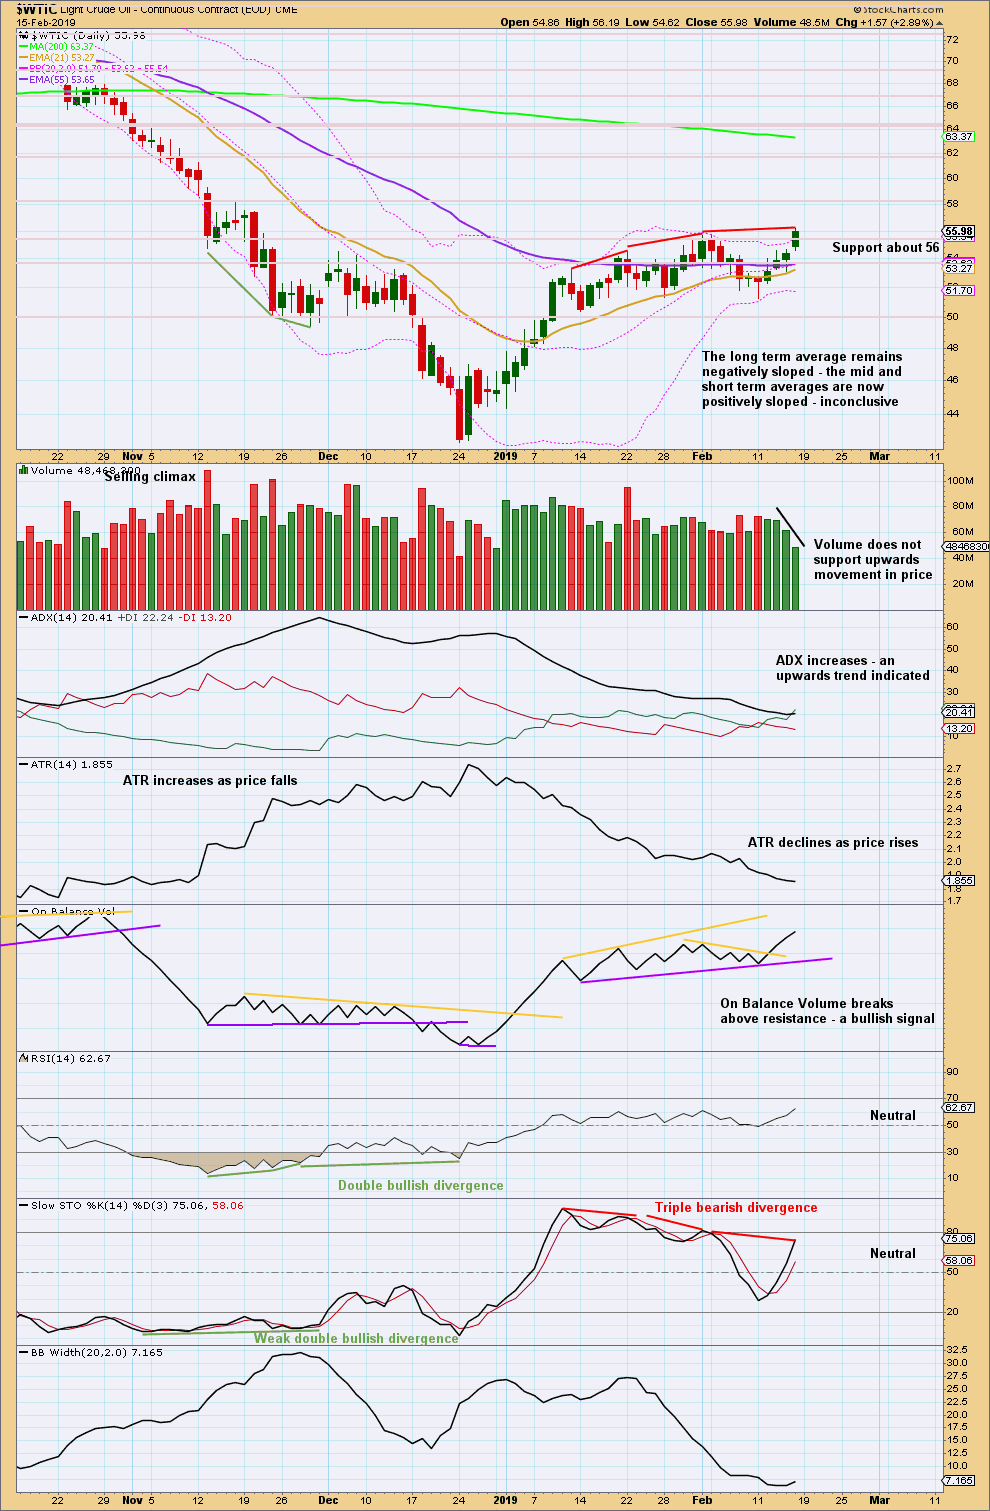
Click chart to enlarge. Chart courtesy of StockCharts.com.
Price has broken above resistance to a new high, but it comes with weakness. Volume does not support it and RSI now exhibits triple bearish divergence. This supports the alternate daily Elliott wave count.
This outlook could change though if another upwards day shows reasonable strength.
—
Always practice good risk management as the most important aspect of trading. Always trade with stops and invest only 1-5% of equity on any one trade. Failure to manage risk is the most common mistake new traders make.
Hi Laura, You mentioned BitCoin in one of your comments and it has crashed. Any thoughts on what price level it will find a bottom. Another EW analyst that I follow on Twitter thinks it may have found a Bear market low. Your thoughts?
I’ll take a look at Bitcoin next week.
My last analysis of Bitcoin is here. My target is 1,924, but I think it may be a lot lower than that. It may be below 100.
Hey Olga. I was wondering if Olga Lyalkina was you. Nice to hear from you. Are you still playing in a band? If so, any YouTube postings?
I second the YouTube question. If you put stuff up there, we’d love to see it!
S&P500:
I’ll add these charts to the end of week analysis for Lara’s Weekly members, but for now I just wanted to put this here for you all.
This first chart is an update of my main wave count for the S&P500 on the monthly chart. This chart begins at the start of this bull market in March 2009. It’s labelled as an impulse, note very importantly that cycle wave III is shorter than cycle wave I. This limits cycle wave V to no longer than equality in length with cycle wave III, so that cycle wave III is not the shortest actionary wave and the core Elliott wave rule is met.
This is a new alternate idea on the monthly chart. This is what I’ll say about it here, and in end of week analysis for you:
“It is time to consider a more bullish wave count because the AD line is making new all time highs and the end of this bull market now would be extremely likely to be a bare minimum of 4 months away, and likely longer.
If the degree of labelling is moved down within cycle wave III, then it is possible that the last high was only primary wave 1. Cycle wave III may be extending.
Only two actionary waves within an impulse may extend. Cycle wave I was extended. If cycle wave III also extends, then cycle wave V may not extend.
A target is calculated for primary wave 3 to end. If price gets up to this target and the structure is incomplete, or if price keeps rising through the target, then a new higher target would then be calculated.
Within primary wave 3, no second wave correction may move beyond the start of its first wave below 2,346.58.
This wave count expects MACD to indicate stronger momentum as price makes a new all time high. If that happens, then this may be switched to be the main wave count.”
My target for primary wave 3 is rather conservative. A target for it to be 1.618 X primary wave 1 would be at 4,176.23. But if I publish that and make it public (not for members only) I am sure to receive…. derision?
But it is what it is. Maths.
I’ll wait to see how high price gets towards 3,477 and what momentum and the AD line are doing. If there is strength and momentum then a higher target may be made public.
Thanks for this….
When you are in a bubble, anything can happen… Yes, I think 4,176.23 is conservative.
Cheers,
Mathieu
You have based your analysis on solid theory, math and facts. Your analysis is not tainted by extraneous events and news items, but purely driven by market sentiment as expressed in market moves. AD line supports you.
Gold and S&P500 are acting exactly as you expected them to. I do not follow oil, so I do not know.
Please do publish. I would like to gloat as being your subscriber when everybody finally acknowledges that you were correct all along while most others failed.
Gloating isn’t my thing. In fact, self promotion isn’t something I’m good at.
But… if I did want to do anything of the sort I’d start with my Bitcoin analysis. I nailed the high and the subsequent crash.
If anyone out there had followed it and cashed out, they may have made an enormous amount of money, which is now lost. I know of two people who held on and have lost millions. I could have saved that for them.
I’m slightly surprised that my analysis of Bitcoin has received zero response. I assume people think it was just luck. Nope. That was some serious hard work.
Hi Lara,
Based on the price movement late yesterday, do you have an updated target within the blue channel?
You have to state which market you’re referring to. Both the S&P500 and Gold have blue channels on their daily charts.
If you’re referring to Gold, then I’m now using the classic analysis target based upon the last flag pattern and its flag pole. That’s 1,375. For Gold, right now, the Elliott wave count and classic analysis diverge. While the Elliott wave count is at this critical juncture in expecting a trend change I would rather assume the upwards trend remain intact, until we have evidence it’s over. Today there is zero evidence it’s over, so assume price will keep moving higher to 1,375.
A warning: the target may be too high. Conditions are now overbought. Be flexible and ready to switch from bullish to bearish on Gold, but only if evidence tells us to do so.
Apologies jkmistry, only Gold has a blue channel on the daily chart.
The S&P has one on the hourly chart, I’m getting my time frames mixed up.
No worries, thanks for the update. I usually include which chart I’m referring to but wrote the message in a rush.
Gold:
Daily chart updated:
For the preferred triangle wave count (weekly) this is now the only daily chart left.
Hi Lara,
Great work as always…
On your long term forecast of the S&P 500, we are sitting near 2800 and the AD line is extremely strong and doing a new high…. It looks like the target of 3045 is way too low and 3477 might be surpassed… To go up less than 300 points from now to March 2020 seems unreasonable…
I know that the Elliott wave channel for Super Cycle 5 fits really well currently but isn’t the AD line concerning you?
My opinion is that if we are going to end this 90 year rally, there is good probability that we could end this in a spectacular fashion with a huge blow off top like the Japanese Nikkei in 1990… This is all coming because of the strong AD line.
Thanks Lara as always
Mathieu
I agree, I’ve been quietly wondering about that too.
My first idea for an explanation would be to move the degree of labelling from the low of cycle wave II down one degree. That would make the last high primary wave 1 within cycle wave III, and now this current upwards movement would be primary wave 3 within cycle wave III. That would make this next high to come the strongest portion within this bull market.
That seems… unlikely. But it is possible. That would see the bull market continue for another 2-3 years or maybe longer. Again, doesn’t seem very likely, but is possible.
I don’t know if I want to publish that, it would be exceptionally bullish. Very bullish indeed. It would however have some support from classic TA, in that the current rise does have good internal strength.
Oh I see what you mean…. Yes, if this is possible, it would make Super Cycle Wave 5 much longer and longer than my wildest dreams…. This would be 1999 all over again which I am kind of predicting since nothing else is working as well in the world today…
And this very strong market breath is fooling most experts currently… There is a lot of FOMO currently.
Cheers,
Mathieu
Lara, for Gold, the Daily Triangle chart and Daily Triangle Alternate look the same to me. Am I missing something?
Hey Rodney – hope you are well buddy.
The Gold Daily Triangle Alternate thumbnail is showing incorrectly on my PC. If you click the alternate to enlarge it, the enlarged chart is correct.
Sorry everybody, that was a small code error. Fixed now.