

S&P 500
More upwards movement has unfolded as expected. The Elliott wave and classic analysis targets remain the same.
Summary: The target for more upwards movement is at 2,804 (Elliott wave) or 2,881 (classic analysis).
At about one of these targets a large pullback for a second wave at primary degree may begin.
For the short term, a breach of the black Elliott channel and then a new low below 2,631.05 would indicate a bigger pullback has arrived.
The bigger picture still expects that a low may now be in place. The target is at 3,045 with a limit at 3,477.39.
The biggest picture, Grand Super Cycle analysis, is here.
The monthly chart was last published here.
ELLIOTT WAVE COUNT
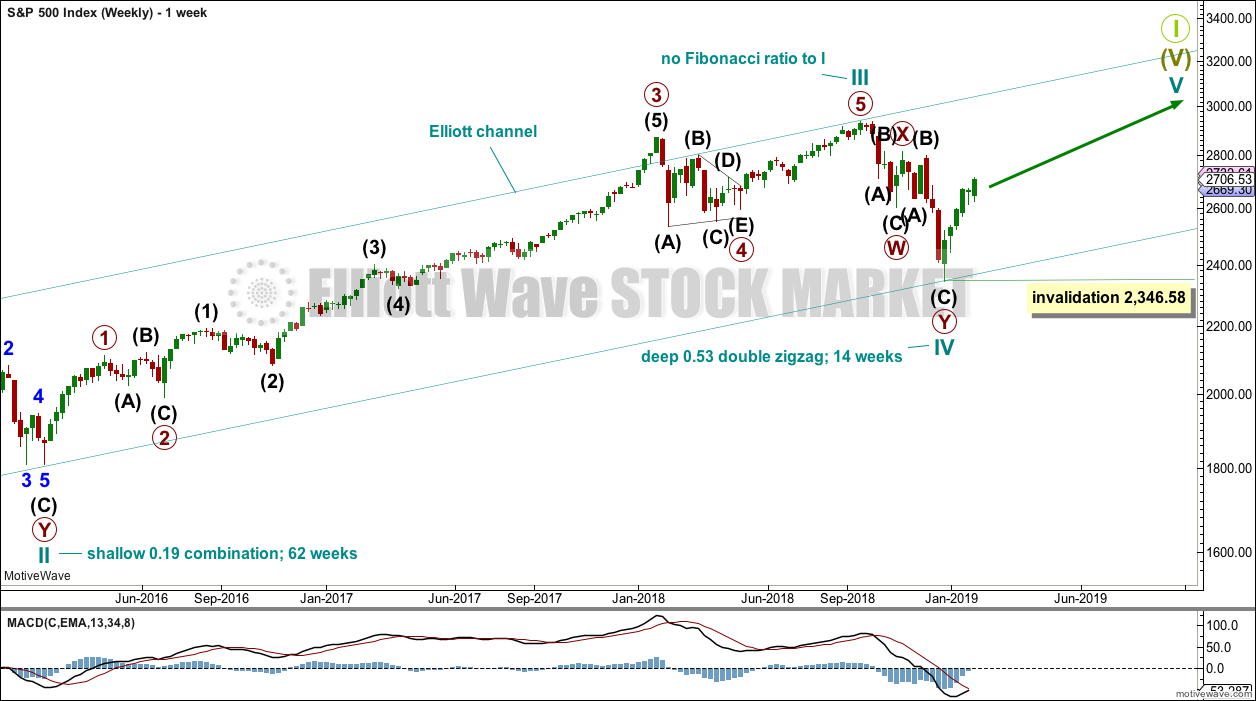
WEEKLY CHART
Click chart to enlarge.
This weekly chart shows all of cycle waves III, IV and V so far.
Cycle wave II fits as a time consuming double combination: flat – X – zigzag. Combinations tend to be more time consuming corrective structures than zigzags. Cycle wave IV has completed as a multiple zigzag that should be expected to be more brief than cycle wave II.
Cycle wave IV may have ended at the lower edge of the Elliott channel.
Within cycle wave V, no second wave correction may move beyond the start of its first wave below 2,346.58.
Although both cycle waves II and IV are labelled W-X-Y, they are different corrective structures. There are two broad groups of Elliott wave corrective structures: the zigzag family, which are sharp corrections, and all the rest, which are sideways corrections. Multiple zigzags belong to the zigzag family and combinations belong to the sideways family. There is perfect alternation between the possible double zigzag of cycle wave IV and the combination of cycle wave II.
Although there is gross disproportion between the duration of cycle waves II and IV, the size of cycle wave IV in terms of price makes these two corrections look like they should be labelled at the same degree. Proportion is a function of either or both of price and time.
Draw the Elliott channel about Super Cycle wave (V) with the first trend line from the end of cycle wave I (at 2,079.46 on the week beginning 30th November 2014) to the high of cycle wave III, then place a parallel copy on the low of cycle wave II. Cycle wave V may find resistance about the upper edge.
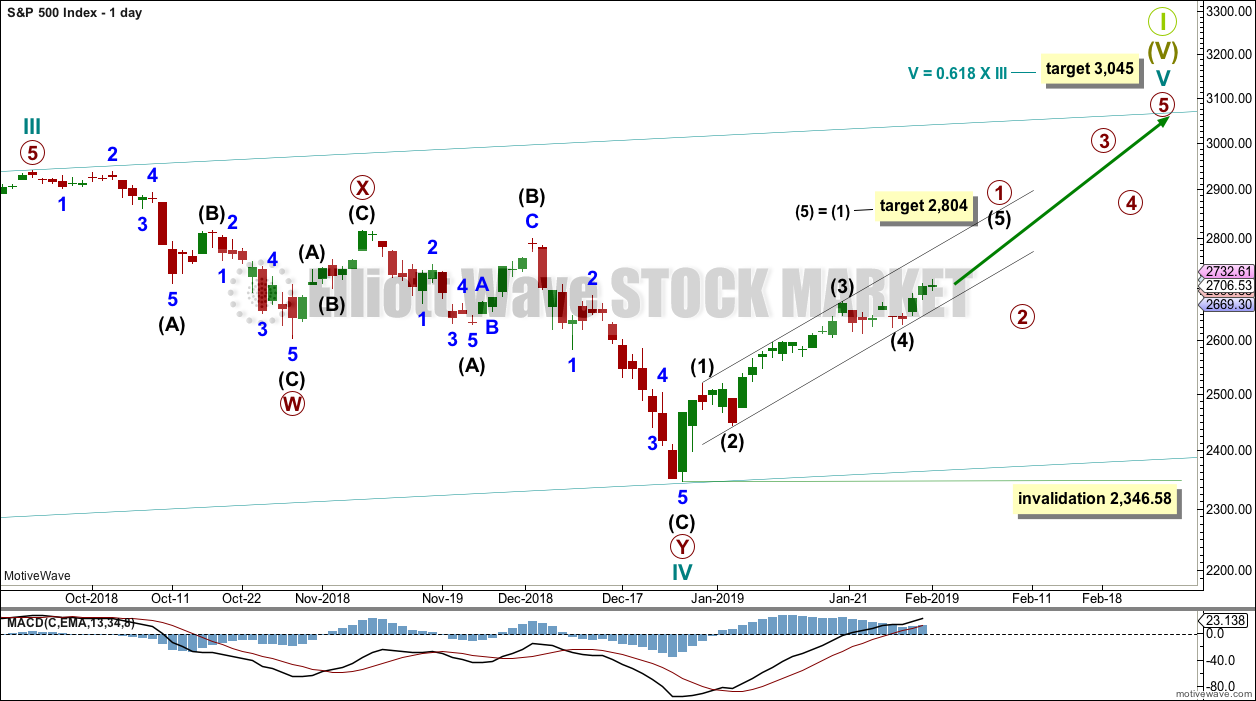
DAILY CHART
Click chart to enlarge.
The daily chart will focus on the structure of cycle waves IV and V.
Cycle wave IV now looks like a complete double zigzag. This provides perfect alternation with the combination of cycle wave II. Double zigzags are fairly common corrective structures.
Within Super Cycle wave (V), cycle wave III may not be the shortest actionary wave. Because cycle wave III is shorter than cycle wave I, this limits cycle wave V to no longer than equality in length with cycle wave III at 3,477.39. A target is calculated for cycle wave V to end prior to this point.
Cycle wave V must subdivide as a five wave motive structure, either an impulse or an ending diagonal. An impulse is much more common and that will be how it is labelled. A diagonal would be considered if overlapping suggests it.
Within the five wave structure for cycle wave V, primary wave 1 may be incomplete. A target is calculated for intermediate wave (5) to reach the most common Fibonacci ratio to intermediate wave (1).
Within cycle wave V, primary wave 2 may not move beyond the start of primary wave 1 below 2,346.58.
Intermediate wave (5) begins at 2,631.05. While price remains within the black Elliott channel and above 2,631.05, assume the trend remains the same. If price breaks below the lower edge of the channel and then makes a new low below the start of intermediate wave (5), then that would indicate primary wave 1 should be over and primary wave 2 should have begun.
TECHNICAL ANALYSIS
WEEKLY CHART
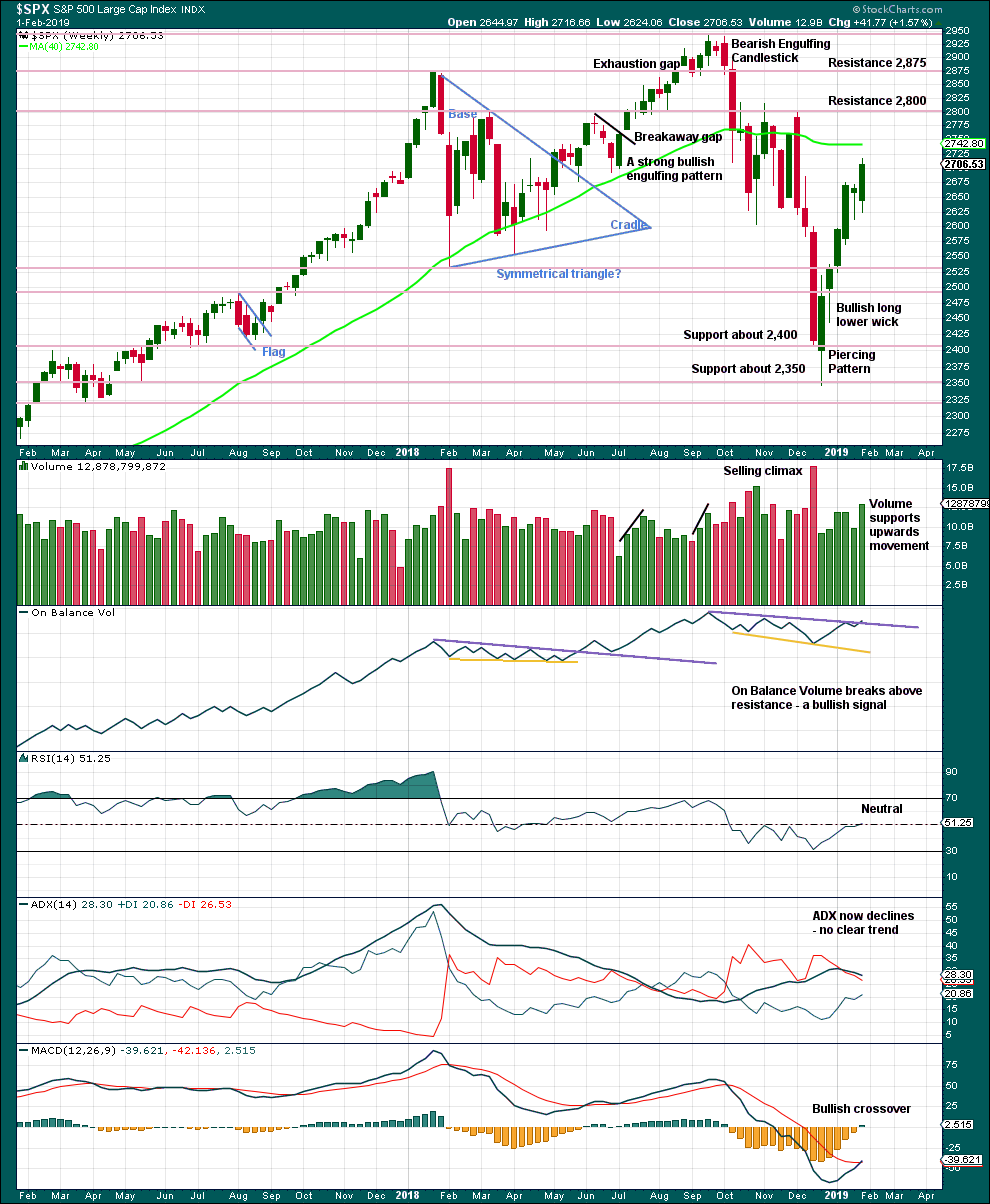
Click chart to enlarge. Chart courtesy of StockCharts.com.
From the all time high to the low at the end of December 2018, price moved lower by 20.2% of market value meeting the definition for a bear market.
It should be noted that the large fall in price from May 2011 to October 2011 also met this definition of a bear market, yet it was only a very large pullback within a bull market, which so far has lasted almost 10 years.
Overall, volume supports upwards movement this week. There is plenty of room for price to rise further.
DAILY CHART
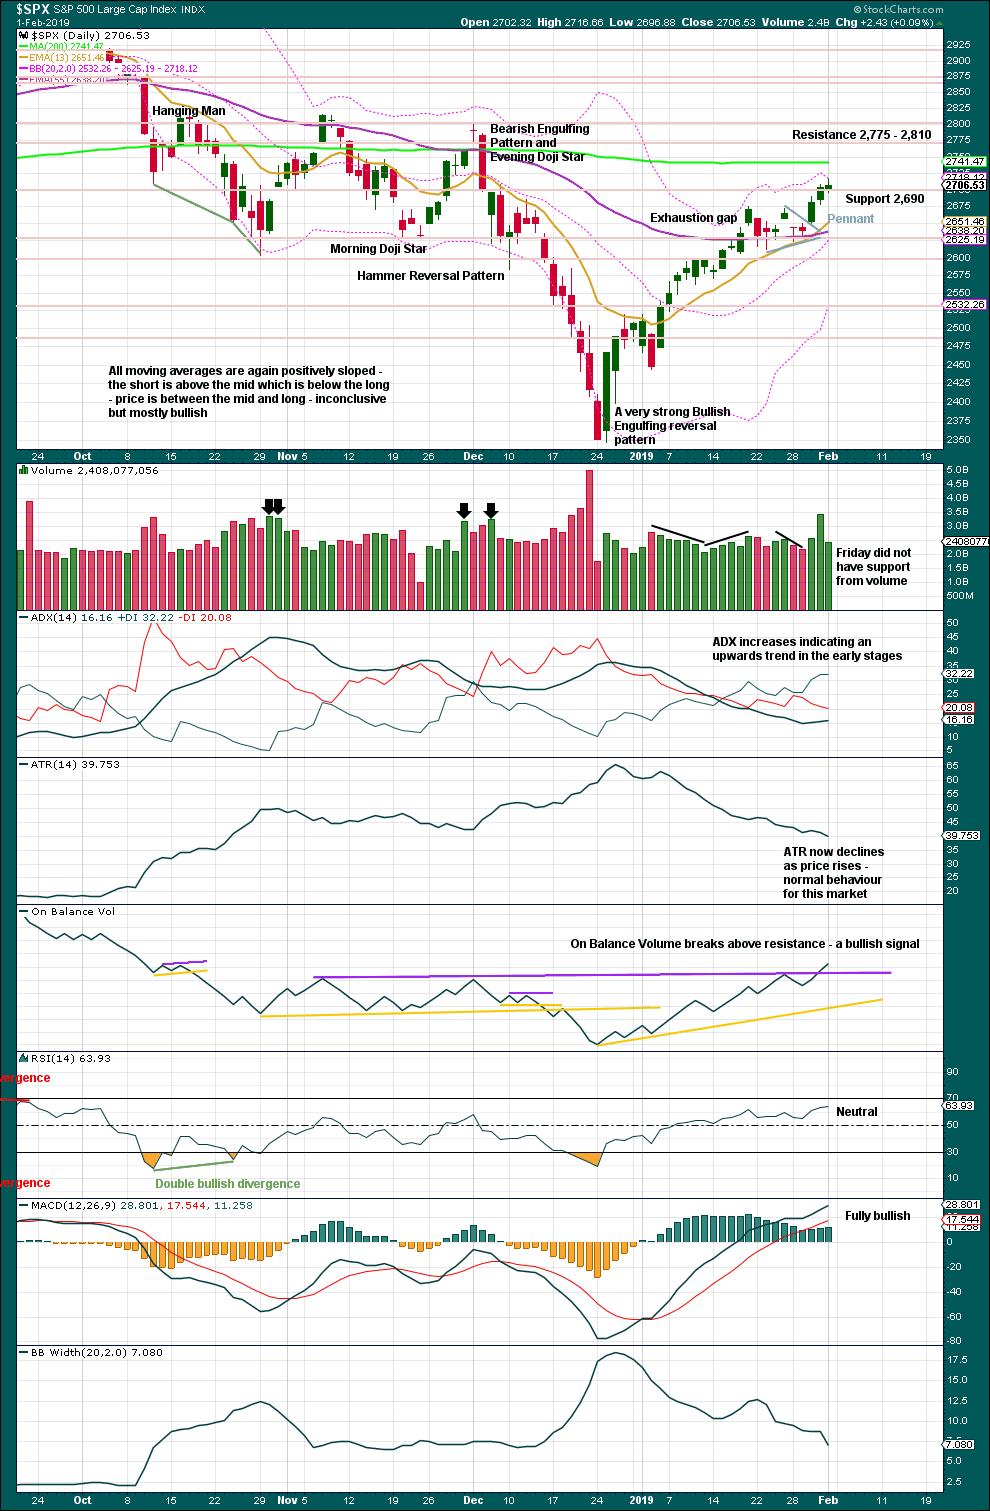
Click chart to enlarge. Chart courtesy of StockCharts.com.
Over a fairly long period of time this ageing bull market has been characterised by upwards movement on light and declining volume and low ATR. For the short to mid term, little concern may be had if price now rises again on declining volume. Current market conditions have allowed for this during a sustained rise in price.
It is also normal for this market to have lower ATR during bullish phases, and strongly increasing ATR during bearish phases. Currently, declining ATR is normal and not of a concern.
Considering the larger picture from the Elliott wave count, some weakness approaching the end of Grand Super Cycle wave I is to be expected.
From Kirkpatrick and Dhalquist, “Technical Analysis” page 152:
“A 90% downside day occurs when on a particular day, the percentage of downside volume exceeds the total of upside and downside volume by 90% and the percentage of downside points exceeds the total of gained points and lost points by 90%. A 90% upside day occurs when both the upside volume and points gained are 90% of their respective totals”…
and “A major reversal is singled when an NPDD is followed by a 90% upside day or two 80% upside days back-to-back”.
The current situation saw two 80% downside days on December 20th and 21st, then a near 90% downside day with 88.97% downside on December 24th. This very heavy selling pressure on three sessions together may be sufficient to exhibit the pressure observed in a 90% downside day.
This has now been followed by two 90% upside days: on December 26th and again on 4th January.
The current situation looks very much like a major low has been found.
The target for upwards movement following the pennant pattern remains at 2,881.
While Thursday had strong support from volume for upwards movement, Friday did not. However, in current market conditions this should not be given much weight.
The bullish signal from On Balance Volume should be given more weight. Overall, this chart supports the idea that upwards movement should continue next week.
BREADTH – AD LINE
WEEKLY CHART
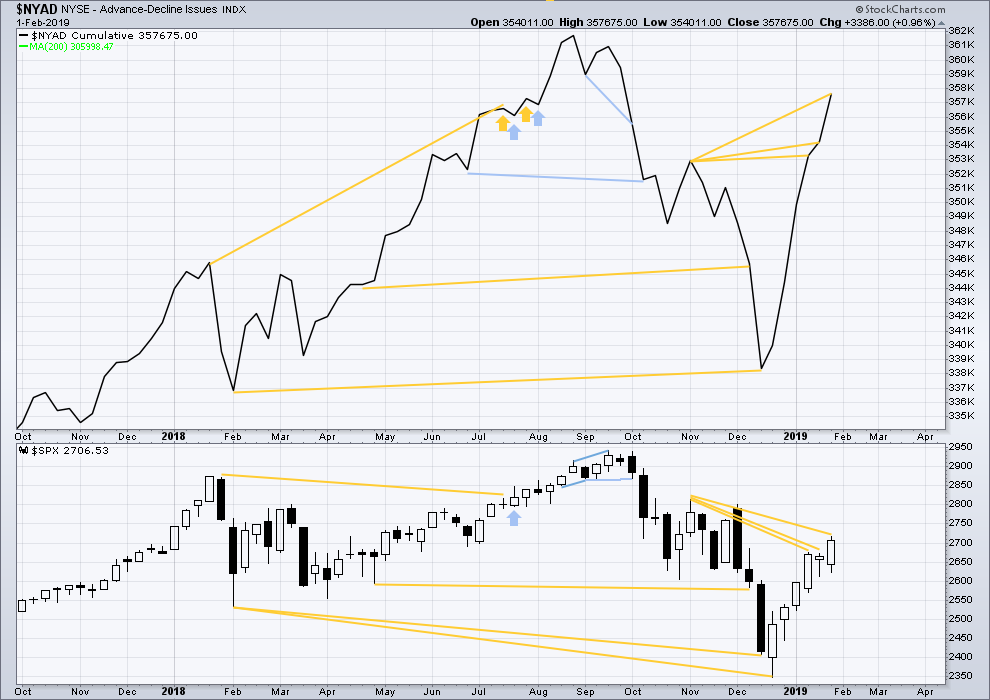
Click chart to enlarge. Chart courtesy of StockCharts.com. So that colour blind members are included, bearish signals
will be noted with blue and bullish signals with yellow.
The AD line has made yet another new high above the prior swing high of the week beginning 5th of November 2018, but price has not. This divergence is bullish for the mid term.
DAILY CHART
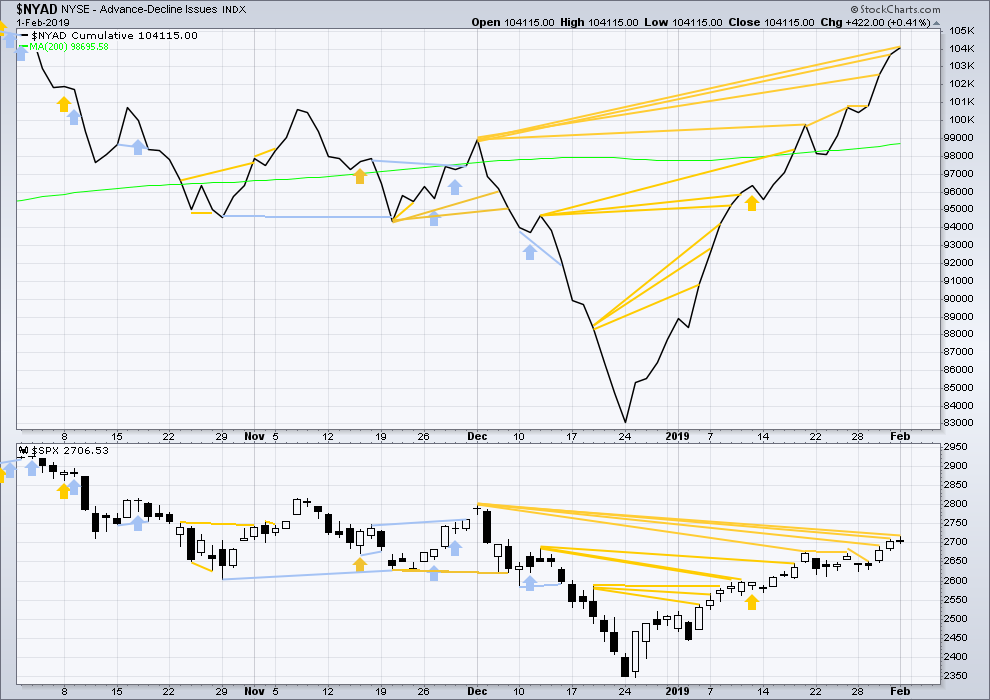
Click chart to enlarge. Chart courtesy of StockCharts.com. So that colour blind members are included, bearish signals
will be noted with blue and bullish signals with yellow.
Breadth should be read as a leading indicator.
There is now a cluster of bullish signals from the AD line. This supports the main Elliott wave count.
Again on Friday, the AD line continues to make new highs above the prior high of the 3rd of December 2018, but price has not yet matched this high. This divergence is bullish for the mid term.
VOLATILITY – INVERTED VIX CHART
WEEKLY CHART
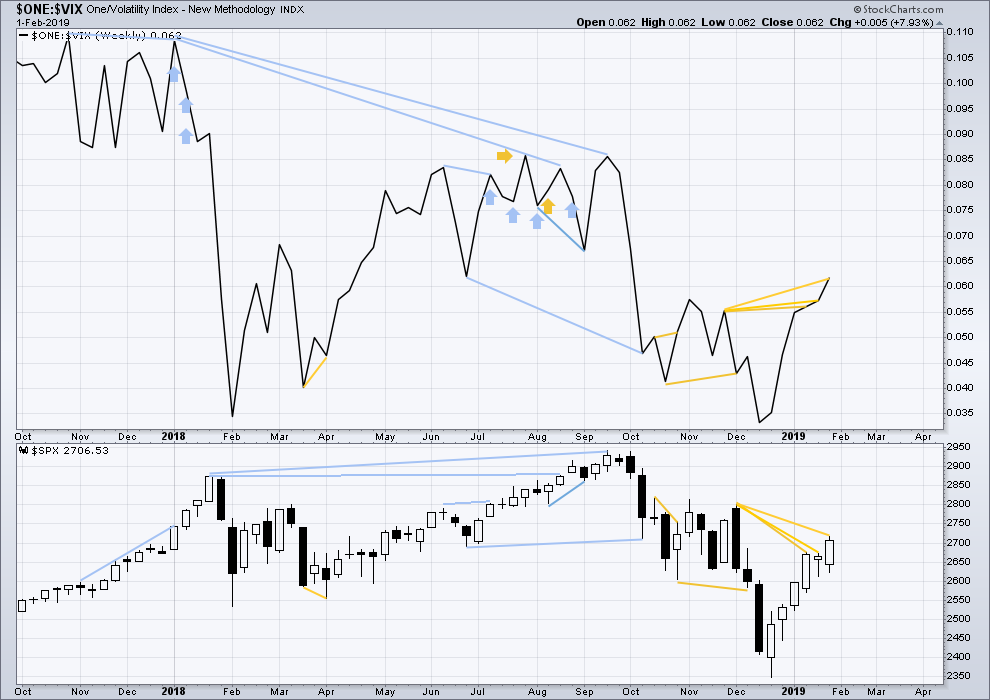
Click chart to enlarge. Chart courtesy of StockCharts.com. So that colour blind members are included, bearish signals
will be noted with blue and bullish signals with yellow.
Again this week, inverted VIX has made another new high above the prior swing high of the weeks beginning 26th of November and 3rd of December 2018, but price has not. This divergence is bullish for the mid term.
DAILY CHART
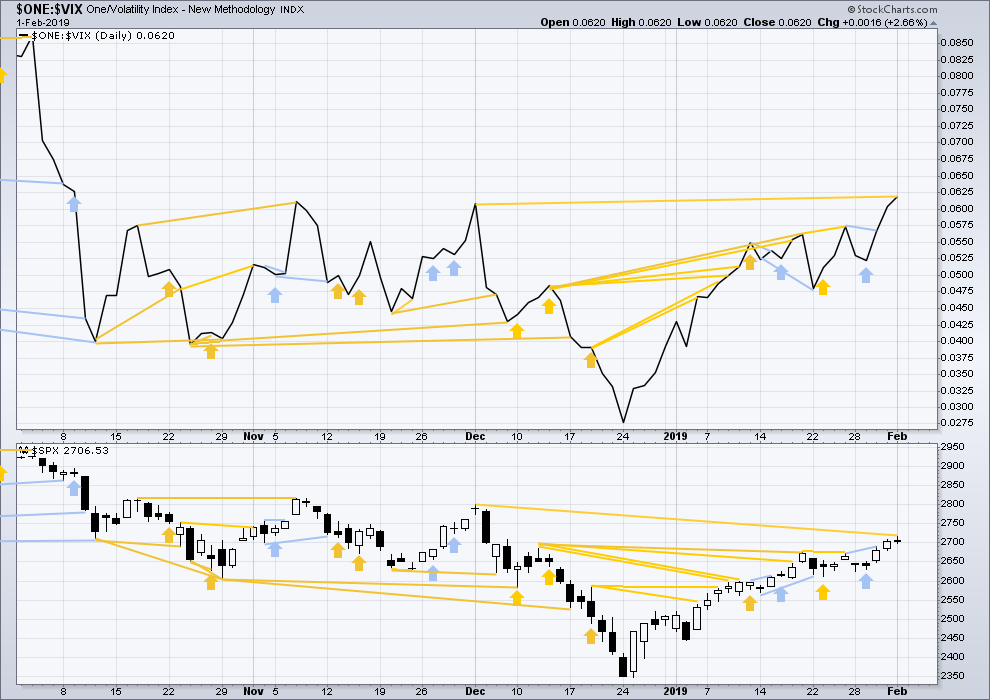
Click chart to enlarge. Chart courtesy of StockCharts.com. So that colour blind members are included, bearish signals
will be noted with blue and bullish signals with yellow.
There is now a cluster of bullish signals from inverted VIX. This supports the main Elliott wave count.
On Friday inverted VIX made a new high above the prior swing high of the 3rd of December, but price has not yet made a corresponding new high. This divergence is bullish for the mid term.
DOW THEORY
Dow Theory confirms a bear market. This does not necessarily mean a bear market at Grand Super Cycle degree though; Dow Theory makes no comment on Elliott wave counts. On the 25th of August 2015 Dow Theory also confirmed a bear market. The Elliott wave count sees that as part of cycle wave II. After Dow Theory confirmation of a bear market in August 2015, price went on to make new all time highs and the bull market continued.
DJIA: 23,344.52 – a close on the 19th of December at 23,284.97 confirms a bear market.
DJT: 9,806.79 – price has closed below this point on the 13th of December.
S&P500: 2,532.69 – a close on the 19th of December at 2,506.96 provides support to a bear market conclusion.
Nasdaq: 6,630.67 – a close on the 19th of December at 6,618.86 provides support to a bear market conclusion.
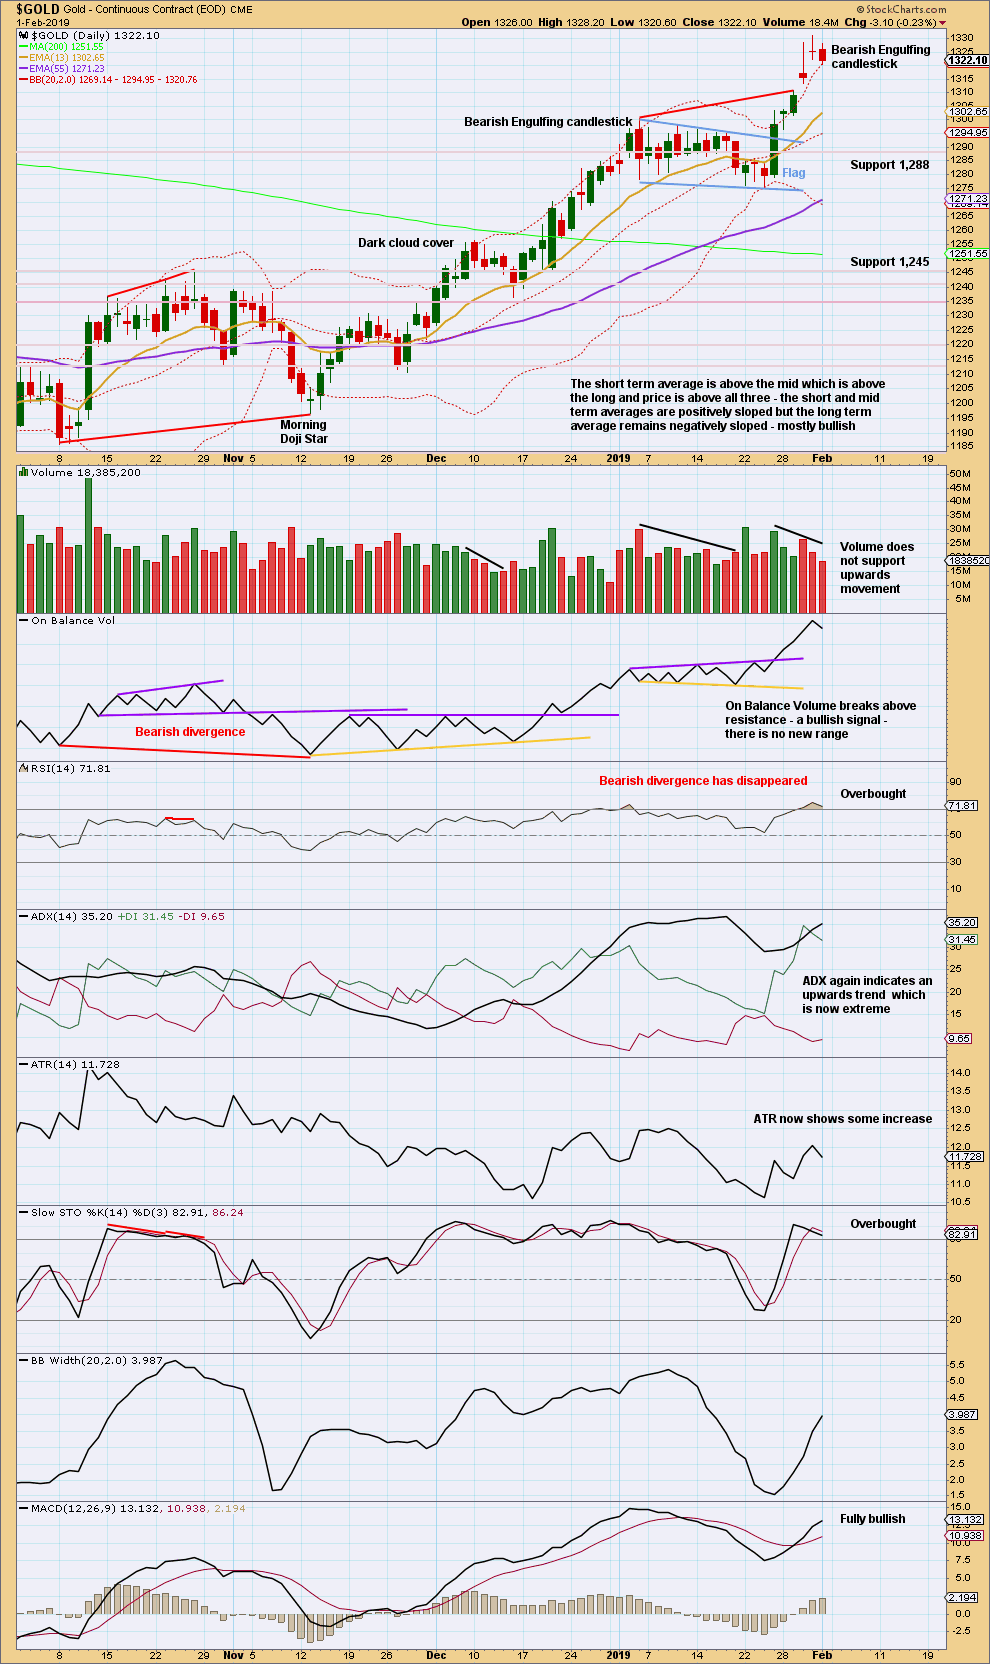
GOLD
The target remains the same. At the end of this week, a channel and a specific price point are used to indicate a trend change.
Summary: The next Elliott wave target is at 1,338. The next classic analysis target is at 1,349.
Assume the trend remains the same until proven otherwise.
For confidence in a trend change the following things may be seen:
1. A candlestick reversal pattern on the daily chart – Friday completes a Bearish Engulfing pattern, but is not a very strong one.
2. A new low below 1,276.84.
3. A breach of the blue channel on the daily chart.
Once a trend change is indicated, then a new wave down to last years may be expected to make new lows below 1,046.27.
Grand SuperCycle analysis is here.
Last historic analysis with monthly charts is here.
Only two remaining wave counts have a reasonable probability and are published below: a triangle (the preferred wave count) and a double zigzag.
MAIN ELLIOTT WAVE COUNT
WEEKLY CHART – TRIANGLE
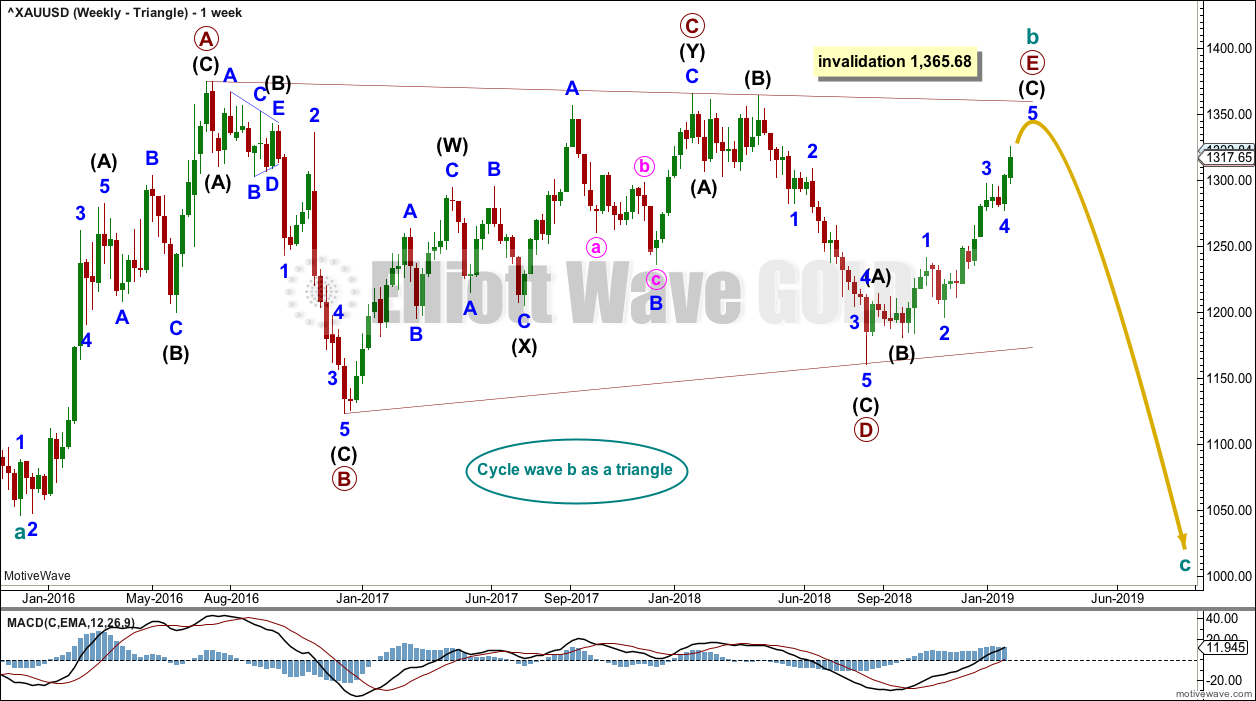
Click chart to enlarge.
Cycle wave b may be an almost complete regular contracting triangle. Primary wave E may not move beyond the end of primary wave C above 1,365.68.
Within primary wave E, intermediate waves (A) and (B) may be complete. Intermediate wave (C) must subdivide as a five wave structure. This structure is now almost complete.
Four of the five sub-waves of a triangle must be zigzags, with only one sub-wave allowed to be a multiple zigzag. Wave C is the most common sub-wave to subdivide as a multiple, and this is how primary wave C for this example fits best. Primary wave E looks like it is unfolding as a single zigzag.
There are no problems in terms of subdivisions or rare structures for this wave count. It has an excellent fit and so far a typical look.
When primary wave E is a complete three wave structure, then this wave count would expect a cycle degree trend change. Cycle wave c would most likely make new lows below the end of cycle wave a at 1,046.27 to avoid a truncation.
It is possible now that primary wave E may next week. It is also possible it could have been over at this week’s high. Some reasonable weakness should be expected at its end. Triangles often end with declining ATR, weak momentum and weak volume.
DAILY CHART – TRIANGLE
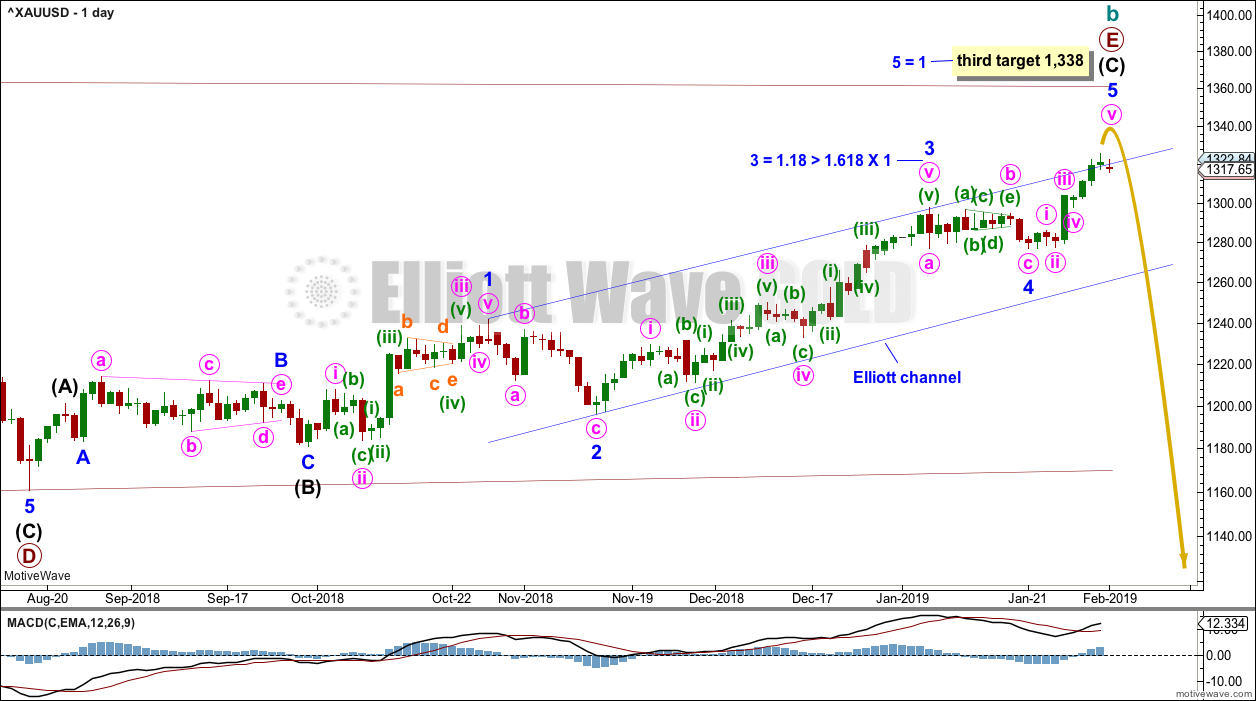
Click chart to enlarge.
Primary wave E may now be almost complete for this wave count.
Primary wave E should subdivide as a zigzag. Intermediate waves (A) and (B) may now be complete. Intermediate wave (C) may be complete, but as yet there is no confidence in a high.
It is now possible to see minor wave 5 complete at the daily chart level. However, it is always safest to assume the trend remains the same until proven otherwise. For any confidence in a trend change it needs to be indicated by one or more of the following:
1. A candlestick reversal pattern on the daily chart – Friday’s candlestick is a Bearish Engulfing pattern, but it is not a strong one.
2. A new low below 1,276.84.
3. A breach of the blue channel on the daily chart.
One target now remains for minor wave 5 to end.
The target would expect primary wave E to fall short of the maroon A-C trend line. This is the most common look for E waves of Elliott wave triangles.
WEEKLY CHART – DOUBLE ZIGZAG
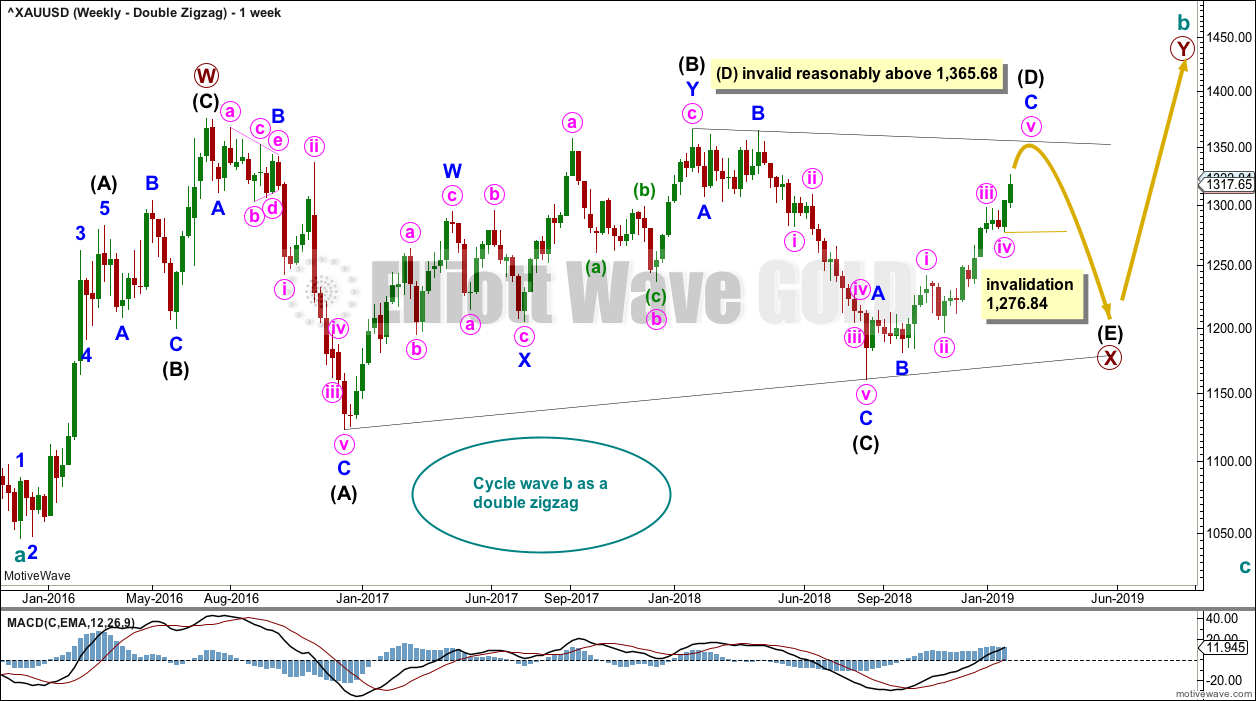
Click chart to enlarge.
It is possible that cycle wave b may be a double zigzag or a double combination.
The first zigzag in the double is labelled primary wave W. This has a good fit.
The double may be joined by a corrective structure in the opposite direction, a triangle labelled primary wave X. The triangle would be about three quarters complete.
Within the triangle of primary wave X, intermediate wave (C) should be complete. Within intermediate wave (D), minor waves A and B may be complete. Minor wave C must subdivide as a five wave structure. Within minor wave C, minute wave iv should now be over. Within minute wave v, no second wave correction may move beyond its start below 1,276.84.
Intermediate wave (D) would most likely subdivide as a single zigzag. Intermediate wave (D) should end at the upper (B)-(D) trend line for this wave count, so that the triangle adheres neatly to this trend line. That price point is about 1,354. This wave count now requires upwards movement to continue. It would not be acceptable for the upper (B)-(D) trend line to have breaches or substantial overshoots. Elliott wave triangles almost always adhere very neatly to their trend lines.
This wave count may now expect choppy overlapping movement in an ever decreasing range for a few more months.
Primary wave Y would most likely be a zigzag because primary wave X would be shallow; double zigzags normally have relatively shallow X waves.
Primary wave Y may also be a flat correction if cycle wave b is a double combination, but combinations normally have deep X waves. This would be less likely.
This wave count has good proportions and no problems in terms of subdivisions.
TECHNICAL ANALYSIS
WEEKLY CHART
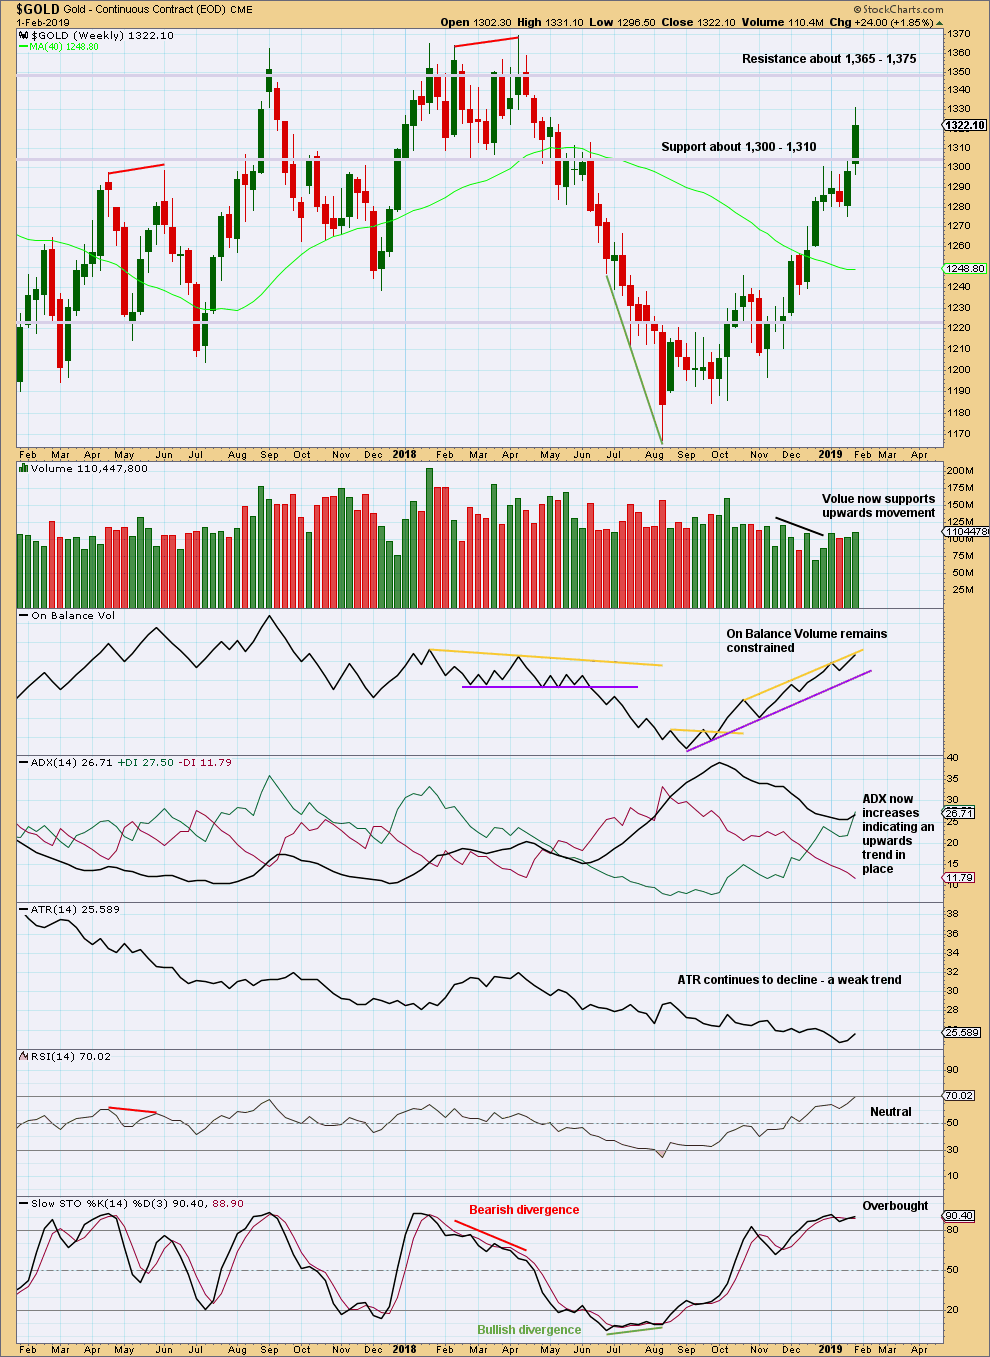
Click chart to enlarge. Chart courtesy of StockCharts.com.
ADX now indicates an upwards trend. Volume supports it. This chart is mostly bullish. There is strong resistance ahead at 1,365 – 1,375.
DAILY CHART
Click chart to enlarge. Chart courtesy of StockCharts.com.
Using the flag pole length, a target at 1,359 is calculated. This target looks rather optimistic.
The last gap may be a measuring gap. A shorter-term target calculated using this gap is at 1,349.
With the trend now extreme and a bearish candlestick reversal pattern, some caution regarding the above targets would be advisable. However, Friday’s candlestick has a small real body; this is not a strong Bearish Engulfing pattern.
GDX WEEKLY CHART
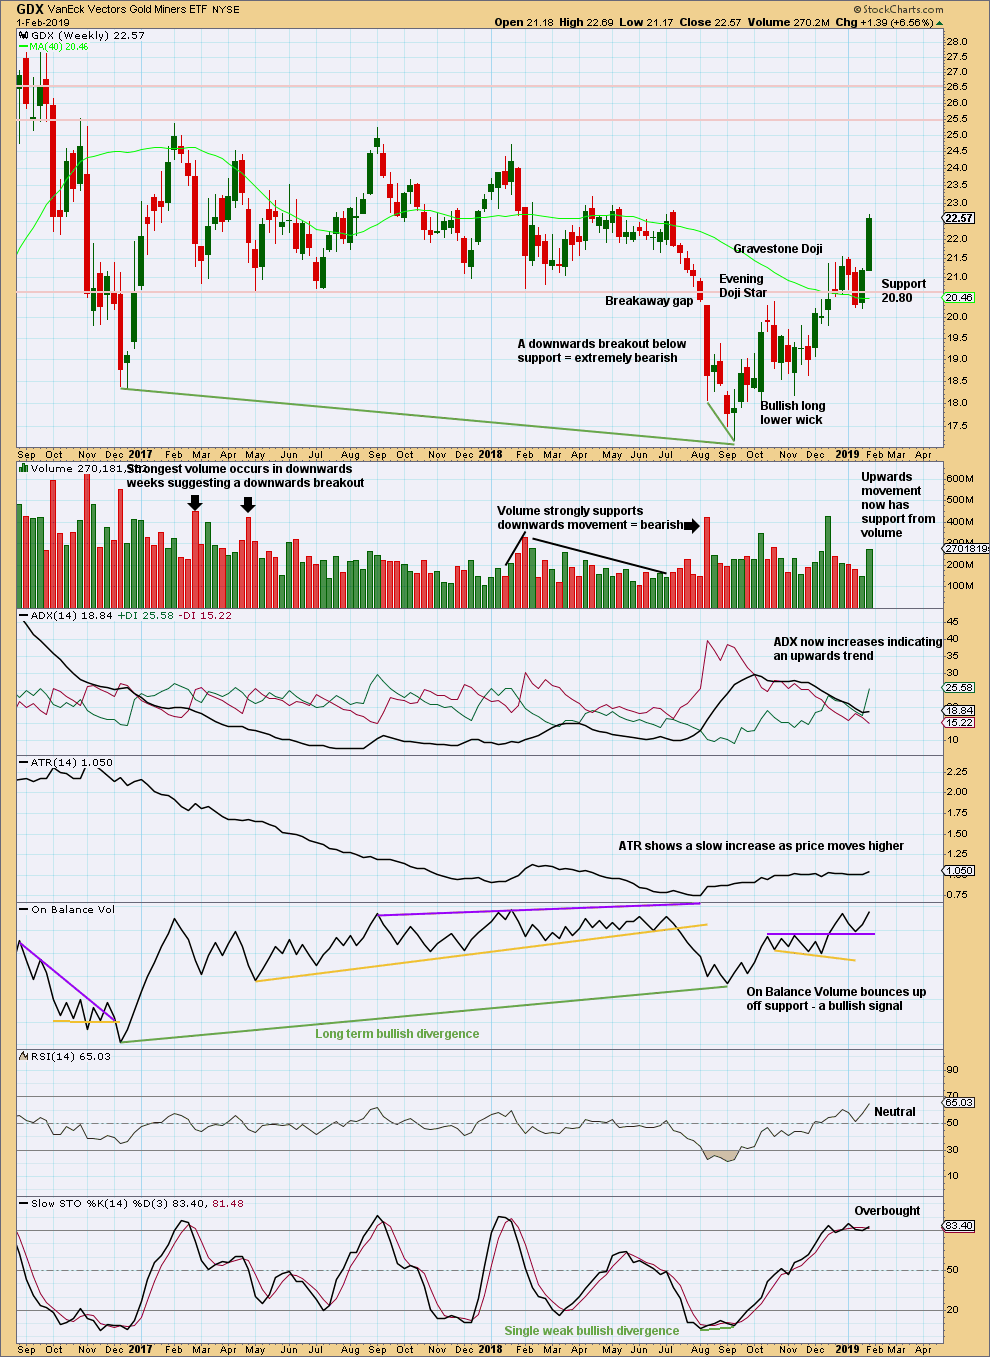
Click chart to enlarge. Chart courtesy of StockCharts.com.
A close back above 20.80 switches the short-term outlook from bearish to neutral or bullish. This weekly candlestick is very strong and has good support from volume. This is bullish for the short term.
GDX DAILY CHART
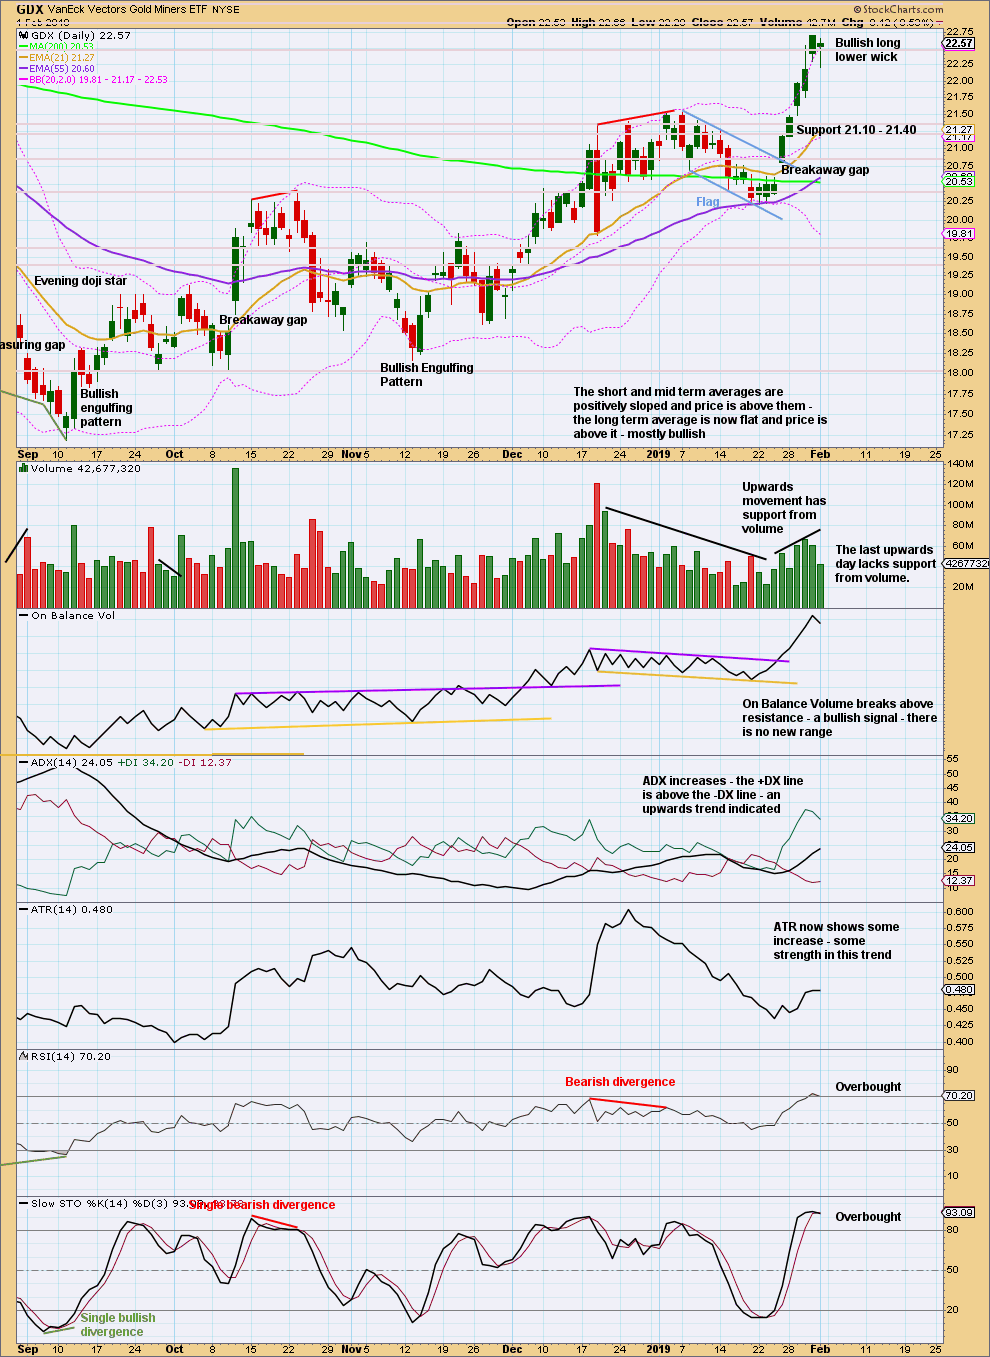
Click chart to enlarge. Chart courtesy of StockCharts.com.
The flag pattern remains valid for GDX. It lasted 14 sessions and now looks complete with an upwards breakout on Friday.
Flags are continuation patterns. The target would be about 22.60.
Assume the trend remains the same until proven otherwise. There is no evidence of a trend change for GDX; assume price will keep moving higher to the target.
US OIL
For the short term, sideways movement was expected to continue for this week. An outside week mostly fits this expectation.
Summary: A little downwards movement may begin next week to complete wave B about 50.82 to 50.52. Thereafter, the upwards bounce should continue to the final target about 63.71.
The larger picture still sees Oil in a new downwards trend to end reasonably below 26.06.
MAIN ELLIOTT WAVE COUNT
MONTHLY CHART
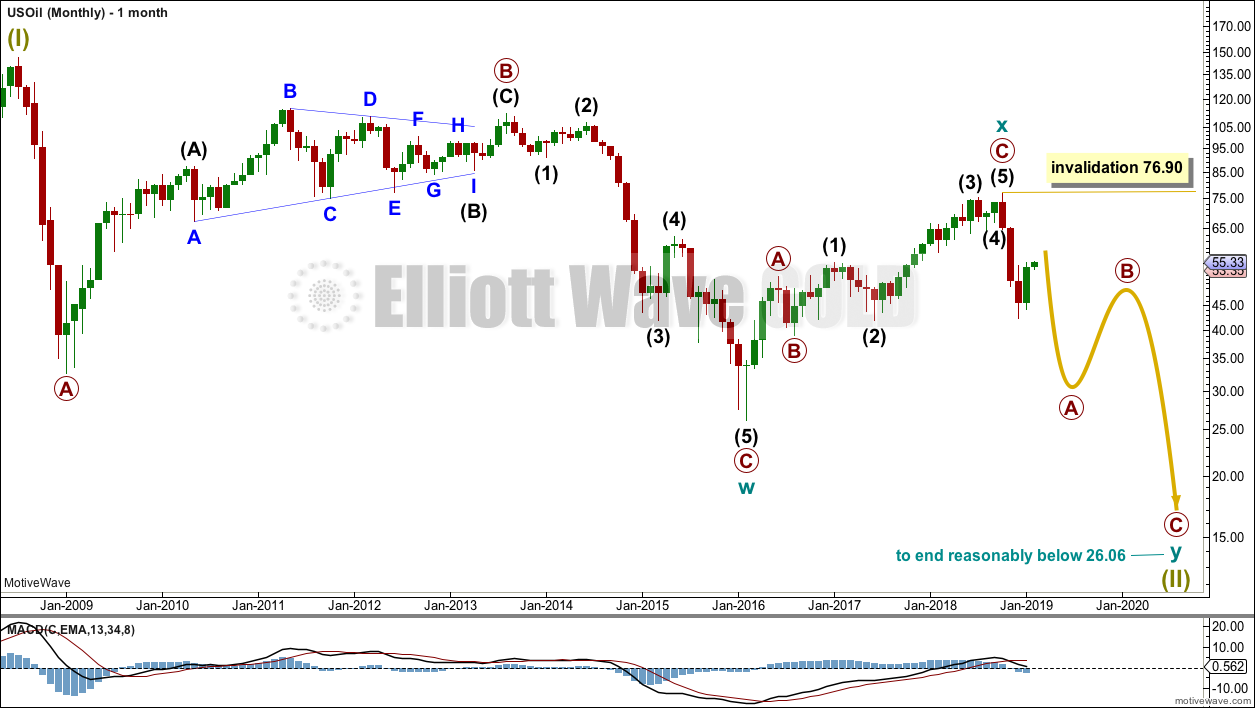
Click chart to enlarge.
Classic technical analysis favours a bearish wave count for Oil at this time.
The large fall in price from the high in June 2008 to February 2016 is seen as a complete three wave structure. This large zigzag may have been only the first zigzag in a deeper double zigzag.
The first zigzag down is labelled cycle wave w. The double is joined by a now complete three in the opposite direction, a zigzag labelled cycle wave x.
The purpose of a second zigzag in a double is to deepen the correction when the first zigzag does not move price deep enough. Cycle wave y would be expected to move reasonably below the end of cycle wave w to deepen the correction. Were cycle wave y to reach equality with cycle wave w that takes Oil into negative price territory, which is not possible. Cycle wave y would reach 0.618 the length of cycle wave w at $2.33.
A better target calculation would be using the Fibonacci ratios between primary waves A and C within cycle wave y. This cannot be done until both primary waves A and B are complete.
Within cycle wave y, no second wave correction nor B wave may move beyond its start above 76.90.
WEEKLY CHART
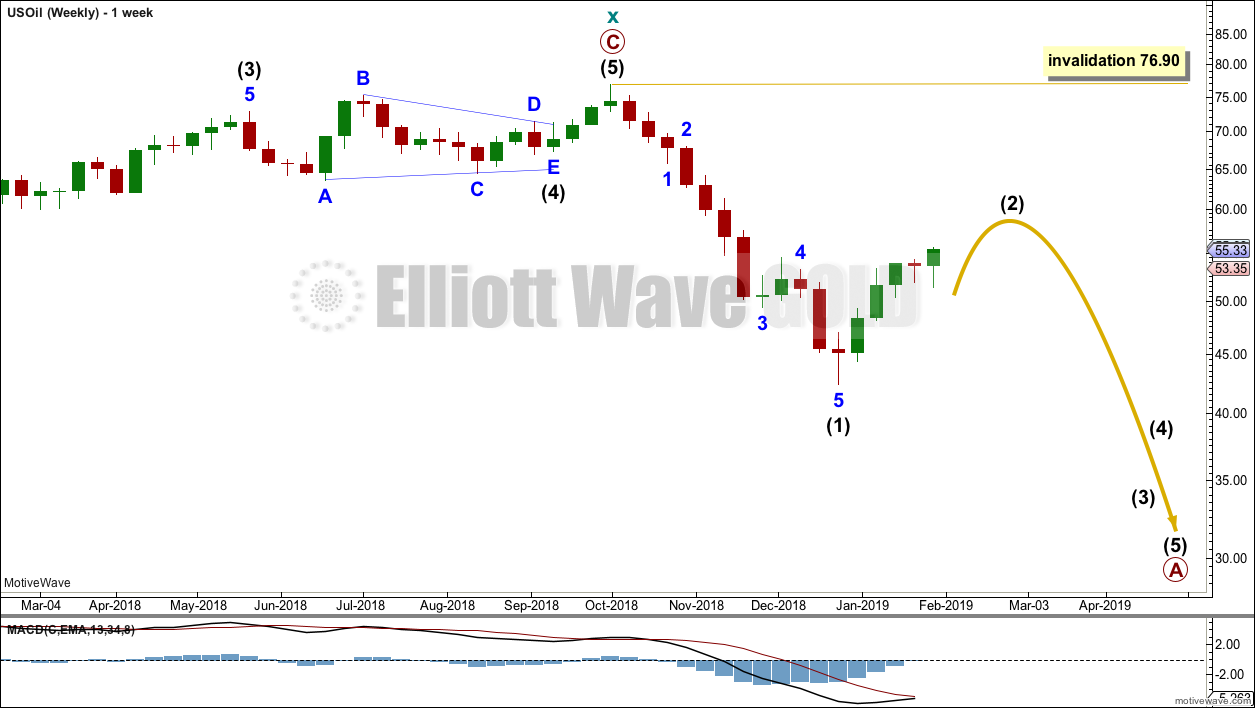
Click chart to enlarge.
This weekly chart is focussed on the start of cycle wave y.
Cycle wave y is expected to subdivide as a zigzag. A zigzag subdivides 5-3-5. Primary wave A must subdivide as a five wave structure if this wave count is correct.
Within primary wave A, intermediate wave (1) may now be complete. Intermediate wave (2) may unfold over a few weeks as a sideways choppy consolidation, or a deep sharp bounce. At this stage, it looks more likely to be a deep bounce.
Intermediate wave (2) should look like a three wave structure when it is complete on the weekly chart; for that to happen minor wave B within it should be clear.
Intermediate wave (2) may not move beyond the start of intermediate wave (1) above 76.90.
MAIN DAILY CHART
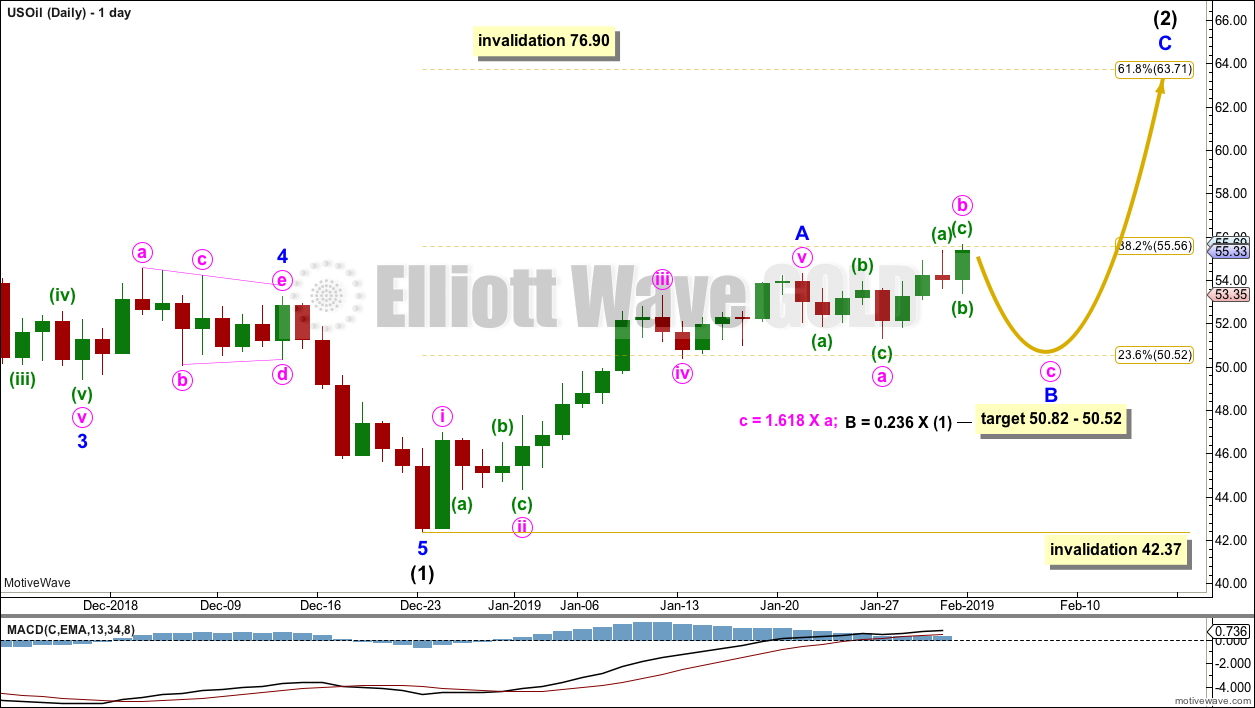
Click chart to enlarge.
Intermediate wave (2) would most likely subdivide as a zigzag and at this stage that is how it will be labelled. However, it may also subdivide as a flat or combination. It is impossible at this stage to know which structure it will unfold as. The labelling within it may change as it unfolds.
If intermediate wave (2) is unfolding as a zigzag, then within it minor wave A may now be a complete impulse.
Minor wave B may not move beyond the start of minor wave A below 42.37.
At this stage, minor wave B may be unfolding as an expanded flat correction, which is a fairly common structure. Within this expanded flat, minute wave b is now a 1.45 length of minute wave a. This is longer than the common range of 1 to 1.38 times the length of minute wave a, but within an allowable limit of up to 2 times minute wave a.
A target is calculated for minute wave c to to reach the most common Fibonacci ratio to minute wave a for an expanded flat.
When minor wave B is complete, then another five wave structure upwards for minor wave C may be expected to unfold.
Intermediate wave (2) may be very deep.
Intermediate wave (2) may not move beyond the start of intermediate wave (1) above 76.90.
ALTERNATE DAILY CHART
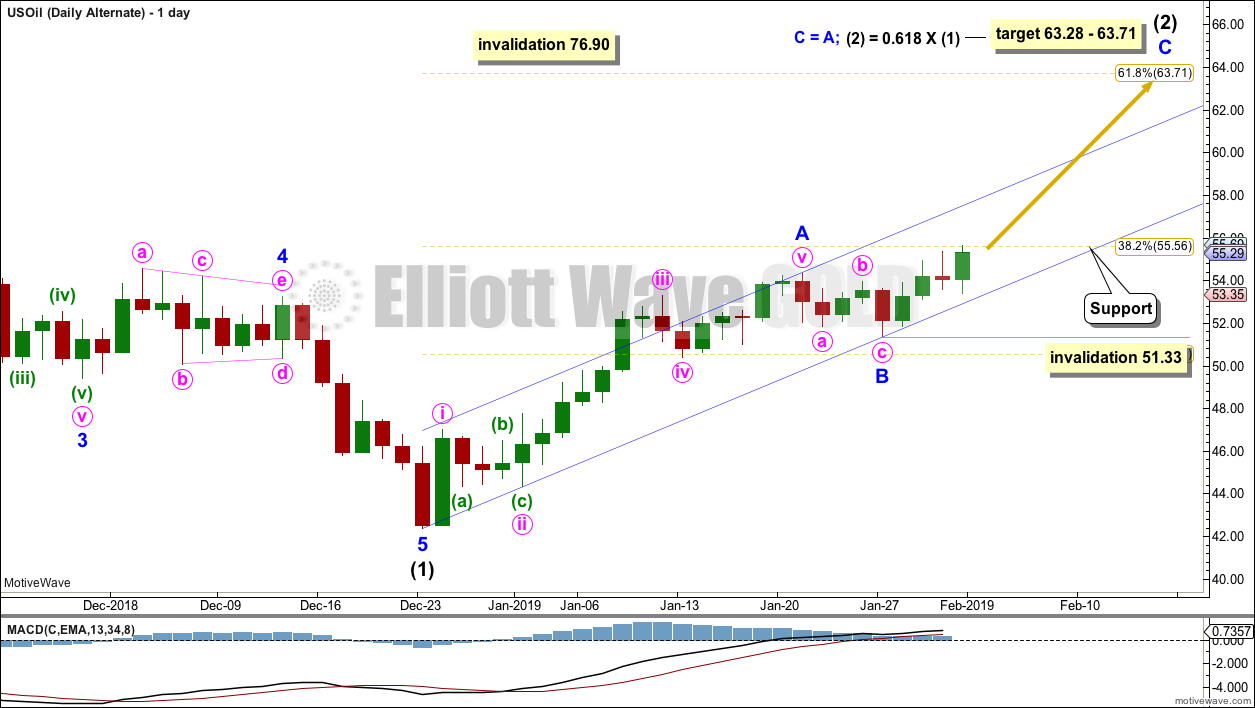
Click chart to enlarge.
This alternate wave count looks at the possibility that minor wave B may be over as a brief shallow zigzag. This is possible, but it lacks support from classic technical analysis.
Within minor wave C, no second wave correction may move beyond its start below 51.33.
A channel is drawn about intermediate wave (2) using Elliott’s technique for a correction. If this wave count is correct, then any pullbacks within minor wave C should find support at the lower edge of the channel.
A breach of the lower edge of this channel would add confidence to the main daily Elliott wave count.
TECHNICAL ANALYSIS
MONTHLY CHART
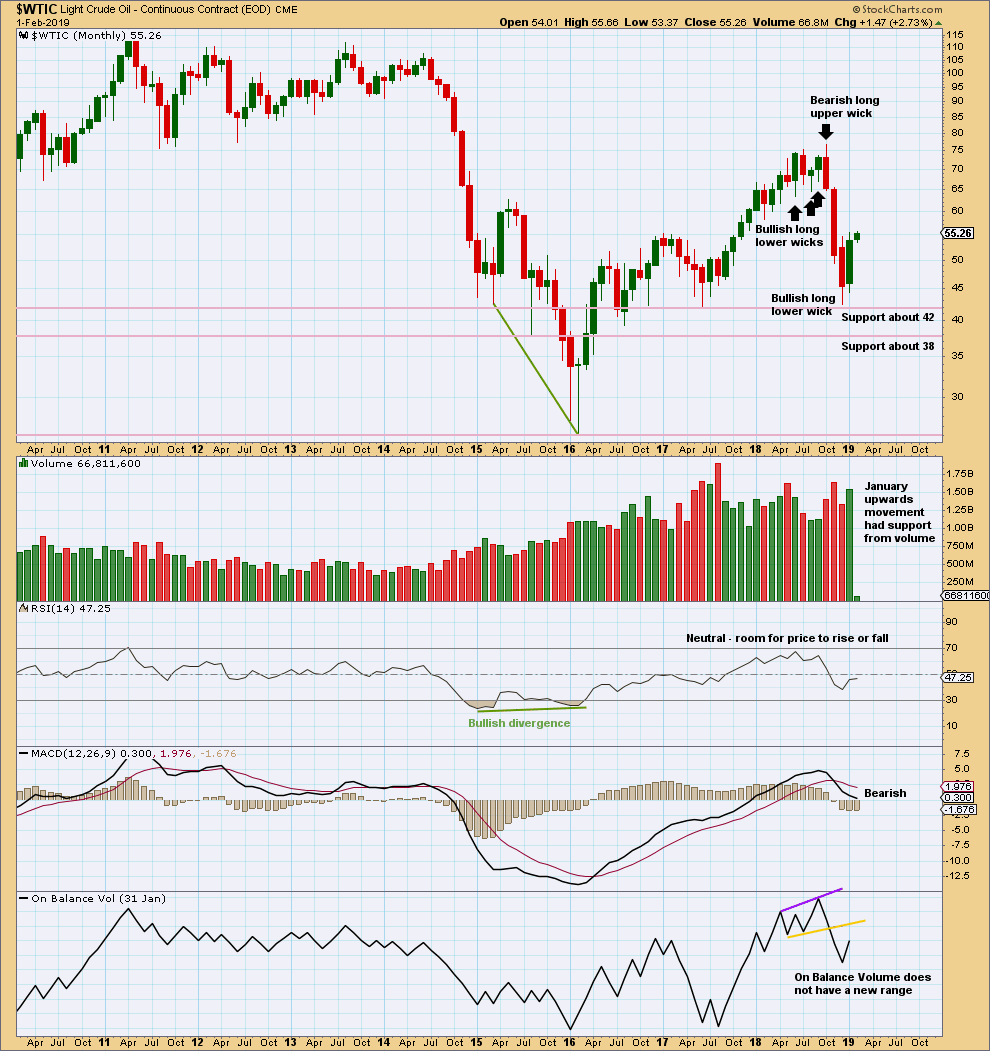
Click chart to enlarge. Chart courtesy of StockCharts.com.
Upwards movement within January has support from volume. This supports the Elliott wave count which expects overall more upwards movement in coming weeks.
WEEKLY CHART
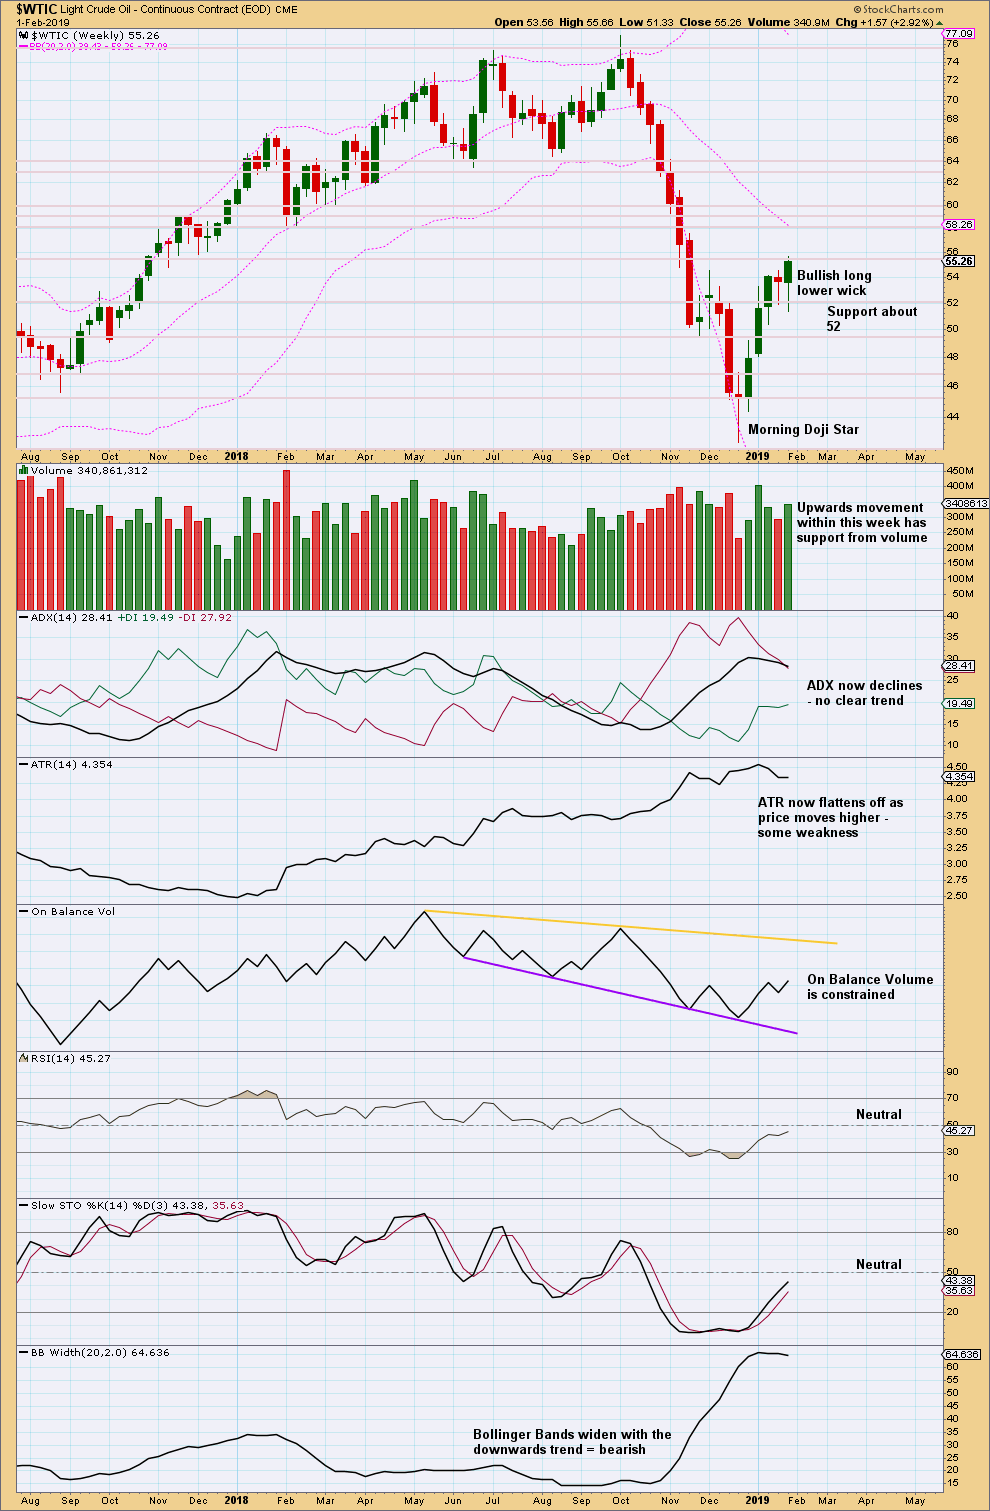
Click chart to enlarge. Chart courtesy of StockCharts.com.
At the weekly chart level, it looks like upwards movement should continue next week; the long lower wick and support from volume is overall bullish.
DAILY CHART
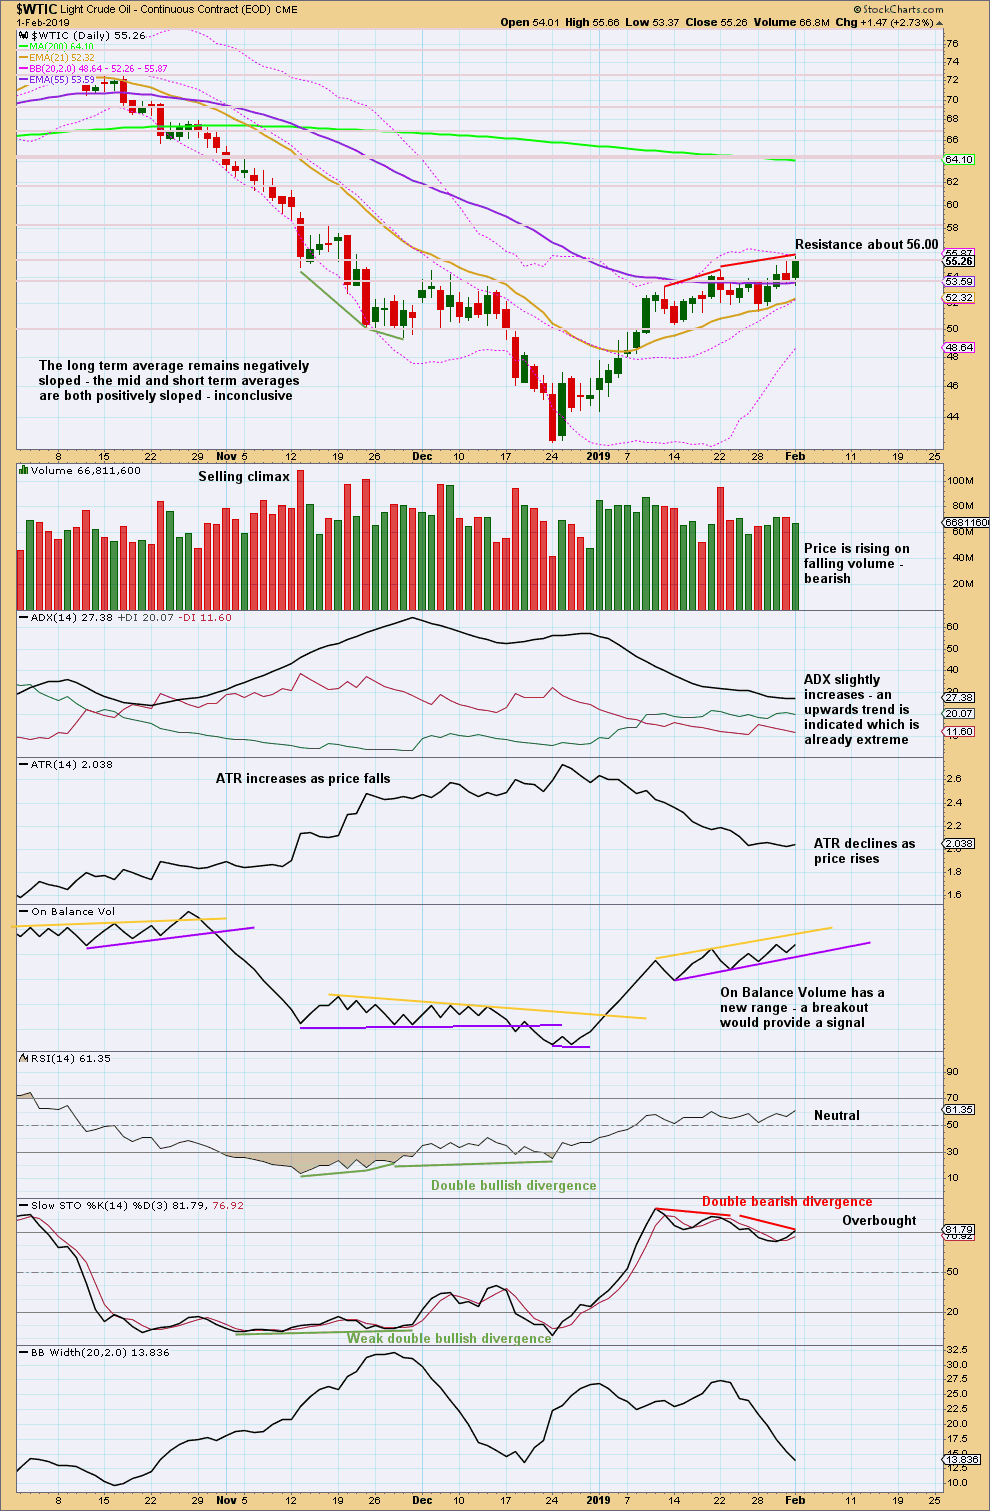
Click chart to enlarge. Chart courtesy of StockCharts.com.
A slight new high lacks support from volume and exhibits bearish divergence with Stochastics while Stochastics is overbought. This looks like a B wave. This chart supports the main daily Elliott wave count.
—
Always practice good risk management as the most important aspect of trading. Always trade with stops and invest only 1-5% of equity on any one trade. Failure to manage risk is the most common mistake new traders make.
For the S&P500:
It looks like primary wave 1 is now over and primary wave 2 has arrived.
First target for P2 is the 0.382 Fibonacci ratio at 2,579.84. Don’t expect P2 to move in a straight line. It should be a three wave structure, it may have a complicated time consuming sideways B wave within it.
Look for P2 to last possibly a Fibonacci 21 or 34 sessions.
At its end P2 may offer a nice entry point for long positions.
Updated daily chart for the S&P500
Hi Lara, for confirmation of a B wave still occuring for oil, does the price have to break the bottom of the channel with a lot of volume? On my chart it looks as though the price has moved side ways out of the channel in the last 12 hours.
Also, for gold, are we still in an uptrend?
Jiten
US Oil: No, volume is not necessary to push price lower. Price may fall of its own weight. Another way of saying it, is a lack of buyers can push price lower in the same way as activity from sellers.
Gold: I think that cycle b could be over and Gold may have exhibited a trend change. But this opinion today does not have any support from technical indicators of a trend change. Consider my analysis for Gold right now to be more neutral, awaiting evidence of a trend change. That evidence is outlined in my summary for Gold. There is a bearish engulfing pattern, but it was a rather small one. I want the blue channel to be breached now for confidence.
Hi Lara,
Not sure if you would catch this comment, since you do not get alerts for new comments – not sure if that has changed?
Is there a bearish alternative to SP500? I want to jump into SPY long, but just wanted to make reasonably sure that a bearish possibility does not exist.
Thanks.
I check comments daily.
At this time I am not prepared to publish an immediately bearish wave count for the S&P500. I am fairly confident that the S&P will make new all time highs this year.
This is because the conditions for a fully fledged bear market were not evident at the last all time high in September 2018. Every bear market of the last almost 90 odd years has been preceded by a decline in market breadth for a minimum of 4-6 months at the end of the prior bull market. In September 2018 there was no decline in market breadth (operating companies only) or only about 2 weeks for all issues.
If the S&P is now in a bear market then it would be a new occurrence in over 90 years. I do not like those odds, so I won’t publish something with such a low probability.
For the short to mid term though I am looking out for an upcoming primary degree second wave correction. That may offer a nice entry point for long positions.
Thank you Lara. Wonderful. I have been here long enough to have complete trust in your analysis. I shall start with small positions and wait for the correction.
Thank you kindly.
That’s great Dave.
It makes me slightly nervous to hear you have complete trust though. I am sometimes wrong. So always always manage risk carefully. You don’t want to have uncontrolled losses if I’m wrong.
No worries Lara. I have taken your risk management notice to heart, especially after paying a price for failing to do so.
Sorry, I didn’t mean to make you nervous. I fully understand that no matter how accurate the analysis, results are always dynamic with no guarantees.