

S&P 500
Upwards movement continues as last analysis expected it to.
Summary: Upwards movement is slowing now it has reached a strong zone of resistance about 2,800 to 2,815. A new first target for the trend to be interrupted is at 2,814.
If price reaches 2,814 and the structure is incomplete or it just keeps rising, then the next target is at 2,856.
The bottom line for primary wave 1 now is we should assume it will continue higher towards targets until the black channel on the daily chart is breached by downwards movement.
The bigger picture still expects that a low may now be in place.
The final target is at 3,045 with a limit at 3,477.39.
The biggest picture, Grand Super Cycle analysis, is here.
Monthly charts are updated again at the end of this week.
ELLIOTT WAVE COUNT
MONTHLY CHART
Click chart to enlarge.
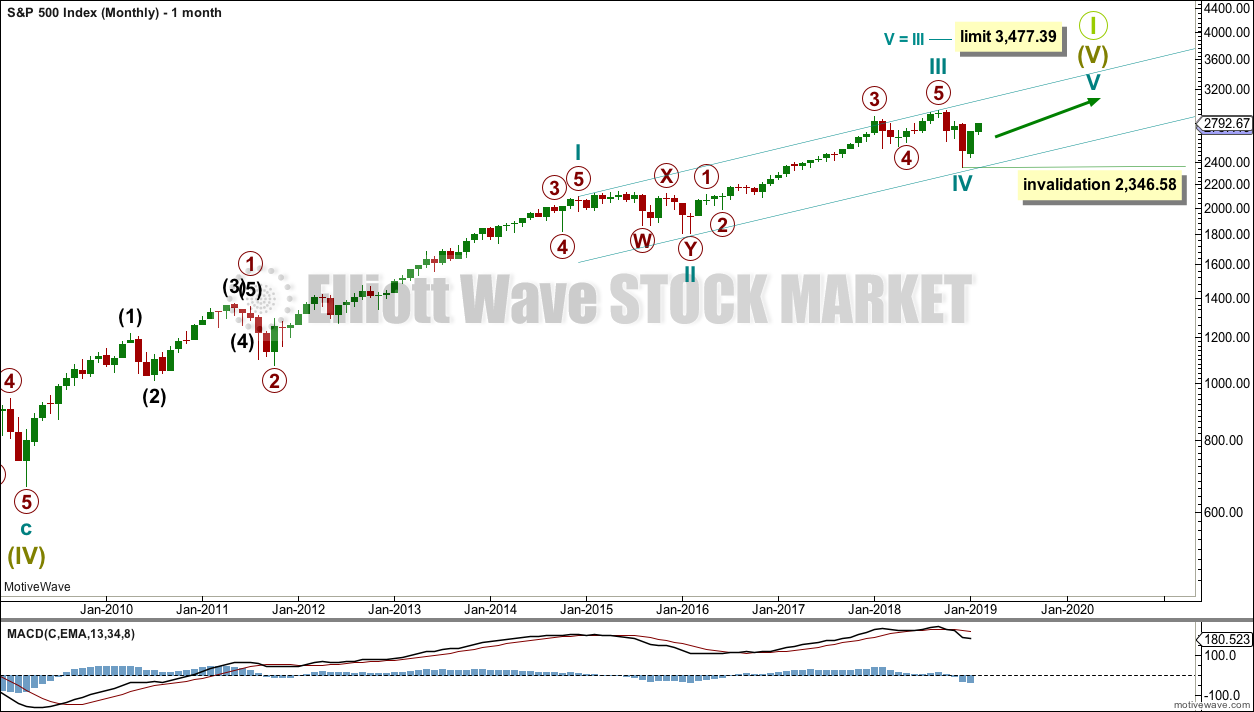
Super Cycle wave (IV) completed a 8.5 year correction. Thereafter, a bull market began for Super Cycle wave (V). The structure of Super Cycle wave (V) is incomplete. It is subdividing as an impulse.
There is no Fibonacci ratio between cycle waves I and III within Super Cycle wave (V). Cycle wave V will be limited to no longer than equality with cycle wave III, so that cycle wave III is not the shortest actionary wave.
A channel is drawn about the impulse of Super Cycle wave (V) using Elliott’s first technique. Cycle wave IV found support about the lower edge.
There is perfect alternation between a shallow time consuming combination for cycle wave II and now a deeper and more brief double zigzag for cycle wave IV. The speed and depth of cycle wave IV makes these two corrections look like they should be labelled the same degree. This wave count has the right look.
Within cycle wave V, no second wave correction may move beyond the start of its first wave below 2,346.58.
This wave count expects MACD to begin to exhibit divergence with price as price makes new highs. Cycle wave III should exhibit strongest momentum and cycle wave V should exhibit some weakness. If price makes new highs but MACD does not, then this would remain the main wave count.
WEEKLY CHART
Click chart to enlarge.
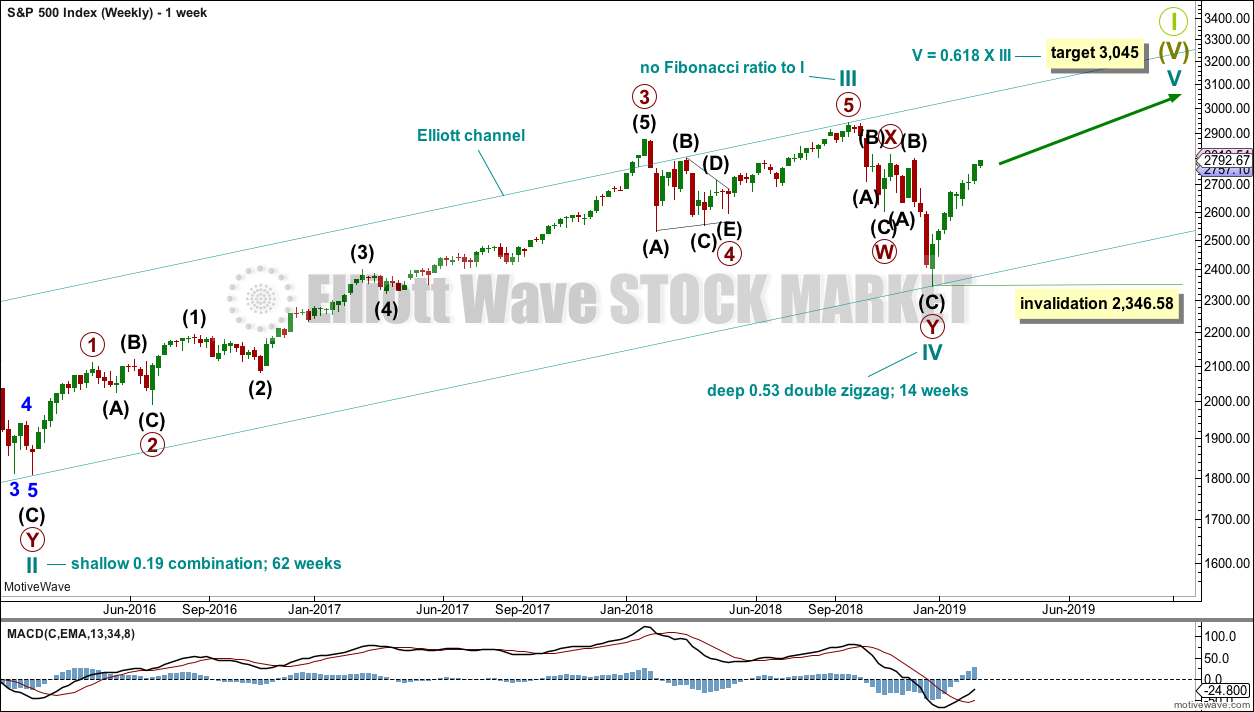
This weekly chart shows all of cycle waves III, IV and V so far.
Cycle wave II fits as a time consuming double combination: flat – X – zigzag. Combinations tend to be more time consuming corrective structures than zigzags. Cycle wave IV has completed as a multiple zigzag that should be expected to be more brief than cycle wave II.
Cycle wave IV may have ended at the lower edge of the Elliott channel.
Within cycle wave V, no second wave correction may move beyond the start of its first wave below 2,346.58.
Although both cycle waves II and IV are labelled W-X-Y, they are different corrective structures. There are two broad groups of Elliott wave corrective structures: the zigzag family, which are sharp corrections, and all the rest, which are sideways corrections. Multiple zigzags belong to the zigzag family and combinations belong to the sideways family. There is perfect alternation between the possible double zigzag of cycle wave IV and the combination of cycle wave II.
Although there is gross disproportion between the duration of cycle waves II and IV, the size of cycle wave IV in terms of price makes these two corrections look like they should be labelled at the same degree. Proportion is a function of either or both of price and time.
Draw the Elliott channel about Super Cycle wave (V) with the first trend line from the end of cycle wave I (at 2,079.46 on the week beginning 30th November 2014) to the high of cycle wave III, then place a parallel copy on the low of cycle wave II. Cycle wave V may find resistance about the upper edge.
It is possible that cycle wave V may end in October 2019. If it does not end there, or if the AD line makes new all time highs during or after June 2019, then the expectation for cycle wave V to end would be pushed out to March 2020 as the next possibility. Thereafter, the next possibility may be October 2020.
DAILY CHART

Click chart to enlarge.
The daily chart will focus on the structure of cycle wave V.
Within Super Cycle wave (V), cycle wave III may not be the shortest actionary wave. Because cycle wave III is shorter than cycle wave I, this limits cycle wave V to no longer than equality in length with cycle wave III at 3,477.39. A target is calculated for cycle wave V to end prior to this point.
Cycle wave V must subdivide as a five wave motive structure, either an impulse or an ending diagonal. An impulse is much more common and that will be how it is labelled. A diagonal would be considered if overlapping suggests it.
Primary wave 1 is labelled as incomplete.
An Elliott channel is drawn about the impulse of primary wave 1. This channel will now be used to indicate when primary wave 1 is complete and primary wave 2 has begun. When a full daily candlestick prints below the lower edge of the channel and not touching the lower edge, that may be taken as confirmation of a trend change. Assume the trend remains the same, upwards, while price remains within the channel.
Primary wave 2 may not move beyond the start of primary wave 1 below 2,346.58.
ALTERNATE MONTHLY CHART
Click chart to enlarge.
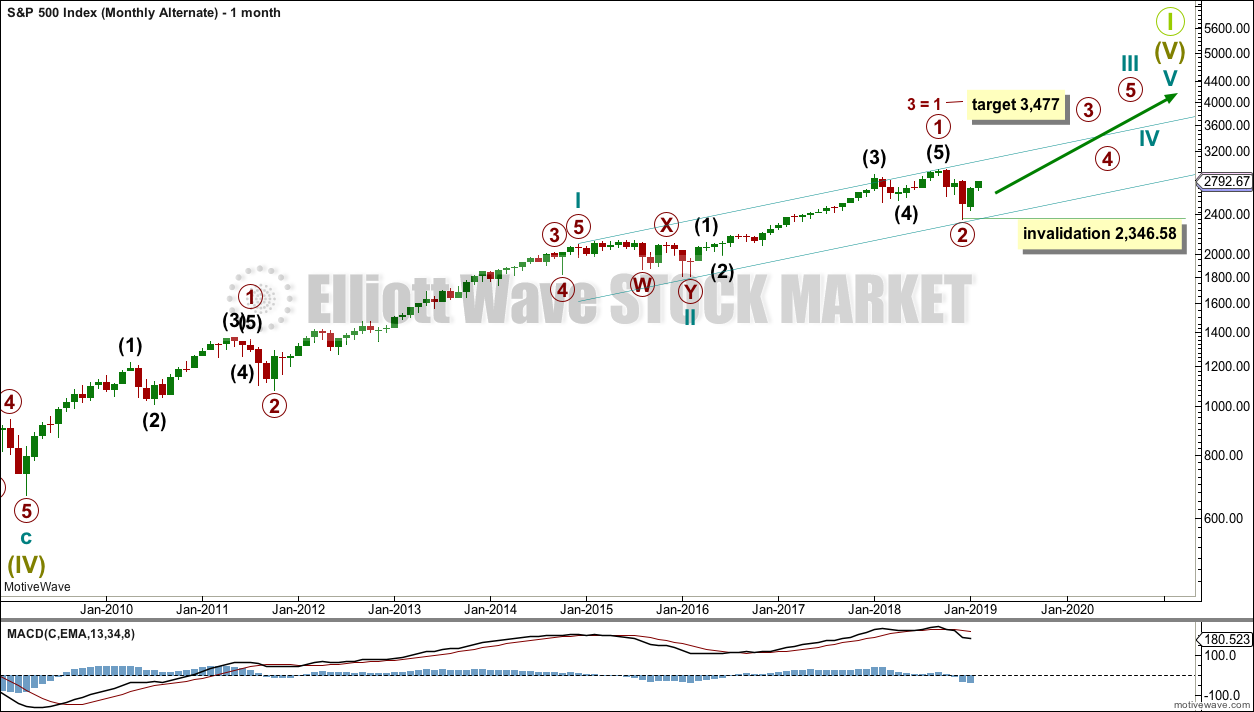
It is time to consider a more bullish wave count because the AD line is making new all time highs and the end of this bull market now would be extremely likely to be a bare minimum of 4 months away, and likely longer.
If the degree of labelling is moved down within cycle wave III, then it is possible that the last high was only primary wave 1. Cycle wave III may be extending.
Only two actionary waves within an impulse may extend. Cycle wave I was extended. If cycle wave III also extends, then cycle wave V may not extend.
A target is calculated for primary wave 3 to end. If price gets up to this target and the structure is incomplete, or if price keeps rising through the target, then a new higher target would then be calculated.
Within primary wave 3, no second wave correction may move beyond the start of its first wave below 2,346.58.
This wave count expects MACD to indicate stronger momentum as price makes a new all time high. If that happens, then this may be switched to be the main wave count.
TECHNICAL ANALYSIS
WEEKLY CHART
Click chart to enlarge. Chart courtesy of StockCharts.com.
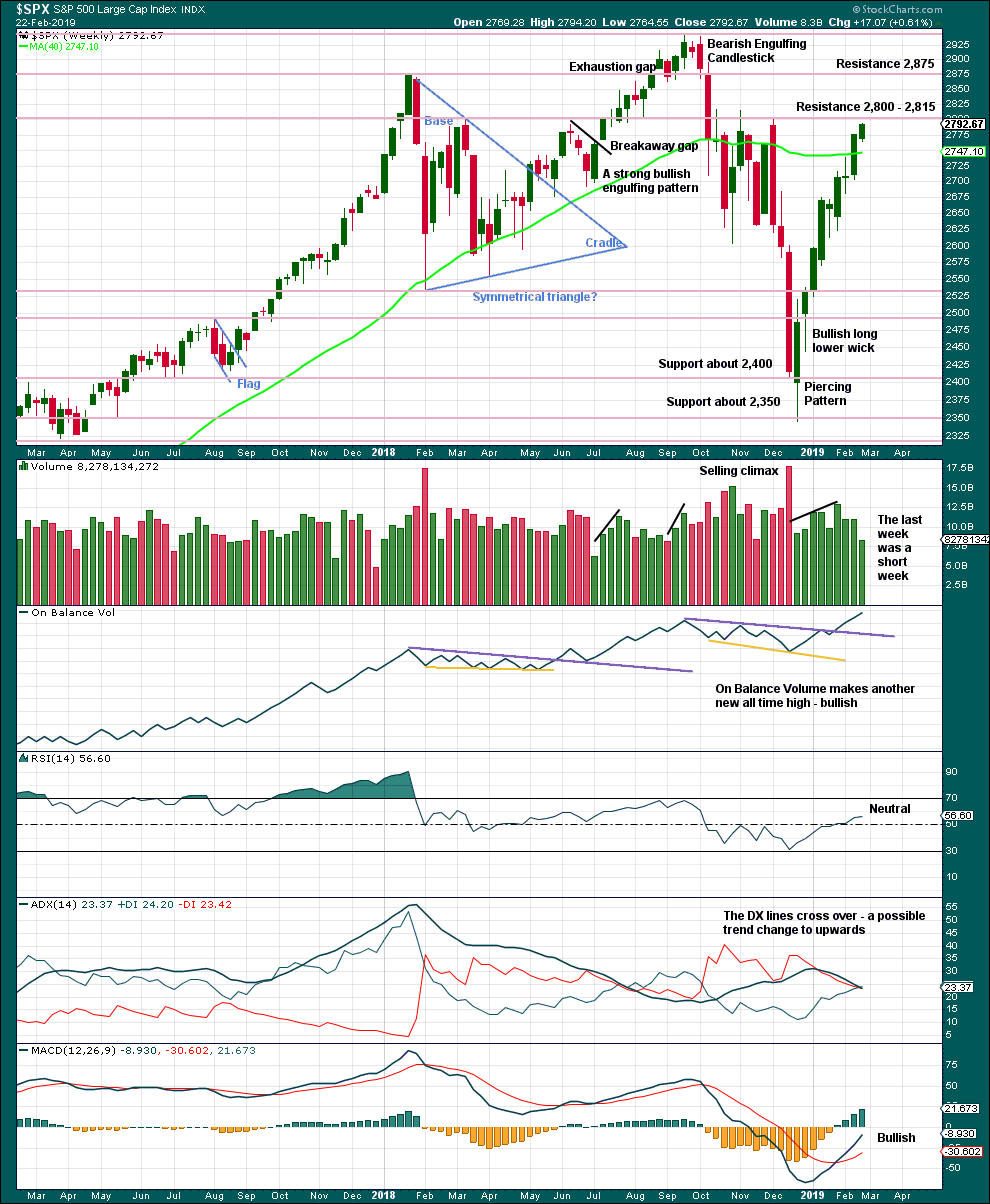
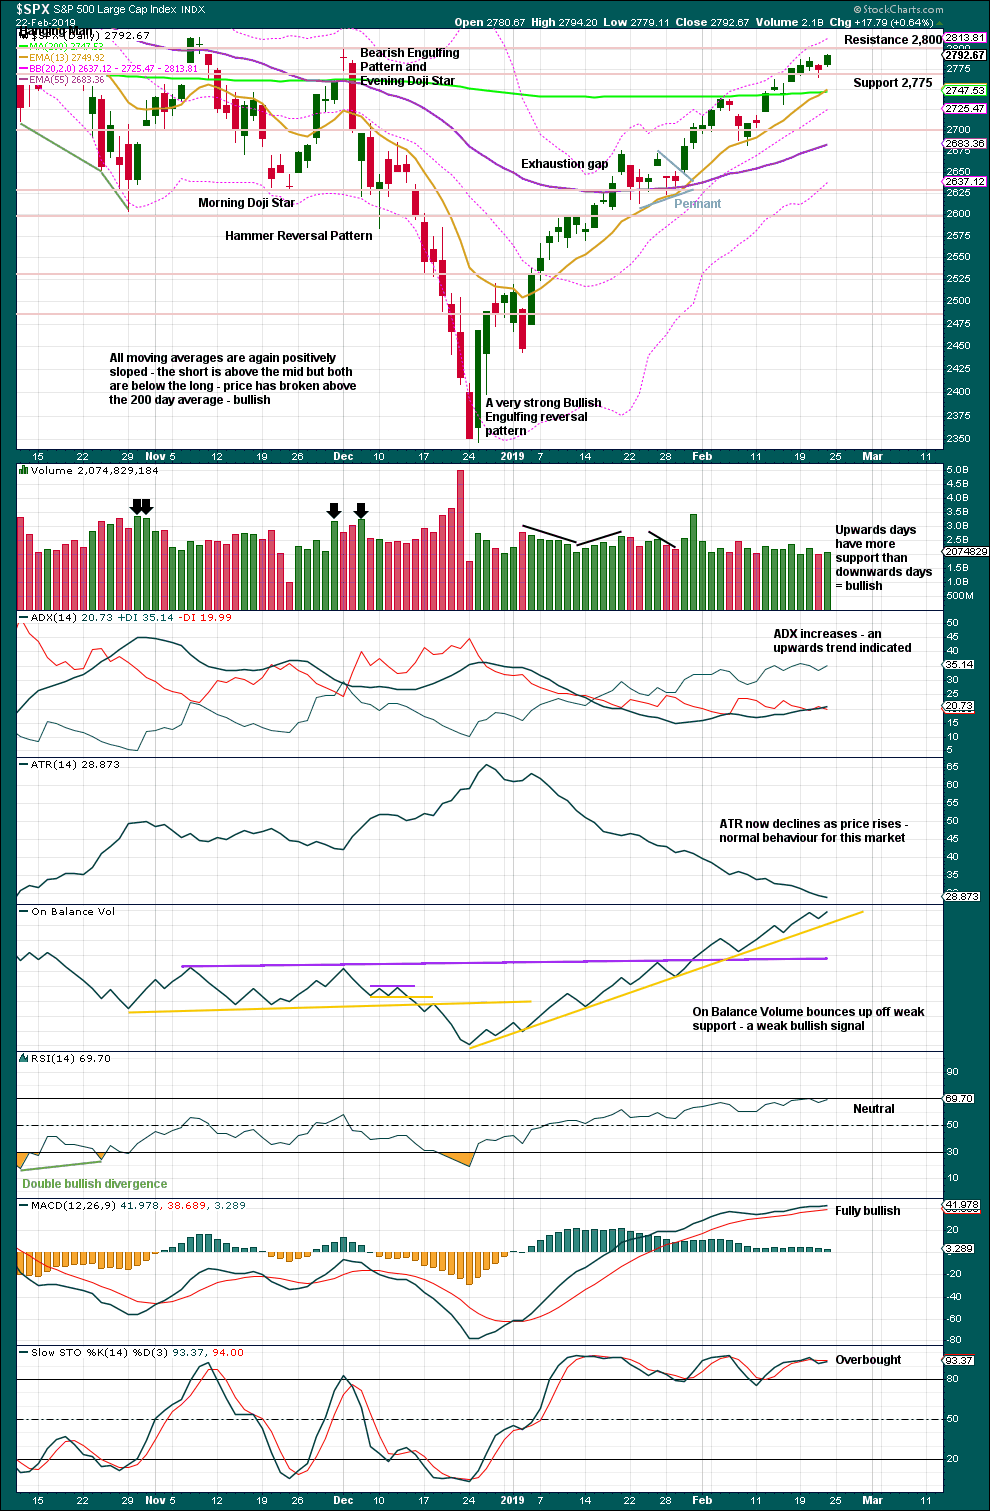
Because this week consisted of only four trading days, the decline in volume may not be necessarily bearish. It is necessary this week to look inside the week at daily volume bars to judge the volume profile.
Overall, this chart is bullish and supports the Elliott wave count.
DAILY CHART
Click chart to enlarge. Chart courtesy of StockCharts.com.
Over a fairly long period of time this ageing bull market has been characterised by upwards movement on light and declining volume and low ATR. For the short to mid term, little concern may be had if price now rises again on declining volume. Current market conditions have allowed for this during a sustained rise in price.
It is also normal for this market to have lower ATR during bullish phases, and strongly increasing ATR during bearish phases. Currently, declining ATR is normal and not of a concern.
Considering the larger picture from the Elliott wave count, some weakness approaching the end of Grand Super Cycle wave I is to be expected.
From Kirkpatrick and Dhalquist, “Technical Analysis” page 152:
“A 90% downside day occurs when on a particular day, the percentage of downside volume exceeds the total of upside and downside volume by 90% and the percentage of downside points exceeds the total of gained points and lost points by 90%. A 90% upside day occurs when both the upside volume and points gained are 90% of their respective totals”…
and “A major reversal is singled when an NPDD is followed by a 90% upside day or two 80% upside days back-to-back”.
The current situation saw two 80% downside days on December 20th and 21st, then a near 90% downside day with 88.97% downside on December 24th. This very heavy selling pressure on three sessions together may be sufficient to exhibit the pressure observed in a 90% downside day.
This has now been followed by two 90% upside days: on December 26th and again on 4th January.
The current situation looks very much like a major low has been found.
This chart is overall very bullish. Only the moving averages are not yet full bore bullish.
Look out though for strong resistance here about 2,800 to 2,815. How price behaves in this zone may indicate whether or not a deeper pullback may begin.
This upwards trend continues to have support from rising buying power and falling selling pressure. This trend looks strong and healthy.
BREADTH – AD LINE
WEEKLY CHART
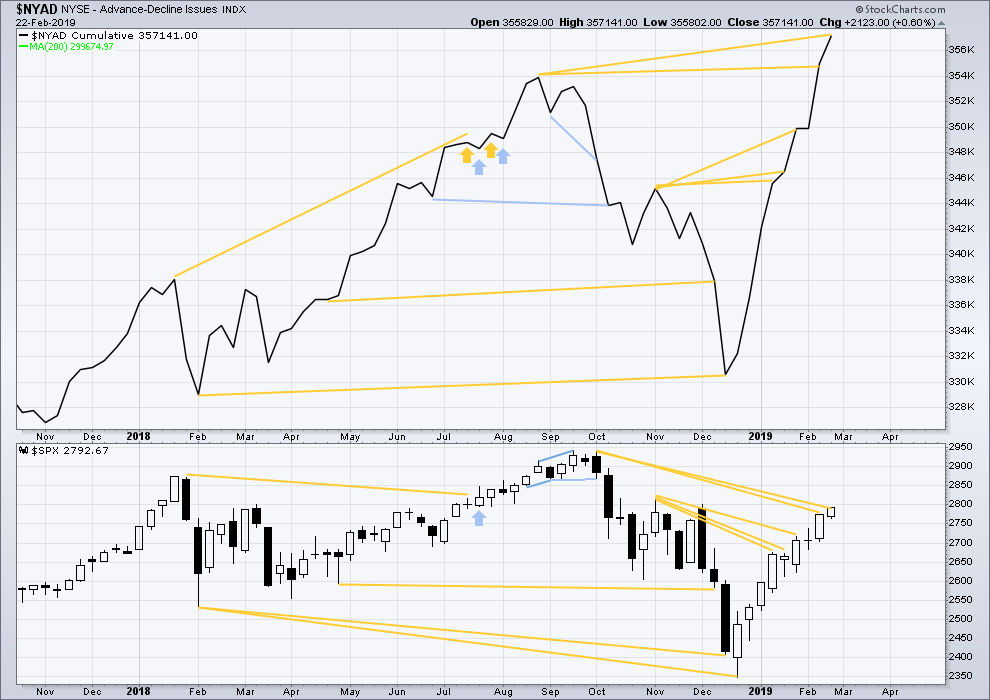
Click chart to enlarge. Chart courtesy of StockCharts.com. So that colour blind members are included, bearish signals
will be noted with blue and bullish signals with yellow.
Every single bear market from the Great Depression and onwards has been preceded by a minimum of 4-6 months divergence between price and the AD line. With the AD line making a new all time high again this week, the end of this bull market and the start of a new bear market must be a minimum of 4 months away, which is mid to end June 2019 at this time.
DAILY CHART
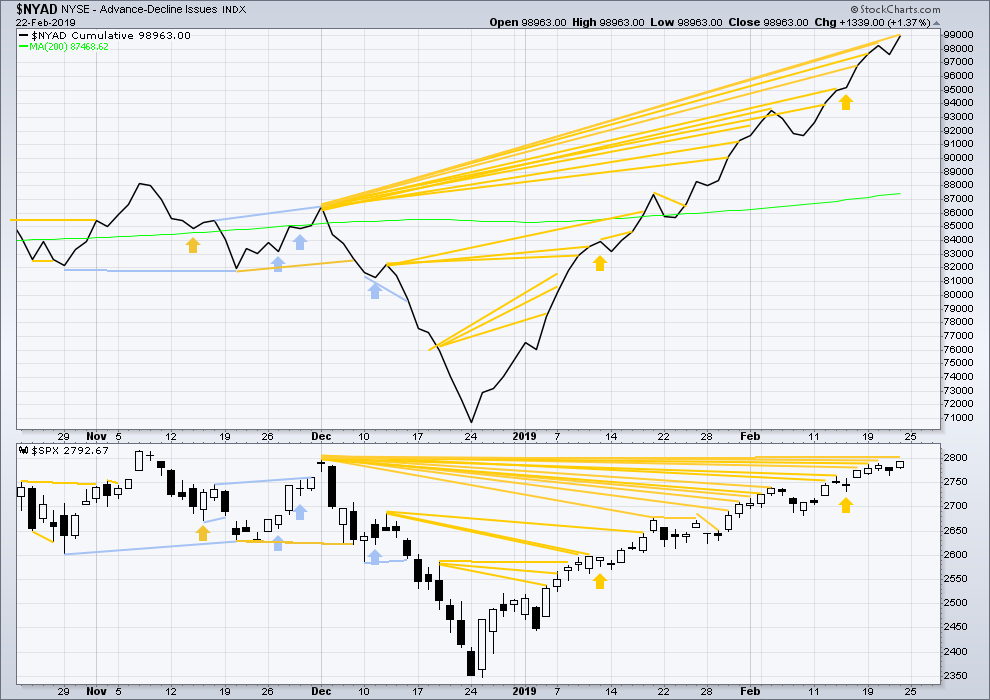
Click chart to enlarge. Chart courtesy of StockCharts.com. So that colour blind members are included, bearish signals
will be noted with blue and bullish signals with yellow.
Breadth should be read as a leading indicator.
There is now a cluster of bullish signals from the AD line. This supports the Elliott wave count.
The AD line is making new highs above the prior high of the 3rd of December, but price is not. This divergence continues and is bullish.
VOLATILITY – INVERTED VIX CHART
WEEKLY CHART
Click chart to enlarge. Chart courtesy of StockCharts.com. So that colour blind members are included, bearish signals
will be noted with blue and bullish signals with yellow.
Inverted VIX has made a new high above the prior swing high of the week beginning 5th of November 2018, but price has not. This divergence is bullish for the mid term.
DAILY CHART
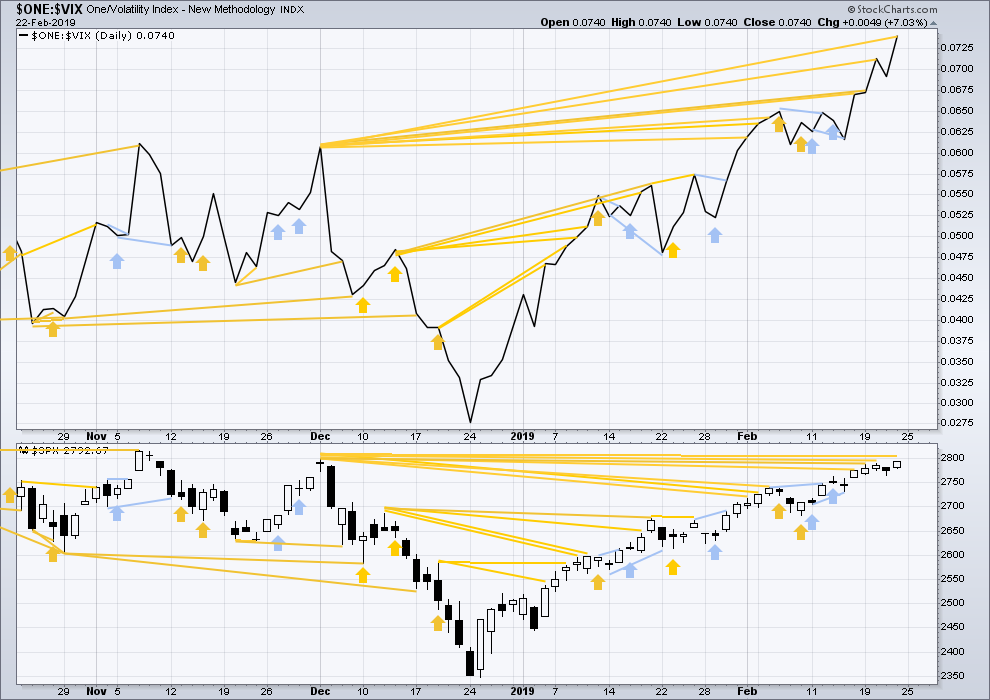
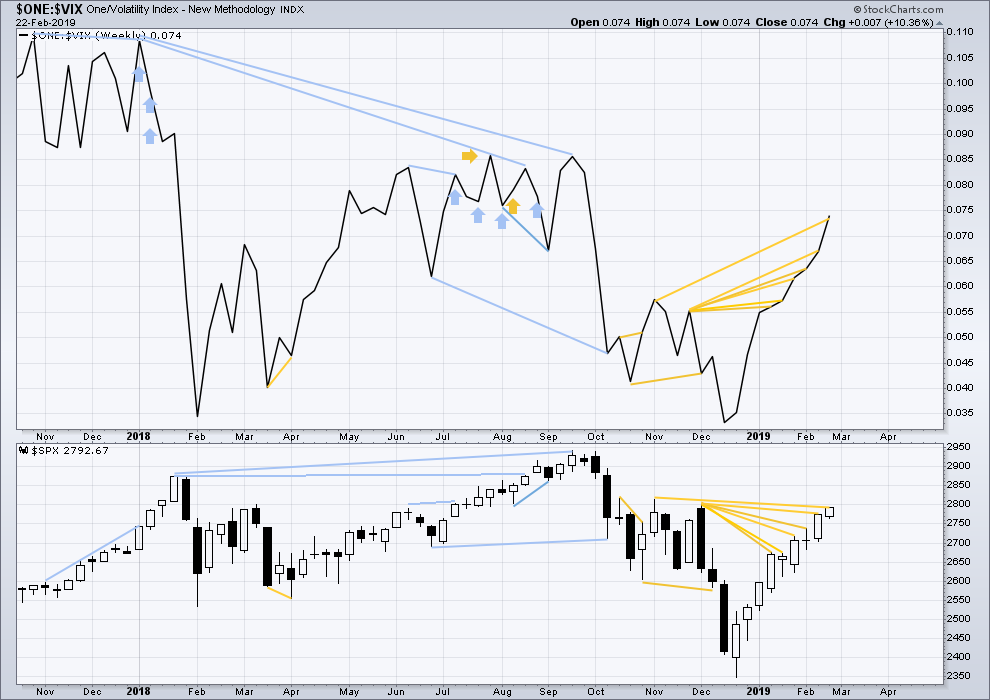
Click chart to enlarge. Chart courtesy of StockCharts.com. So that colour blind members are included, bearish signals
will be noted with blue and bullish signals with yellow.
There is now a cluster of bullish signals from inverted VIX that support the Elliott wave count.
Inverted VIX has made another new high above the prior swing high of the 3rd of December 2018, but price has not. This divergence continues and is bullish.
DOW THEORY
Dow Theory confirms a bear market. This does not necessarily mean a bear market at Grand Super Cycle degree though; Dow Theory makes no comment on Elliott wave counts. On the 25th of August 2015 Dow Theory also confirmed a bear market. The Elliott wave count sees that as part of cycle wave II. After Dow Theory confirmation of a bear market in August 2015, price went on to make new all time highs and the bull market continued.
DJIA: 23,344.52 – a close on the 19th of December at 23,284.97 confirms a bear market.
DJT: 9,806.79 – price has closed below this point on the 13th of December.
S&P500: 2,532.69 – a close on the 19th of December at 2,506.96 provides support to a bear market conclusion.
Nasdaq: 6,630.67 – a close on the 19th of December at 6,618.86 provides support to a bear market conclusion.
With all the indices moving now higher, Dow Theory would confirm a bull market if the following highs are made:
DJIA: 26,951.81
DJT: 11,623.58
S&P500: 2,940.91
Nasdaq: 8,133.30.
GOLD
A small range inside day sees the Elliott wave count remain the same. At the end of this week, classic analysis now supports the Elliott wave count.
Summary: Both a Shooting Star on the weekly chart and an Evening Star on the daily chart indicate a high may be in place. Next, a close below support at 1,300 and a breach of the blue channel on the daily chart are required for confidence in the preferred Elliott wave count.
Expect a trend change here to either down or sideways.
Grand SuperCycle analysis is here.
Last historic analysis with monthly charts is here.
MAIN ELLIOTT WAVE COUNT
WEEKLY CHART – TRIANGLE
Click chart to enlarge.
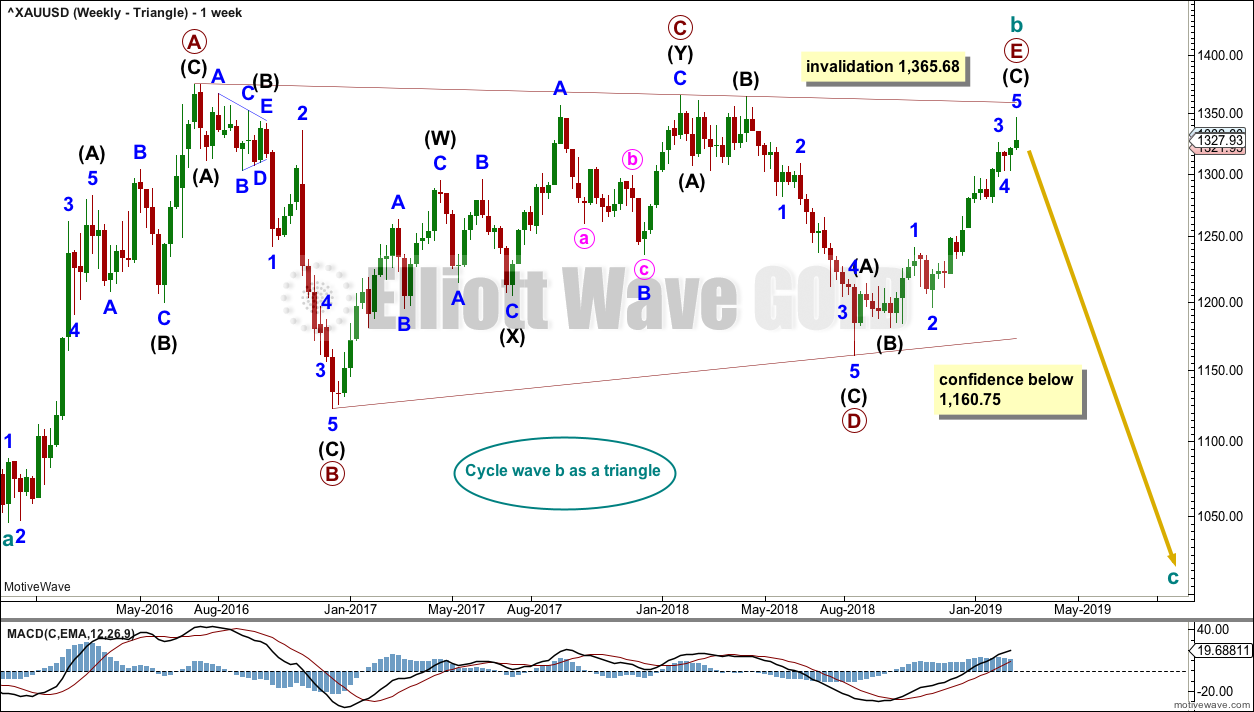
This is the preferred wave count.
Cycle wave b may be a complete regular contracting triangle. If it continues further, then primary wave E may not move beyond the end of primary wave C above 1,365.68.
Within primary wave E, intermediate waves (A) and (B) may be complete. Intermediate wave (C) must subdivide as a five wave structure.
Four of the five sub-waves of a triangle must be zigzags, with only one sub-wave allowed to be a multiple zigzag. Wave C is the most common sub-wave to subdivide as a multiple, and this is how primary wave C for this example fits best. Primary wave E looks like it is unfolding as a single zigzag.
There are no problems in terms of subdivisions or rare structures for this wave count. It has an excellent fit and so far a typical look.
This wave count would expect a cycle degree trend change has just occurred. Cycle wave c would most likely make new lows below the end of cycle wave a at 1,046.27 to avoid a truncation.
Primary wave E should exhibit reasonable weakness as it comes to an end. Triangles often end with declining ATR, weak momentum and weak volume.
If this weekly wave count is correct, then cycle wave c downwards should develop strength, ATR should show some increase, and MACD should exhibit an increase in downwards momentum.
DAILY CHART – TRIANGLE
Click chart to enlarge.
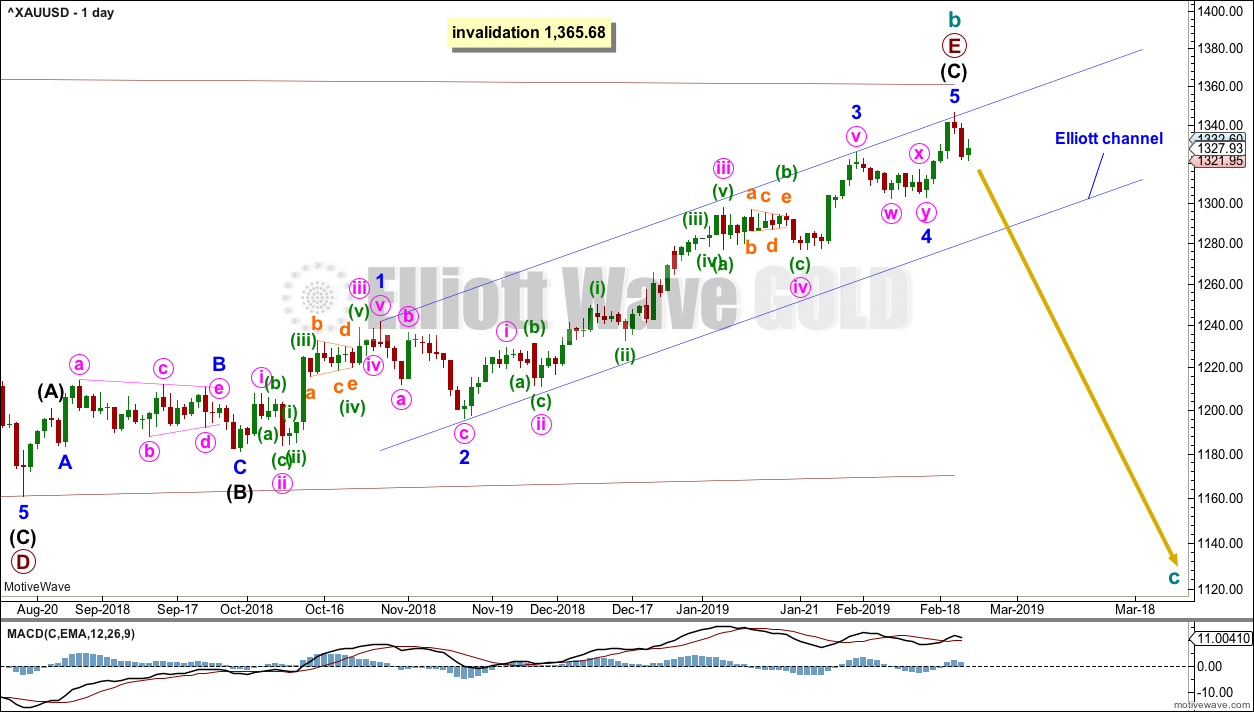
Primary wave E should subdivide as a zigzag. Intermediate waves (A) and (B) may now be complete. Intermediate wave (C) may again be complete, and there is some indication of a high in place.
This wave count now requires a trend change here or very soon indeed. The remaining two things are now required for confidence in this wave count:
1. A new low below support at 1,300.
2. A breach of the blue channel.
WEEKLY CHART – DOUBLE ZIGZAG
Click chart to enlarge.
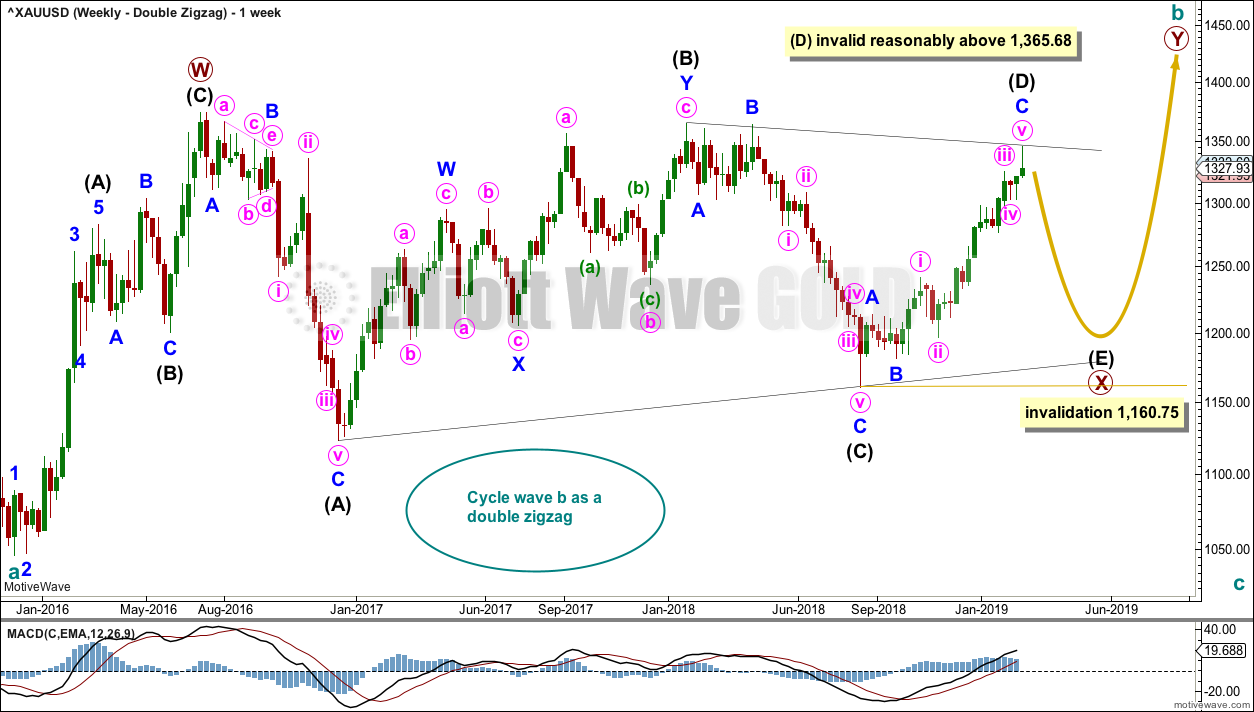
It is possible that cycle wave b may be a double zigzag or a double combination.
The first zigzag in the double is labelled primary wave W. This has a good fit.
The double may be joined by a corrective structure in the opposite direction, a triangle labelled primary wave X. The triangle would be about four fifths complete.
Within multiples, X waves are almost always zigzags and rarely triangles. Within the possible triangle of primary wave X, it is intermediate wave (B) that is a multiple; this is acceptable, but note this is not the most common triangle sub-wave to subdivide as a multiple. These two points reduce the probability of this wave count.
Intermediate wave (D) may be complete. The (B)-(D) trend line is almost perfectly adhered to with the smallest overshoot within intermediate wave (C). This is acceptable.
Intermediate wave (E) should continue to exhibit weakness: ATR should continue to show a steady decline, and MACD may begin to hover about zero.
Intermediate wave (E) may not move beyond the end of intermediate wave (C) below 1,160.75.
This wave count may now expect downwards movement for several weeks.
Primary wave Y would most likely be a zigzag because primary wave X would be shallow; double zigzags normally have relatively shallow X waves.
Primary wave Y may also be a flat correction if cycle wave b is a double combination, but combinations normally have deep X waves. This would be less likely.
This wave count has good proportions and no problems in terms of subdivisions.
WEEKLY CHART – ALTERNATE BULLISH
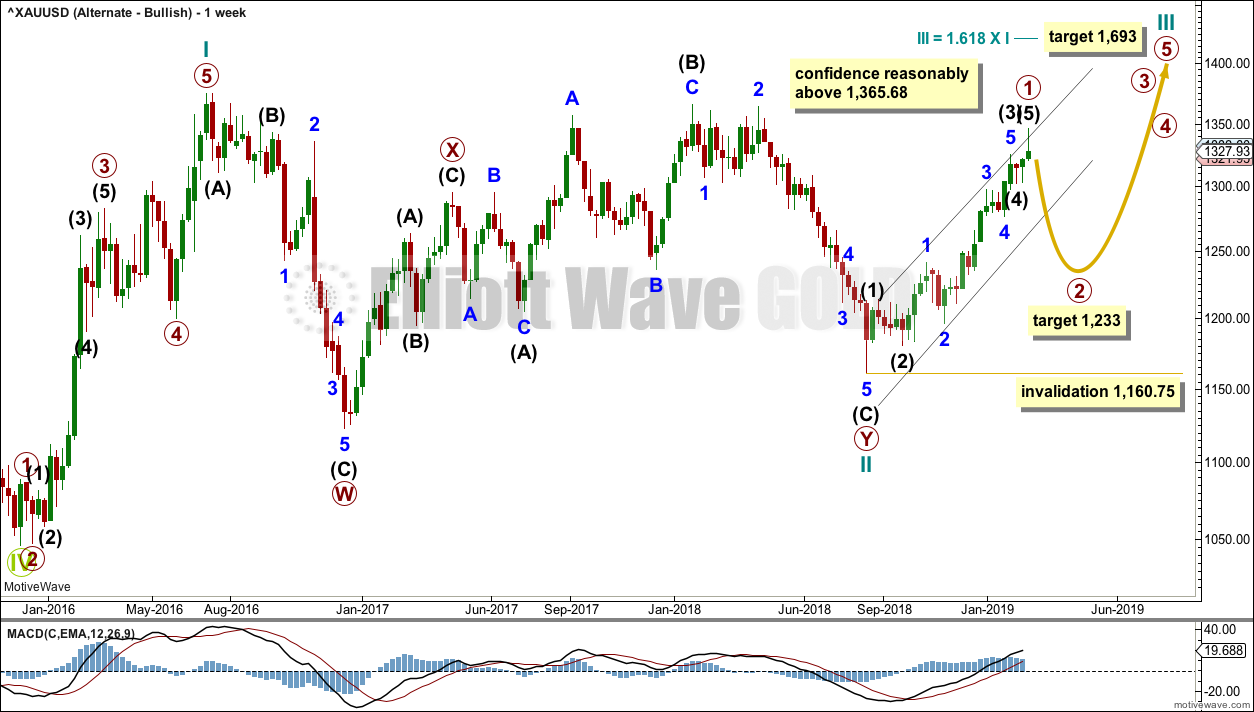
Click chart to enlarge.
Because the preferred wave count is at a critical juncture in expecting a cycle degree trend change, it is time to consider an alternate which expects the continuation of the current upwards trend.
It is possible that the low in December 2015 was the end of a bear market and that Gold has been in a basing action for the past three years. Downwards movement to that low will subdivide as a double zigzag, a corrective structure.
If Gold is in a new bull market, then it should begin with a five wave structure upwards on the weekly chart. However, the biggest problem with this wave count is the structure labelled cycle wave I because this wave count must see it as a five wave structure, but it looks more like a three wave structure.
Commodities often exhibit swift strong fifth waves that force the fourth wave corrections coming just prior to be more brief and shallow than their counterpart second waves. It is unusual for a commodity to exhibit a quick second wave and a more time consuming fourth wave, and this is how cycle wave I is labelled. The probability of this wave count is low due to this problem.
Cycle wave II subdivides well as a double combination: zigzag – X – expanded flat.
Cycle wave III may have begun. Within cycle wave III, primary wave 1 may now be complete. The target for primary wave 2 is the 0.618 Fibonacci ratio of primary wave 1. Primary wave 2 may not move beyond the start of primary wave 1 below 1,160.75.
A black channel is drawn about primary wave 1. Primary wave 2 may breach the lower edge of this channel.
Cycle wave III so far for this wave count would have been underway now for 27 weeks. It should be beginning to exhibit some support from volume, increase in upwards momentum and increasing ATR. However, volume continues to decline, ATR continues to decline and is very low, and momentum is weak in comparison to cycle wave I. This wave count lacks support from classic technical analysis.
TECHNICAL ANALYSIS
WEEKLY CHART
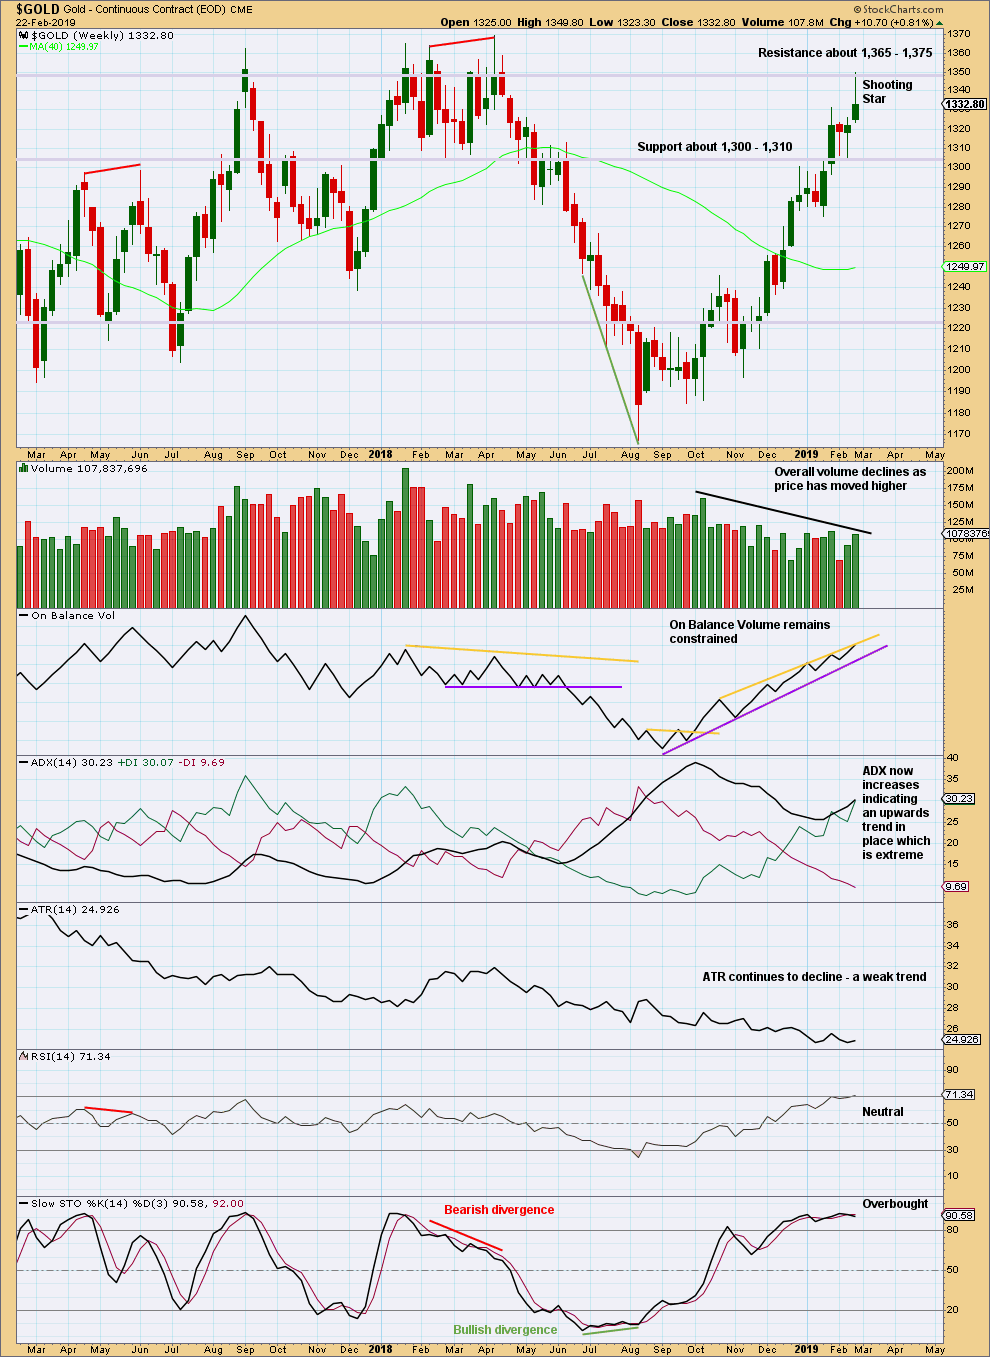
Click chart to enlarge. Chart courtesy of StockCharts.com.
This week’s upper candlestick wick is 2.18 times the length of the real body. This fits the requirements for a star pattern (the wick needs to be a minimum of twice the length of the real body). Shooting Star candlestick patterns appearing within an upwards trend are bearish reversal patterns.
The longer-term volume profile is bearish, but the short-term volume profile is bullish. On balance my judgement is that the volume profile is more bearish than bullish.
This chart warns that a high may be in place.
DAILY CHART
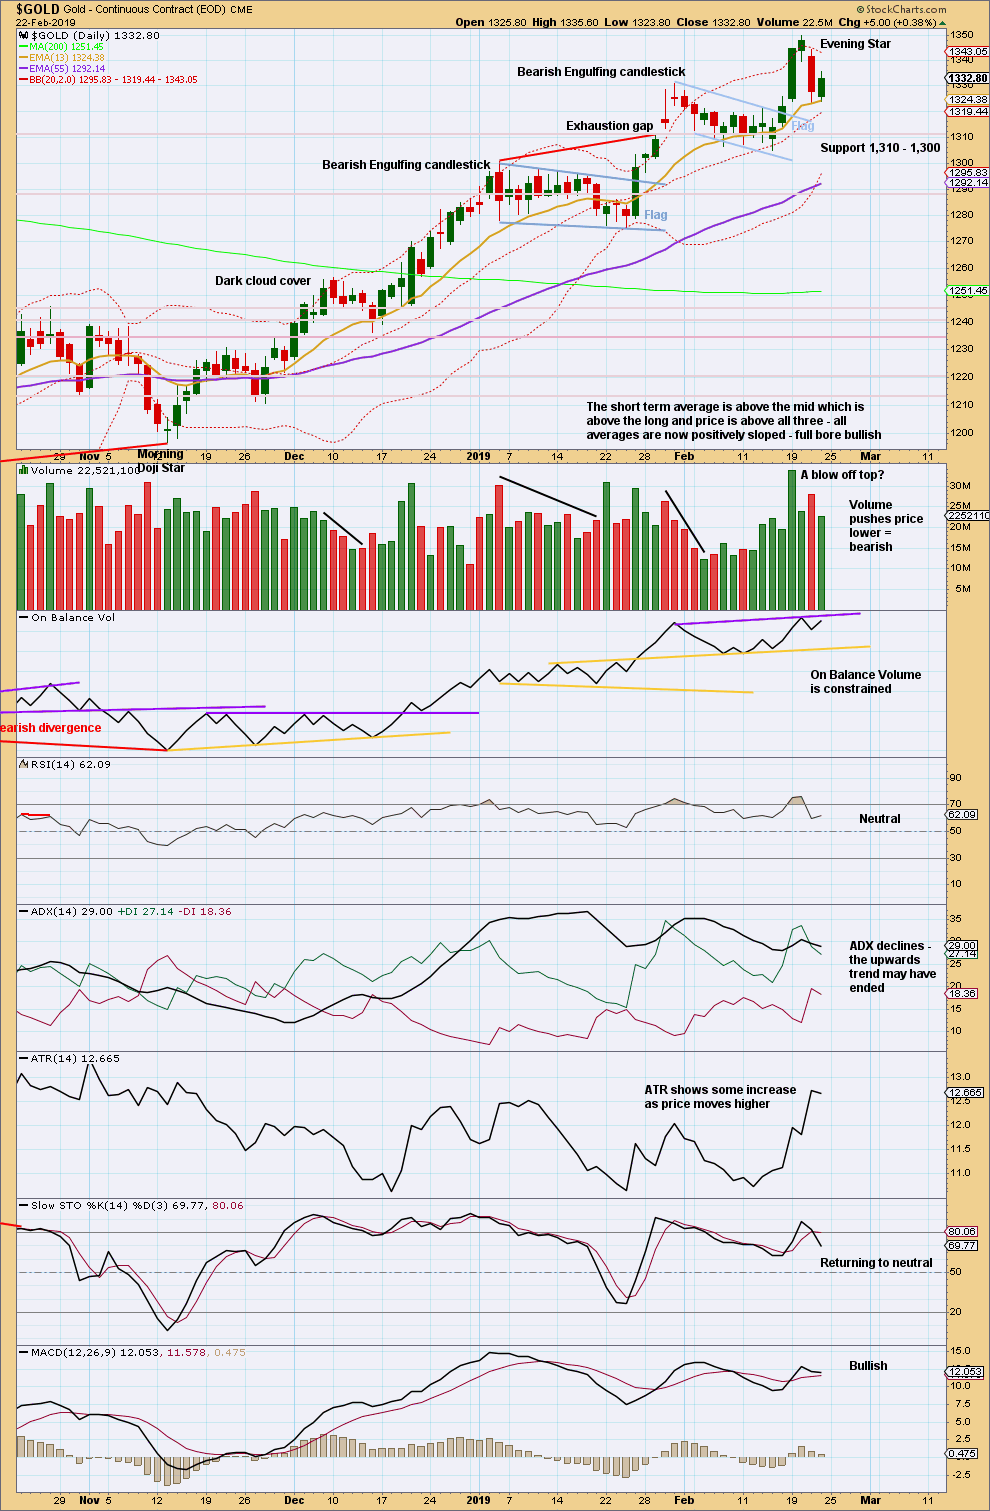
Click chart to enlarge. Chart courtesy of StockCharts.com.
The Evening Star reversal pattern indicates a trend change here to either down or sideways. The target calculated from the last flag pattern should now not be expected to be met.
The short-term volume profile is bearish. ADX suggests the upwards trend may be over. This chart offers some support to the Elliott wave analysis.
GDX WEEKLY CHART
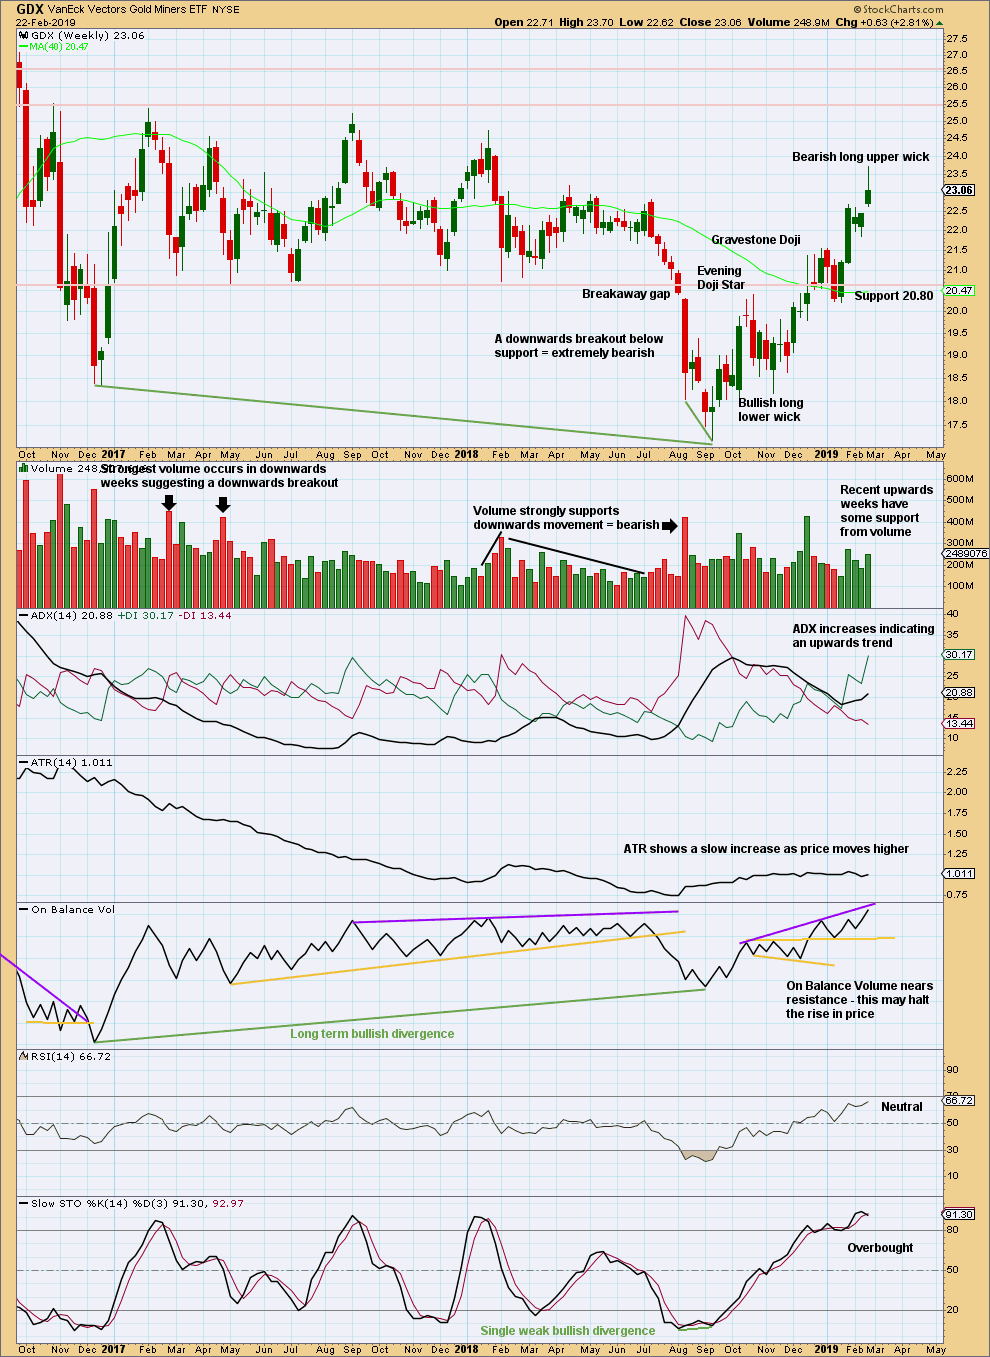
Click chart to enlarge. Chart courtesy of StockCharts.com.
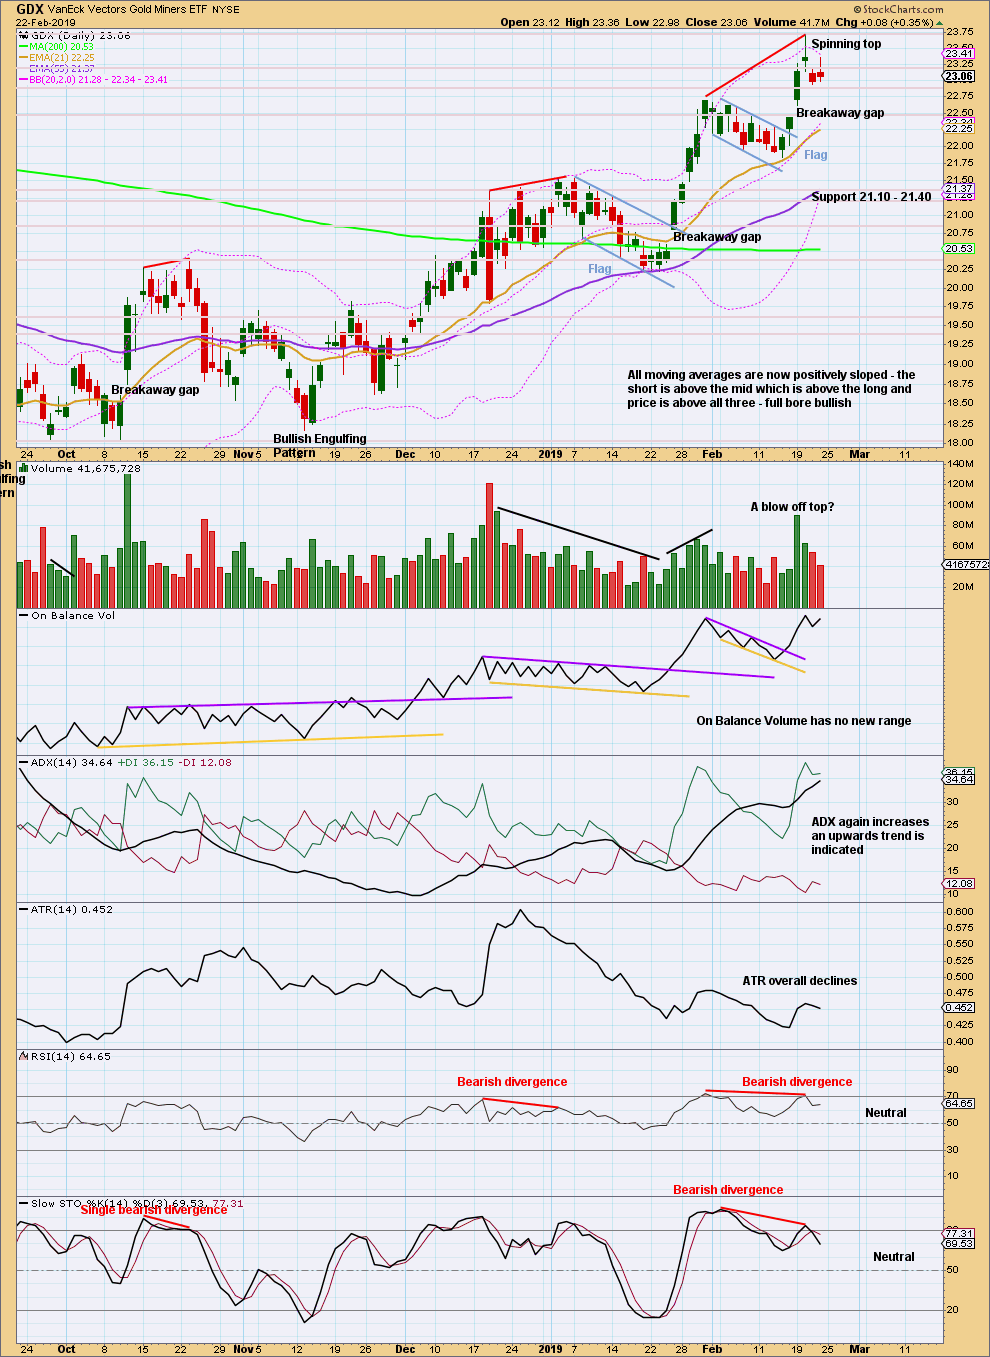
This week’s candlestick for GDX is not a Shooting Star pattern. The upper wick at 1.83 times the real body is less than the required length of 2. However, the long upper wick still carries a bearish implication.
At this time frame there is as yet no evidence this trend is over. This view may be held while the last gap remains open if price does not make a new low below 22.44.
GDX DAILY CHART
Click chart to enlarge. Chart courtesy of StockCharts.com.
The target from the last flag pattern is calculated at 24.65.
Breakaway gaps may be used in trading. In an upwards trend, breakaway gaps should remain open. The lower edge of this gap may be used to pull up stops to 22.44 to protect profits.
Assume the pullback here may be a brief interruption to the trend while the gap remains open at 22.44.
GDX does not exhibit a candlestick reversal pattern.
If the gap is closed, it would then be relabelled an exhaustion gap and the probability of a trend change would increase.
US OIL
Last end of week analysis for US Oil expected this week to see the upwards bounce continue towards the target. This is exactly what has happened. The small target zone remains unchanged this week.
Summary: The upwards bounce may continue to the final target zone about 63.19 to 63.71. This target may be met in another three to five weeks.
However, there is now reasonable weakness in upwards movement, and it shows some weakness. Look out for a possible earlier than expected end to this bounce. If a candlestick reversal pattern is printed, or price breaks below the blue channel on the daily Elliott wave chart, then assume a third wave down has just begun.
The larger picture still sees Oil in a new downwards trend to end reasonably below 26.06.
MAIN ELLIOTT WAVE COUNT
MONTHLY CHART
Click chart to enlarge.
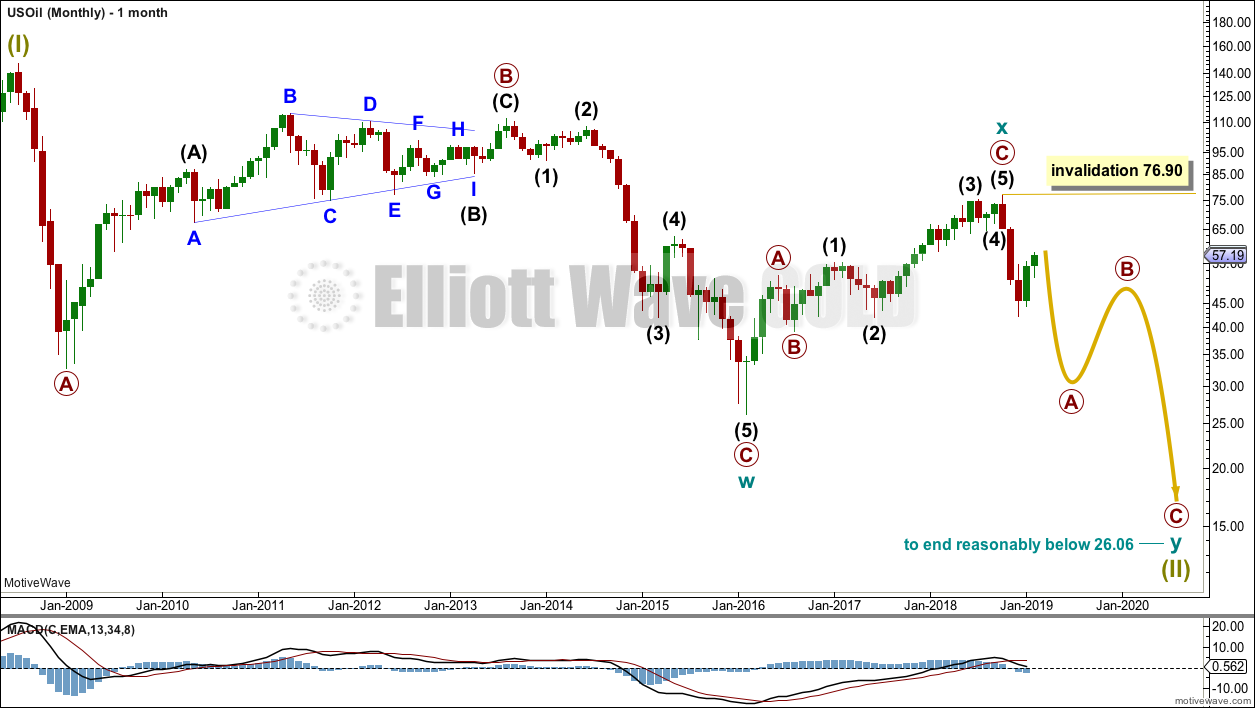
Classic technical analysis favours a bearish wave count for Oil at this time.
The large fall in price from the high in June 2008 to February 2016 is seen as a complete three wave structure. This large zigzag may have been only the first zigzag in a deeper double zigzag.
The first zigzag down is labelled cycle wave w. The double is joined by a now complete three in the opposite direction, a zigzag labelled cycle wave x.
The purpose of a second zigzag in a double is to deepen the correction when the first zigzag does not move price deep enough. Cycle wave y would be expected to move reasonably below the end of cycle wave w to deepen the correction. Were cycle wave y to reach equality with cycle wave w that takes Oil into negative price territory, which is not possible. Cycle wave y would reach 0.618 the length of cycle wave w at $2.33.
A better target calculation would be using the Fibonacci ratios between primary waves A and C within cycle wave y. This cannot be done until both primary waves A and B are complete.
Within cycle wave y, no second wave correction nor B wave may move beyond its start above 76.90.
WEEKLY CHART
Click chart to enlarge.
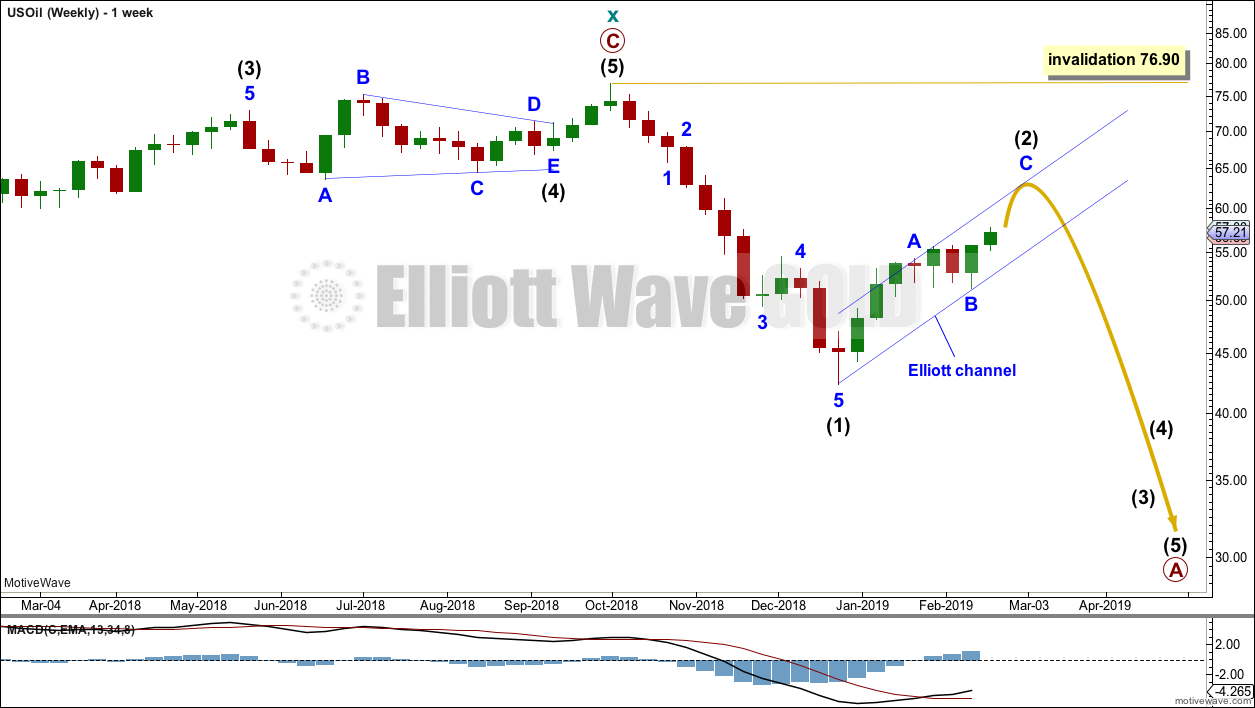
This weekly chart is focussed on the start of cycle wave y.
Cycle wave y is expected to subdivide as a zigzag. A zigzag subdivides 5-3-5. Primary wave A must subdivide as a five wave structure if this wave count is correct.
Within primary wave A, intermediate wave (1) may now be complete. Intermediate wave (2) so far looks like it is unfolding as a zigzag, which is the most common Elliott wave structure for a second wave, and so far it has lasted seven weeks. If it completes in a total Fibonacci thirteen weeks, then it may continue now for a further six weeks. It may however not be as long lasting as that; it may not exhibit a Fibonacci duration.
Intermediate wave (2) may not move beyond the start of intermediate wave (1) above 76.90.
DAILY CHART
Click chart to enlarge.
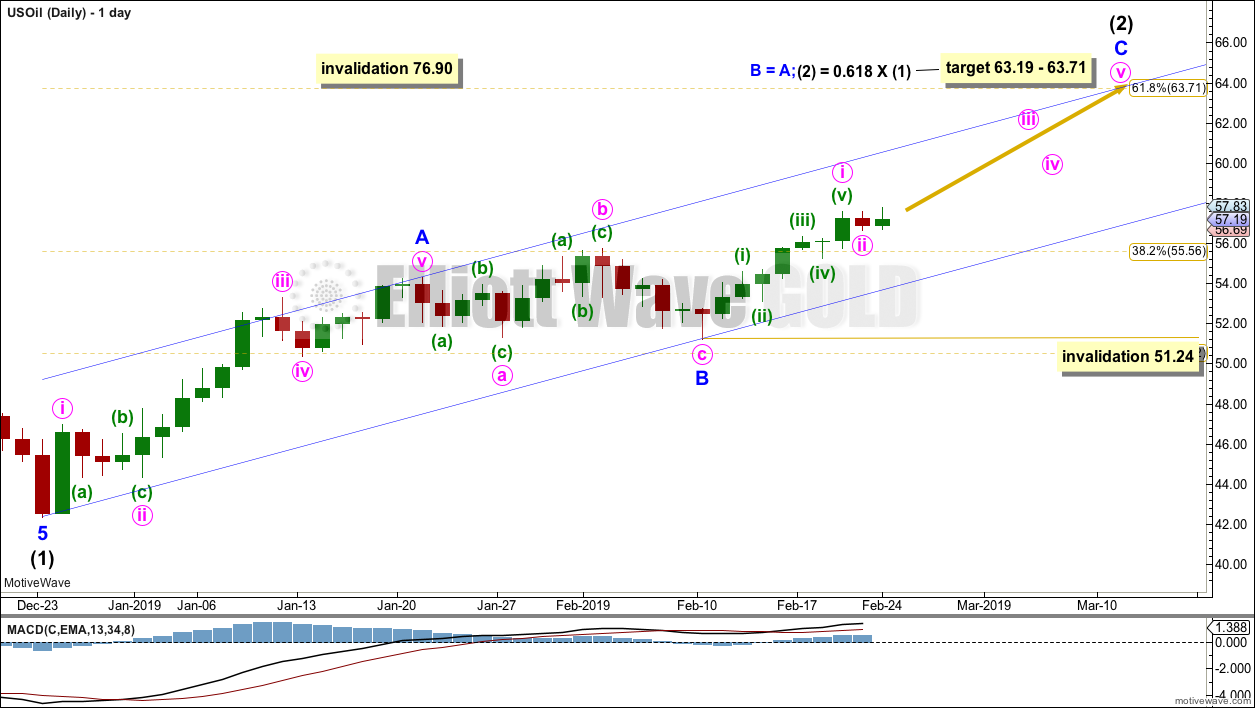
Intermediate wave (2) would most likely subdivide as a zigzag and at this stage that is how it will be labelled, and that is how it looks like it is subdividing. However, it may also subdivide as a flat or combination. It is impossible at this stage to be confident as to which structure it will unfold as. The labelling within it may yet change as it unfolds.
If intermediate wave (2) is unfolding as a zigzag, then within it minor waves A and B may now both be complete.
Another five wave structure upwards for minor wave C may be expected to unfold.
The target is now widened to a small zone calculated at two degrees.
The channel is drawn about intermediate wave (2) using Elliott’s technique for a correction. Any pullbacks along the way up within minor wave C may find support about the lower edge of this channel. Minor wave C may end either mid way within the channel or more likely about the upper edge.
The channel will also be used now to indicate when intermediate wave (2) may possibly be over and intermediate wave (3) downwards may possibly have begun. At this stage, a clear breach of the lower edge of the channel by downwards movement (not sideways) may be taken as the earliest warning that intermediate wave (2) could be over. This may be an indication of a trend change even if the target is not met.
Within minor wave C, minute wave ii may not move beyond the start of minute wave i below 51.24.
Intermediate wave (2) may be very deep.
Intermediate wave (2) may not move beyond the start of intermediate wave (1) above 76.90.
At the end of this week, the alternate wave count is now discarded based upon a very low probability.
TECHNICAL ANALYSIS
MONTHLY CHART
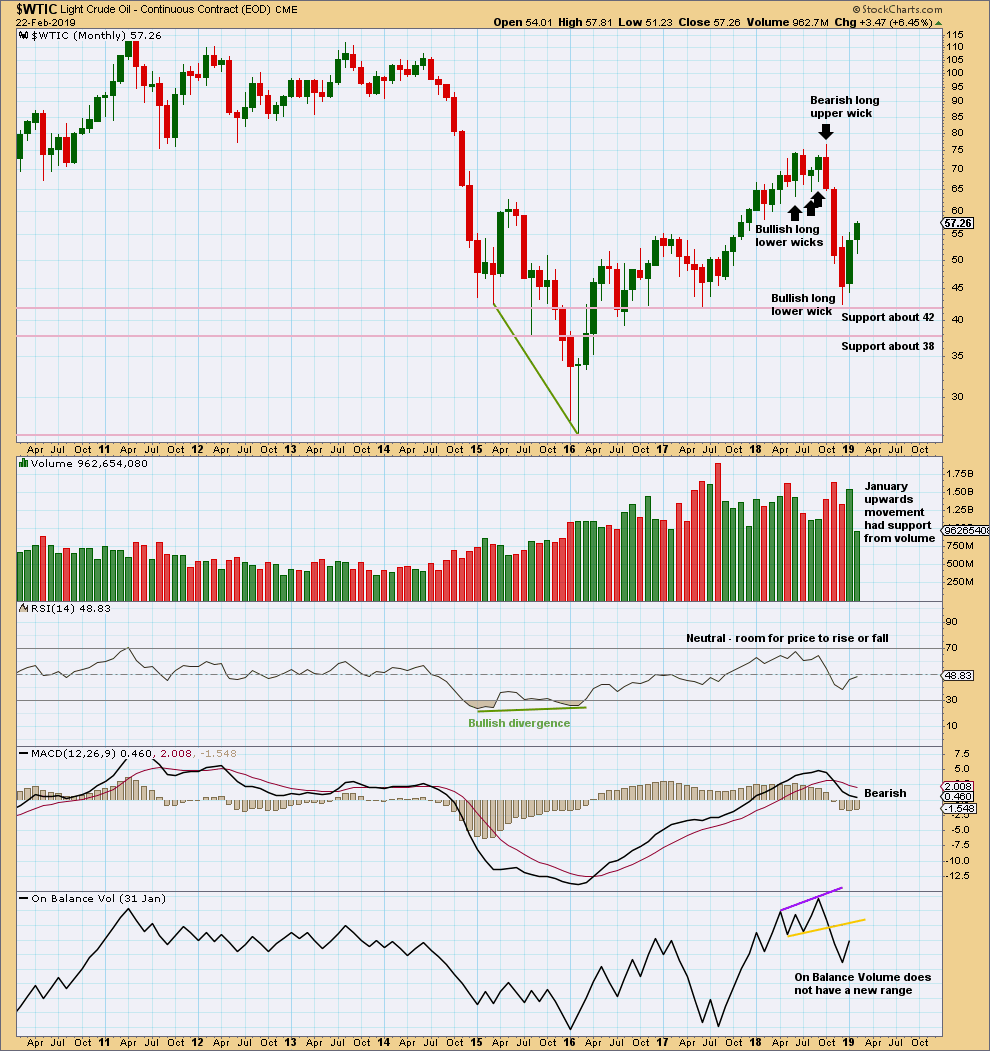
Click chart to enlarge. Chart courtesy of StockCharts.com.
Upwards movement within January has support from volume. This supports the Elliott wave count which expects overall more upwards movement in coming weeks.
WEEKLY CHART
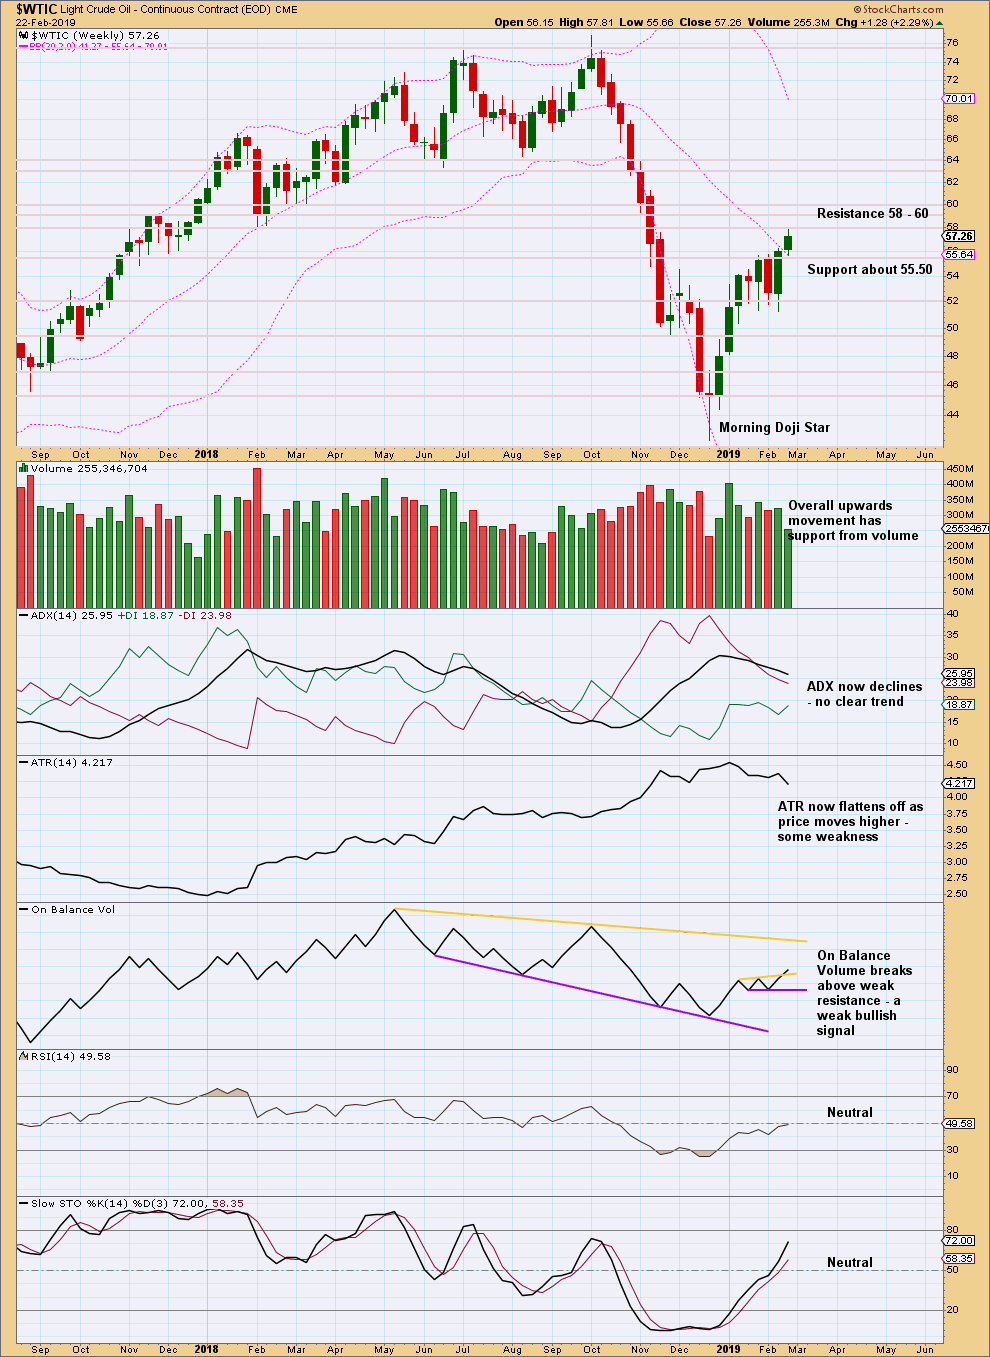
Click chart to enlarge. Chart courtesy of StockCharts.com.
A small range week, which lacks support from volume, sees price close at resistance and this is concerning for bulls. Although there is room for this counter trend bounce to continue until Stochastics reaches overbought, look out for a possible earlier than expected end.
DAILY CHART
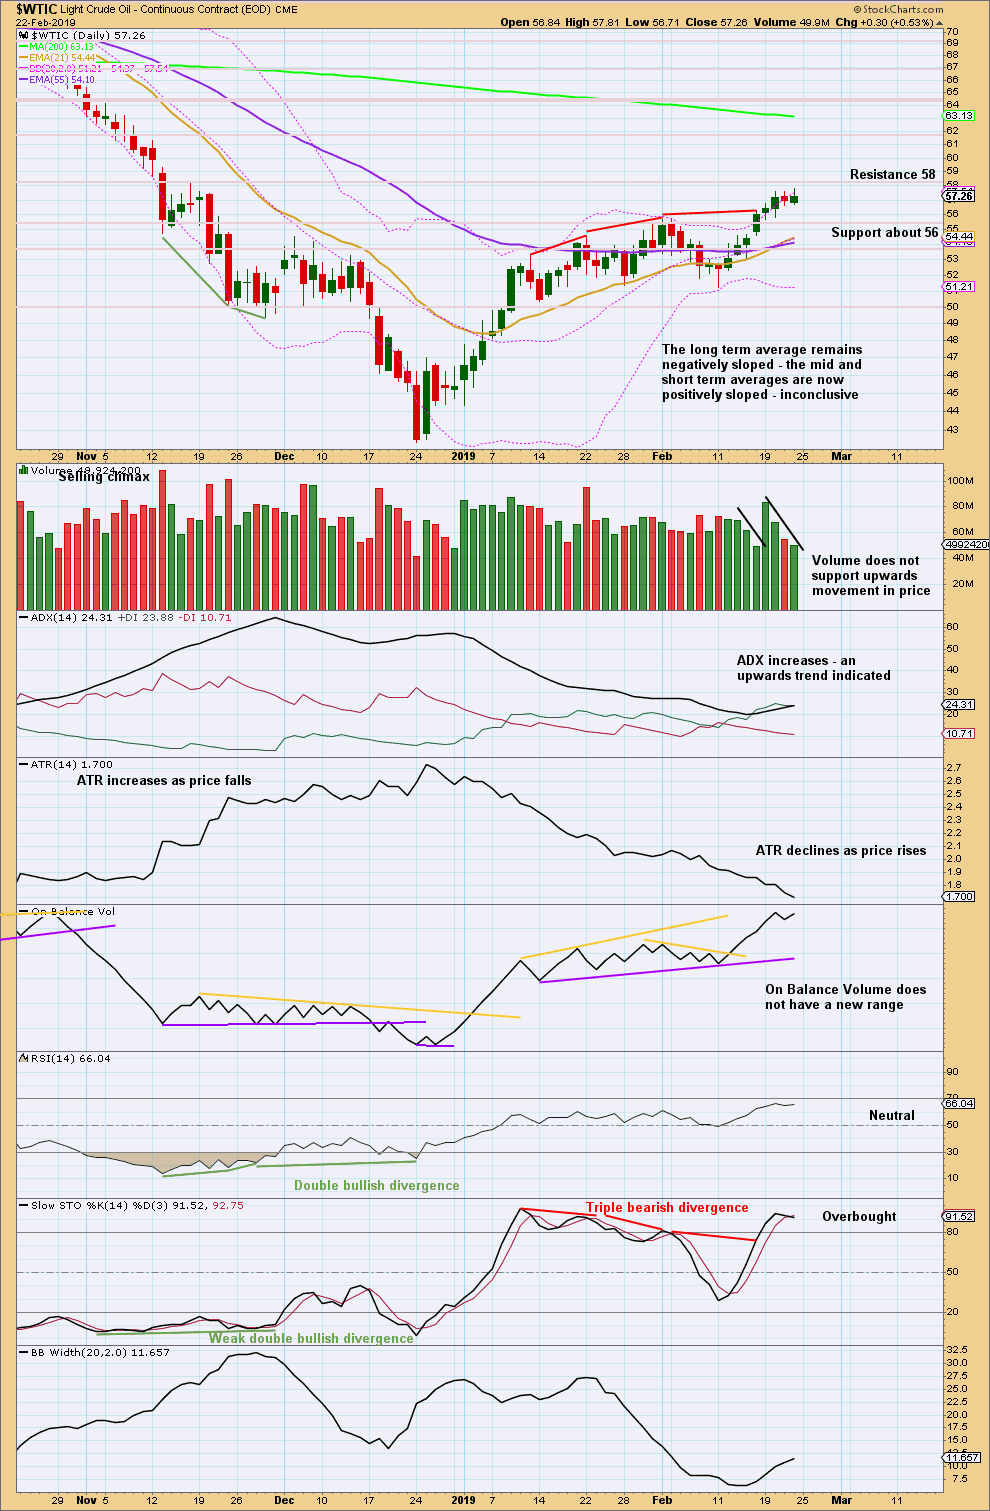
Click chart to enlarge. Chart courtesy of StockCharts.com.
Upwards movement shows weakness. Look out for a possible trend change. This counter trend bounce may end within current resistance. If a bearish candlestick reversal pattern is formed, that may be taken as an indication the bounce could be over.
—
Always practice good risk management as the most important aspect of trading. Always trade with stops and invest only 1-5% of equity on any one trade. Failure to manage risk is the most common mistake new traders make.
Lara, if by chance you are looking for a world map than I’ll suggest don’t buy from ikea. Watching John Oliver last night he pointed out ikea has a world map for sale and they left off New Zealand.
LOL
It’s been extensively covered by our media here in NZ. Our Prime Minister was questioned about it.
It’s actually our cunning plan to hide from the rest of the world, seeing as things are looking a bit dodgy in some spots ATM.
We had a word with Ikea and went with them due to their global reach.
They got it right 🙂
Hi Lara
Oil: Do you think we have had a trend change with yesterday’s strong move down?
Or could it be the bottom of minute wave ii of minor wave C?
I’m going to label Oil as only just completed minute i and ii within minor C.
However, the downwards session for 25th February did have strong volume, so I’m also going to warn quite strongly that it is possible that Primary wave 2 was over at the high on the 22nd February.
If the blue channel is breached by a full daily candlestick below it then that would be the wave count I’d use. I’ll keep an eye on oil daily and update you if that happens. But you’ll know what to do if it does, before I chime in.
I notice also that the 22nd of January was a day with balance of volume down and very strong volume, yet that wasn’t the end of the bounce.
So volume on the 25th of February being quite strong to the downside is a warning, but not definitive.
That’s why I’ll wait for the blue channel to be breached before I have confidence that primary wave 1 is over and primary wave 2 should have begun.