
Last Elliott wave analysis of this pair (22 February 2019) expected some upwards movement. Price has moved upwards, giving confidence to the current Elliott wave count.
Summary: Upwards movement for another two or so months to 1.2046 – 1.20761 is expected.
Changes to this analysis are in bold.
ELLIOTT WAVE ANALYSIS
MONTHLY CHART
Click chart to enlarge.
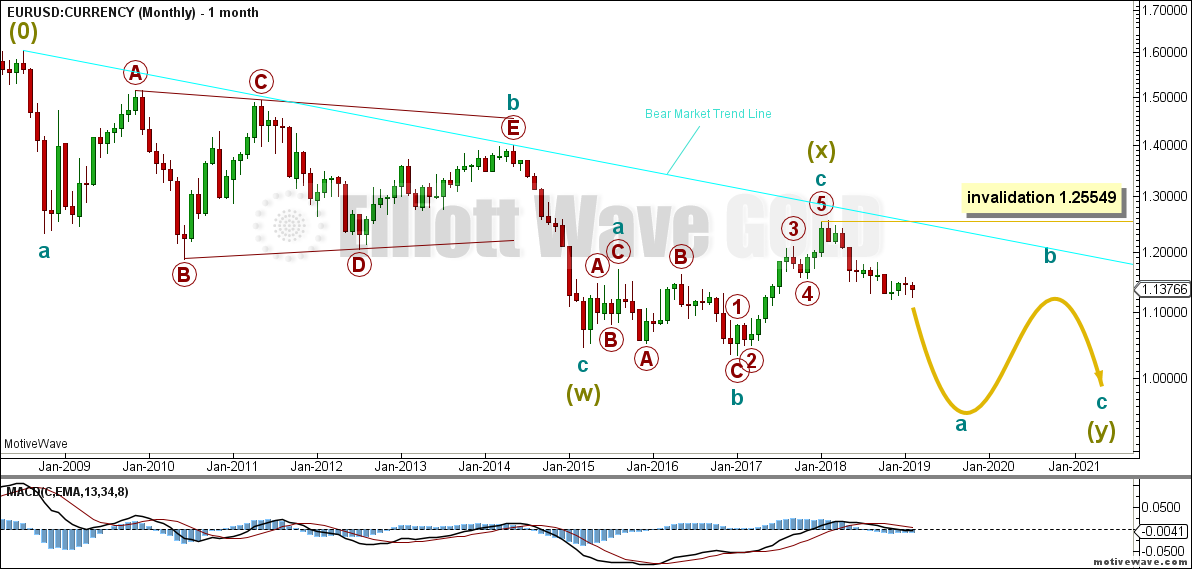
The (0) is from where the wave count begins.
A large zigzag can be seen complete at the low in March 2015. This is labelled Super Cycle wave (w).
A low now below this point indicates that the larger structure downwards is incomplete. The Elliott wave structure that fits best here is a double zigzag.
The first zigzag in the double is complete; it is labelled Super Cycle wave (w). The double is now joined by a complete three in the opposite direction, an expanded flat labelled Super Cycle wave (x). Because Super Cycle wave (x) ends just short of the cyan bear market trend line, it looks like it is over there.
Super Cycle wave (y) is most likely now to unfold as a zigzag.
While double zigzags and double combinations are labelled the same, W-X-Y, they are very different structures.
Double zigzags, like single zigzags, normally have a strong counter trend slope. To achieve this their X waves are usually brief and shallow. The second zigzag in the double usually moves reasonably beyond the end of the first zigzag, so that the whole structure has a strong slope.
Double combinations are sideways movements. To achieve a sideways look their X waves are usually deep and can also often be time consuming. The second structure in the double usually ends about the same level as the first, so that the whole structure takes up time and moves price sideways.
Here, Super Cycle wave (x) is relatively shallow. This indicates a double zigzag is most likely unfolding lower.
The bear market trend line may be expected to continue to provide resistance while the bear market for EURUSD remains intact.
The strongest piece of technical analysis on this chart is the cyan trend line. The fact that it was tested and recently held in February 2018 indicates this line has strength. Any strong bounces within the ongoing bear market may be expected to find strong resistance at this trend line.
WEEKLY CHART
Click chart to enlarge.
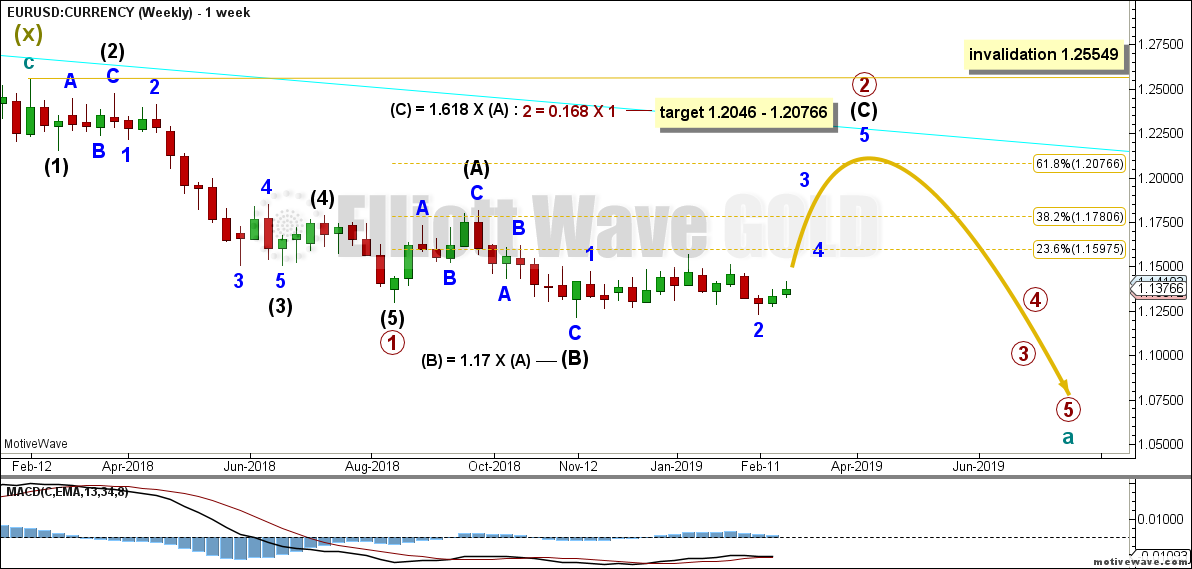
Primary wave 1 subdivides as an impulse.
Primary wave 2 may be unfolding as an expanded flat correction. Within primary wave 2, intermediate waves (A) and (B) both subdivide as a zigzags. Intermediate wave (C) should subdivide as a five wave structure.
The most common Fibonacci ratio is used to calculate a target at intermediate degree for intermediate wave (C) to end. This is very close to the 0.618 Fibonacci ratio of primary wave 1.
If primary wave 2 moves above the target or is long lasting enough, it should find strong resistance at the cyan trend line that is copied over from the monthly chart.
DAILY CHART
Click chart to enlarge.
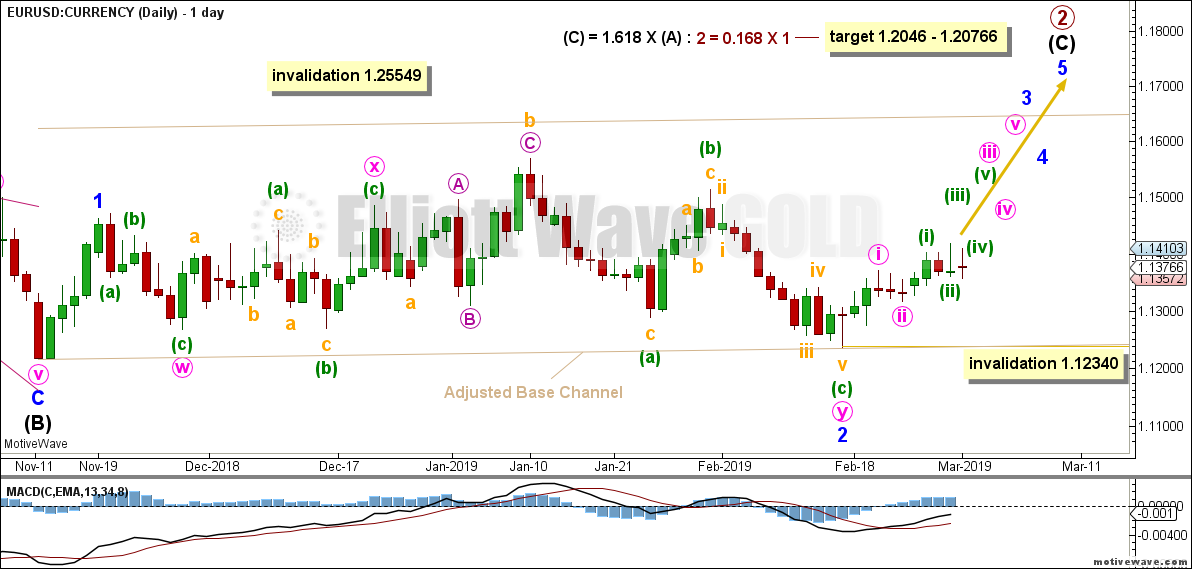
This daily chart focusses on the structure of primary wave 2.
This wave count considers intermediate wave (C) as an incomplete impulse. Within intermediate wave (C), minor wave 2 may be a complete combination with minute W subdividing as a zigzag and minute Y subdividing as an expanded flat. Within minute Y, minuette (b) has subdivided as a zigzag and minuette (c) as an impulse. Upwards movement is expected as minor wave 3 begins.
Elliott wave rules state that the third wave within an impulse must subdivide as an impulse, so minor wave 3 must subdivide as an impulse. Within minor wave 3, minute waves i and ii may be complete with minute wave iii unfolding as an incomplete impulse.
Minor wave 3 breaking out above the adjusted base channel would help confirm that a third wave is underway and thus increase confidence in the current Elliott wave count.
If minute wave ii continues lower, it may not move beyond the start of minute wave i below 1.12340.
WEEKLY TECHNICAL ANALYSIS
Click chart to enlarge. Chart courtesy of StockCharts.com.
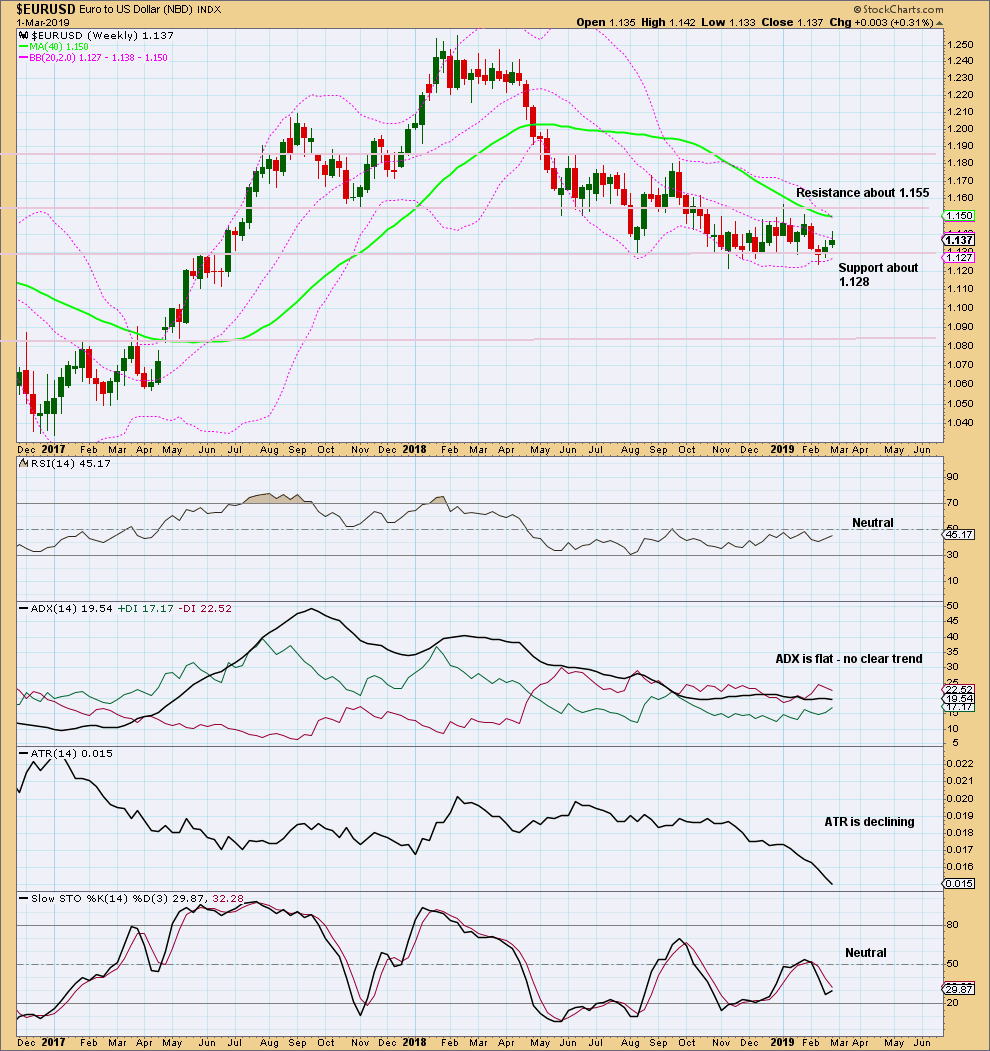
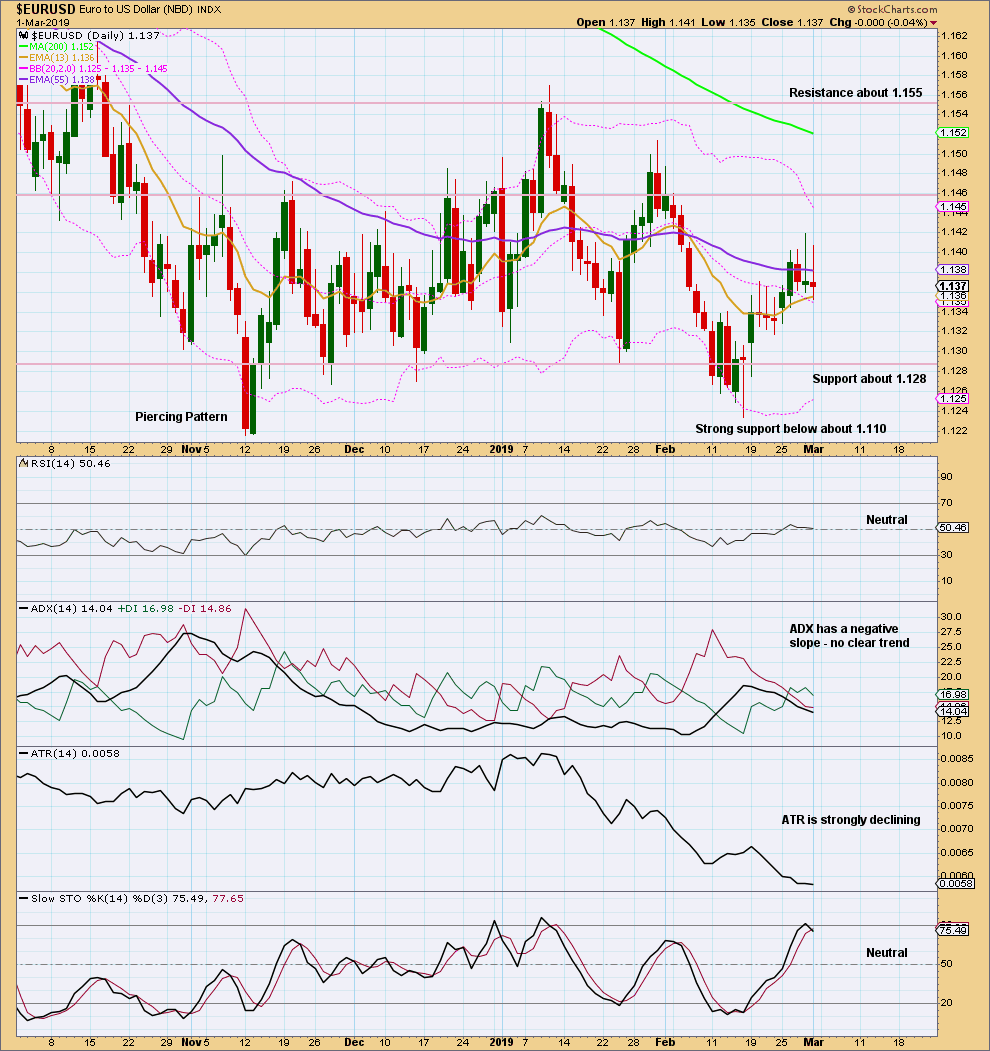
Price is currently range bound and swinging from resistance at about 1.155 to support at about 1.130. ADX supports the view that the market is consolidating. A break out above resistance or support is needed to indicate a new trend.
DAILY TECHNICAL ANALYSIS
Click chart to enlarge. Chart courtesy of StockCharts.com.
RSI is neutral. There is room for price to rise or fall.
On 16th February 2019, as price broke below support, stochastics entered oversold. Expect upwards movement from here as price swings high to resistance. Stochastics often enters overbought as price nears resistance.
Stochastics is nearing overbought.
Expect some upwards movement as price rises to resistance.
VOLUME ANALYSIS
Click chart to enlarge.
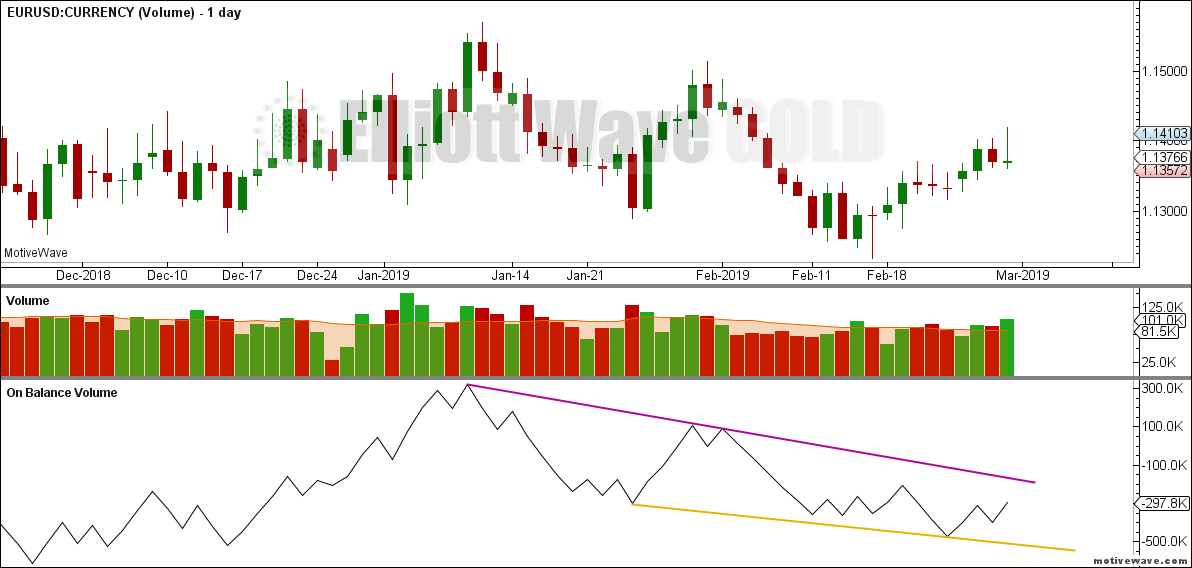
On Balance Volume is range bound and gives no signal for this week.
Volume offers more support for recent upwards days.
Overall, this chart is bullish.
Published @ 02:03 a.m. EST on March 3, 2019.
—
Careful risk management protects your trading account(s).
Follow Lara’s two Golden Rules:
1. Always trade with stops.
2. Risk only 1-5% of equity on any one trade.
Where are we going, L ?
EURUSD will be updated tomorrow.