
Downwards movement was expected for Gold, which is exactly what has happened today. The Elliott wave count remains the same and the target remains the same.
Summary: Three long-term targets are now calculated for cycle wave c to end. Confidence in a new downwards trend may be had with a new low below 1,160.75.
The mid-term target for a third wave down is at 1,207.
New updates to this analysis are in bold.
Grand SuperCycle analysis is here.
Last monthly charts are here. Video is here.
MAIN ELLIOTT WAVE COUNT
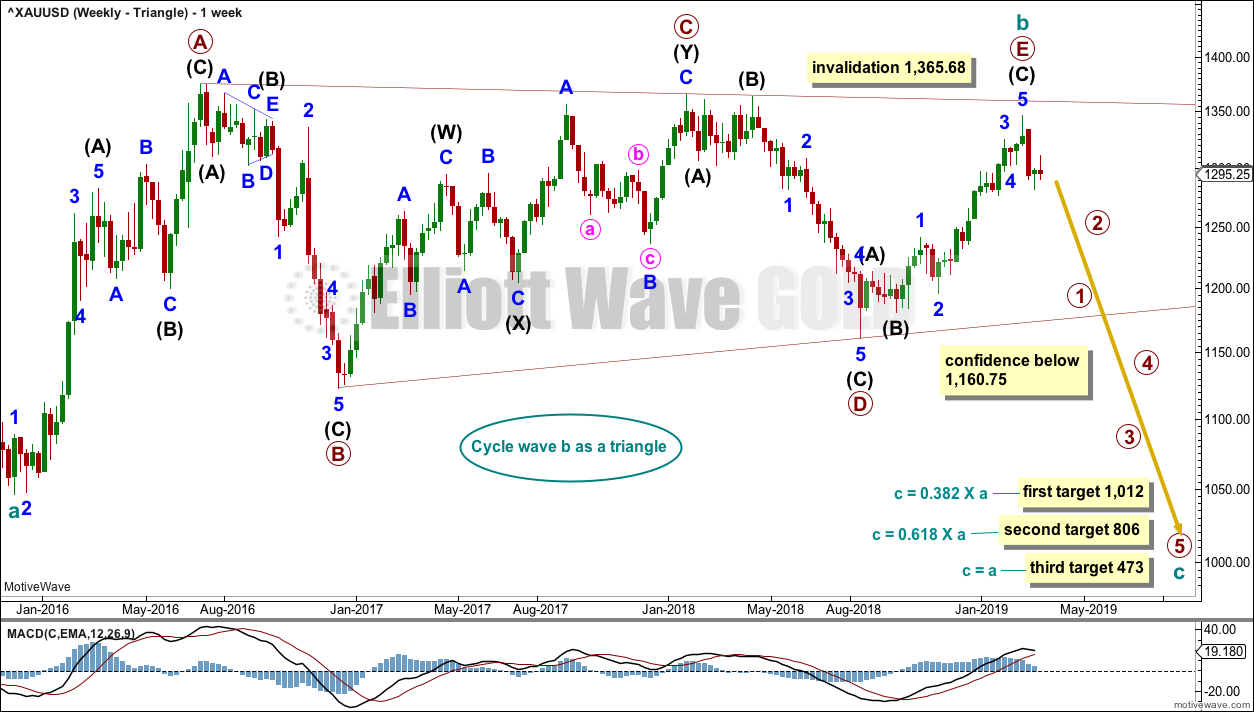
WEEKLY CHART – TRIANGLE
Click chart to enlarge.
This is the preferred wave count.
Cycle wave b may be a complete regular contracting triangle. If it continues further, then primary wave E may not move beyond the end of primary wave C above 1,365.68.
Four of the five sub-waves of a triangle must be zigzags, with only one sub-wave allowed to be a multiple zigzag. Wave C is the most common sub-wave to subdivide as a multiple, and this is how primary wave C for this example fits best.
There are no problems in terms of subdivisions or rare structures for this wave count. It has an excellent fit and so far a typical look.
This wave count would expect a cycle degree trend change has recently occurred. Cycle wave c would most likely make new lows below the end of cycle wave a at 1,046.27 to avoid a truncation.
Primary wave E should exhibit reasonable weakness as it comes to an end. Triangles often end with declining ATR, weak momentum and weak volume.
If this weekly wave count is correct, then cycle wave c downwards should develop strength, ATR should show some increase, and MACD should exhibit an increase in downwards momentum.
Three targets are calculated for cycle wave c. Cycle wave a lasted 4.25 years. Cycle wave b may be over in 3.17 years. Cycle wave c may last a minimum of 2 years and possibly up to 5 years.
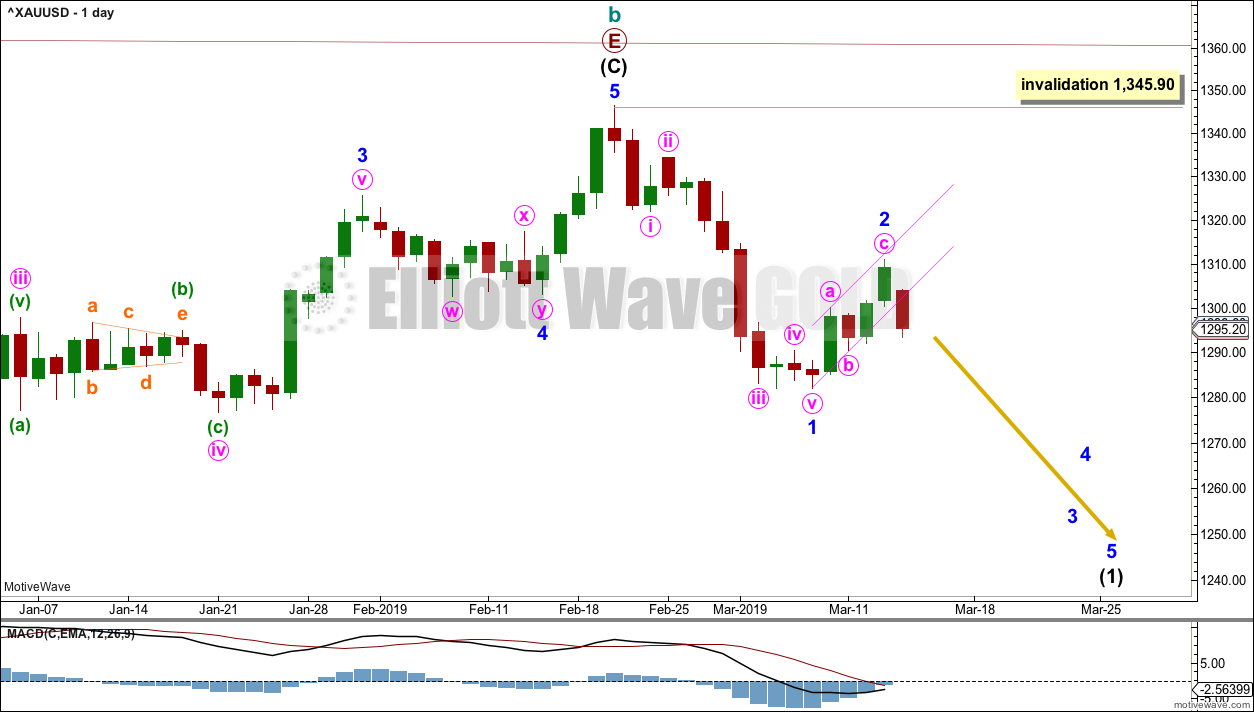
DAILY CHART – TRIANGLE
Click chart to enlarge.
Cycle wave c must subdivide as a five wave structure, either an impulse or an ending diagonal. An impulse is much more common and that shall be how it is labelled unless overlapping suggests a diagonal should be considered.
A new trend at cycle degree should begin with a five wave structure on the daily chart, which will be labelled minor wave 1. Minor wave 2 should look like an obvious three wave structure on the daily chart, which it now does, so it is possible now that it could be complete. It is also possible that it may continue higher or sideways, although with volume today strongly pushing price lower this looks unlikely.
Minor wave 2 may not move beyond the start of minor wave 1 above 1,345.90.
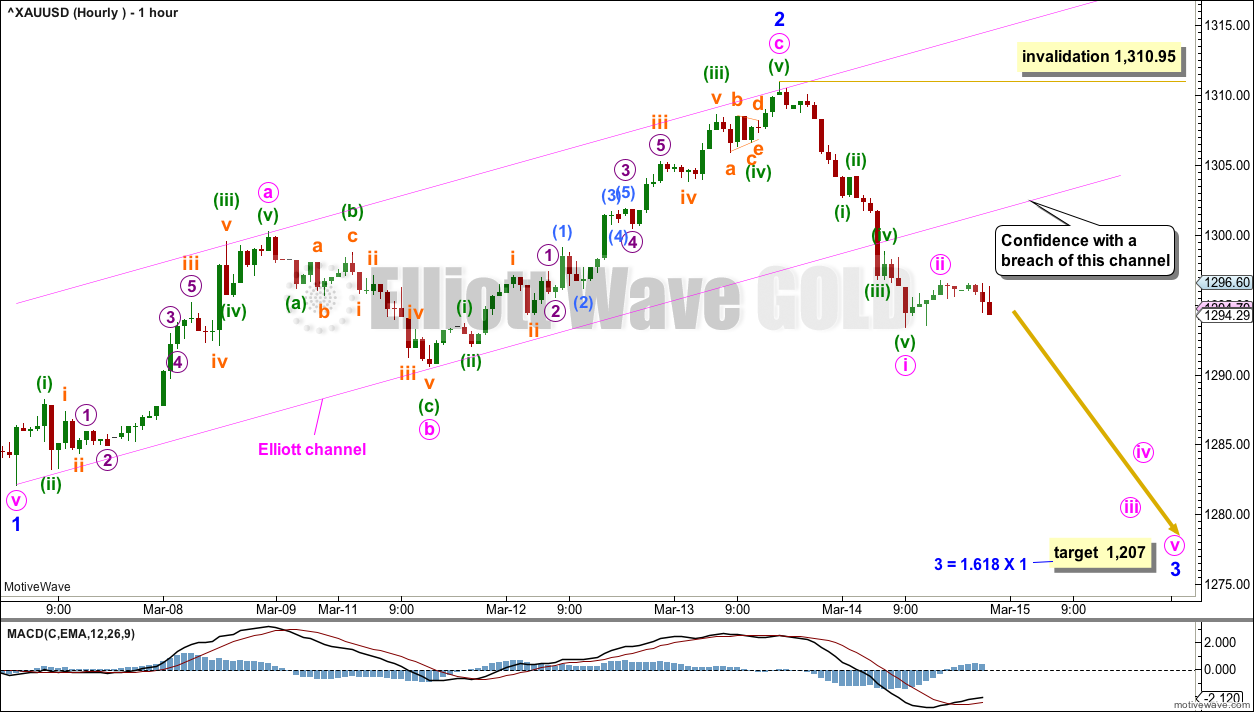
HOURLY CHART
Click chart to enlarge.
Minor wave 2 may now be a complete single zigzag, the most common structure for a second wave. A channel is drawn about minor wave 2 using Elliott’s technique. Minute wave c may have ended about resistance at the upper edge.
At the high labelled minor wave 2 is a Gravestone Doji; this is a bearish candlestick pattern. The channel is now strongly breached by downwards movement, and that may be taken as indication that minor wave 2 may be over and minor wave 3 downwards may be underway.
A target is calculated for minor wave 3 to reach the most common Fibonacci ratio to minor wave 1.
Minor wave 3 may only subdivide as an impulse, and within it minute wave ii may not move beyond the start of minute wave i above 1,310.95.
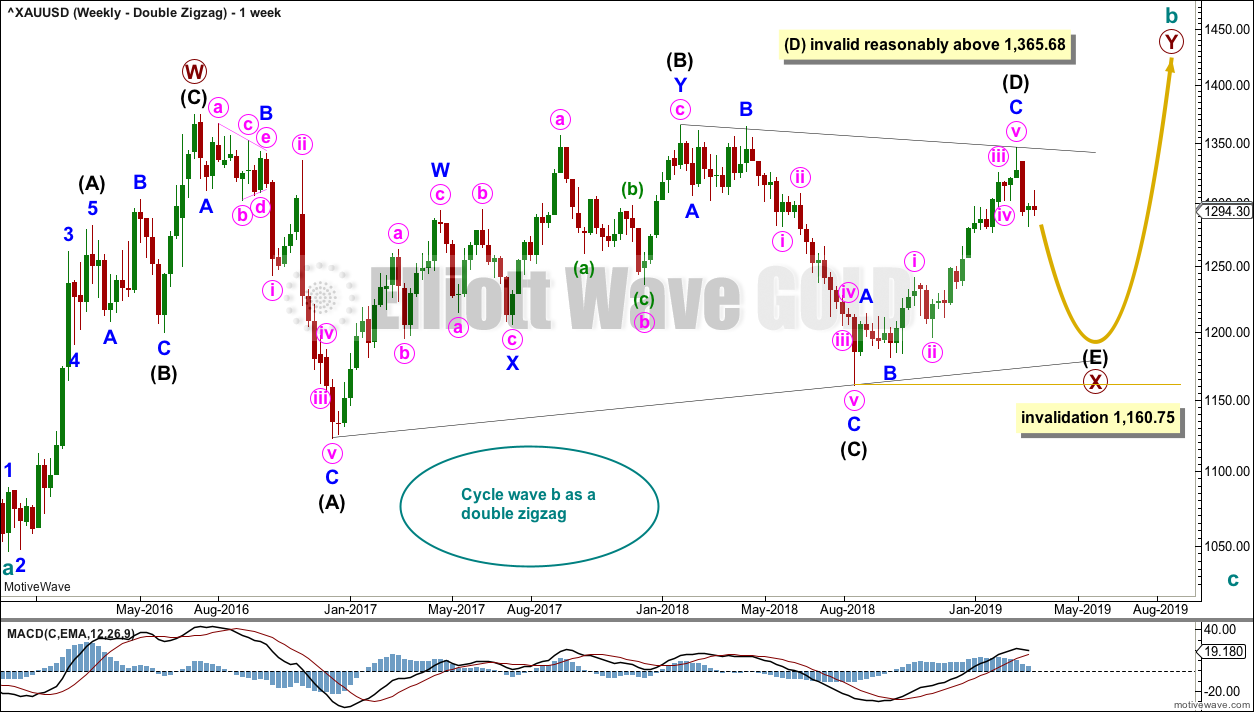
WEEKLY CHART – DOUBLE ZIGZAG
Click chart to enlarge.
It is possible that cycle wave b may be an incomplete double zigzag or a double combination.
The first zigzag in the double is labelled primary wave W. This has a good fit.
The double may be joined by a corrective structure in the opposite direction, a triangle labelled primary wave X. The triangle would be about four fifths complete.
Within multiples, X waves are almost always zigzags and rarely triangles. Within the possible triangle of primary wave X, it is intermediate wave (B) that is a multiple; this is acceptable, but note this is not the most common triangle sub-wave to subdivide as a multiple. These two points reduce the probability of this wave count.
Intermediate wave (D) may be complete. The (B)-(D) trend line is almost perfectly adhered to with the smallest overshoot within intermediate wave (C). This is acceptable.
Intermediate wave (E) should continue to exhibit weakness: ATR should continue to show a steady decline, and MACD may begin to hover about zero.
Intermediate wave (E) may not move beyond the end of intermediate wave (C) below 1,160.75.
This wave count may now expect downwards movement for several weeks.
Primary wave Y would most likely be a zigzag because primary wave X would be shallow; double zigzags normally have relatively shallow X waves.
Primary wave Y may also be a flat correction if cycle wave b is a double combination, but combinations normally have deep X waves. This would be less likely.
This wave count has good proportions and no problems in terms of subdivisions.
ALTERNATE ELLIOTT WAVE COUNT
WEEKLY CHART
Click chart to enlarge.
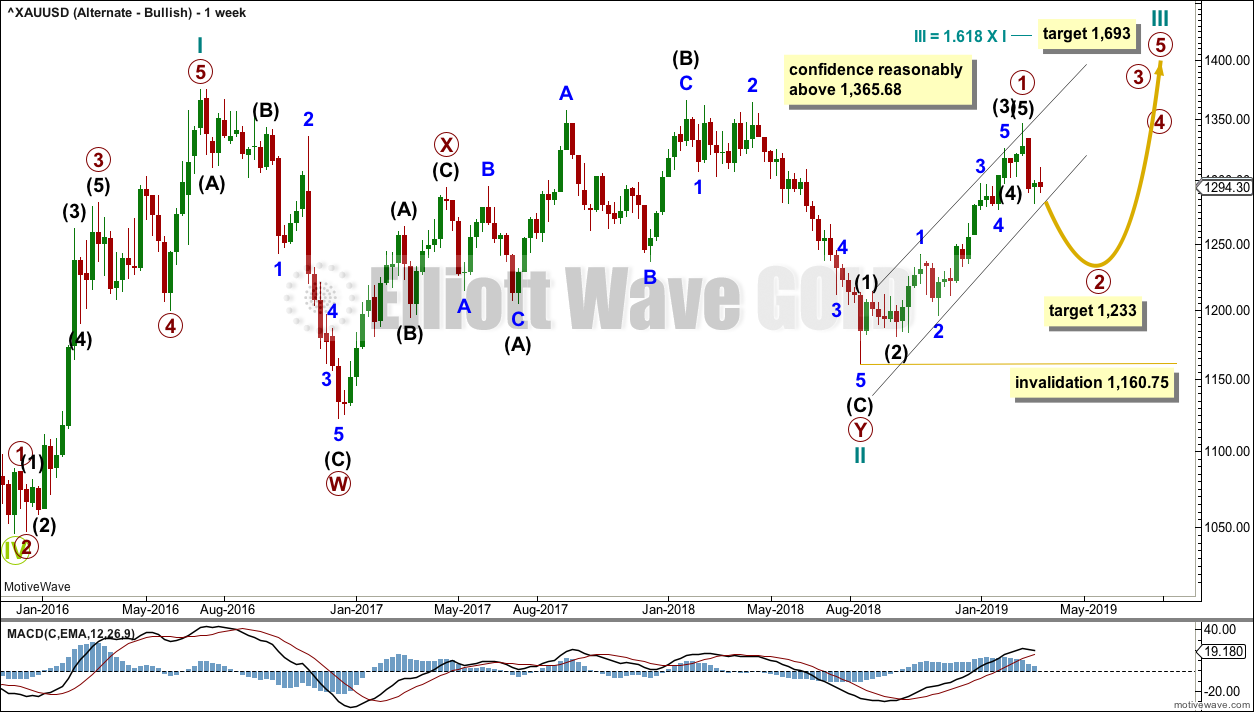
If Gold is in a new bull market, then it should begin with a five wave structure upwards on the weekly chart. However, the biggest problem with this wave count is the structure labelled cycle wave I because this wave count must see it as a five wave structure, but it looks more like a three wave structure.
Commodities often exhibit swift strong fifth waves that force the fourth wave corrections coming just prior to be more brief and shallow than their counterpart second waves. It is unusual for a commodity to exhibit a quick second wave and a more time consuming fourth wave, and this is how cycle wave I is labelled. The probability of this wave count is low due to this problem.
Cycle wave II subdivides well as a double combination: zigzag – X – expanded flat.
Cycle wave III may have begun. Within cycle wave III, primary wave 1 may now be complete. The target for primary wave 2 is the 0.618 Fibonacci ratio of primary wave 1. Primary wave 2 may not move beyond the start of primary wave 1 below 1,160.75.
A black channel is drawn about primary wave 1. Primary wave 2 may breach the lower edge of this channel.
Cycle wave III so far for this wave count would have been underway now for 27 weeks. It should be beginning to exhibit some support from volume, increase in upwards momentum and increasing ATR. However, volume continues to decline, ATR continues to decline and is very low, and momentum is weak in comparison to cycle wave I. This wave count lacks support from classic technical analysis.
TECHNICAL ANALYSIS
WEEKLY CHART
Click chart to enlarge. Chart courtesy of StockCharts.com.
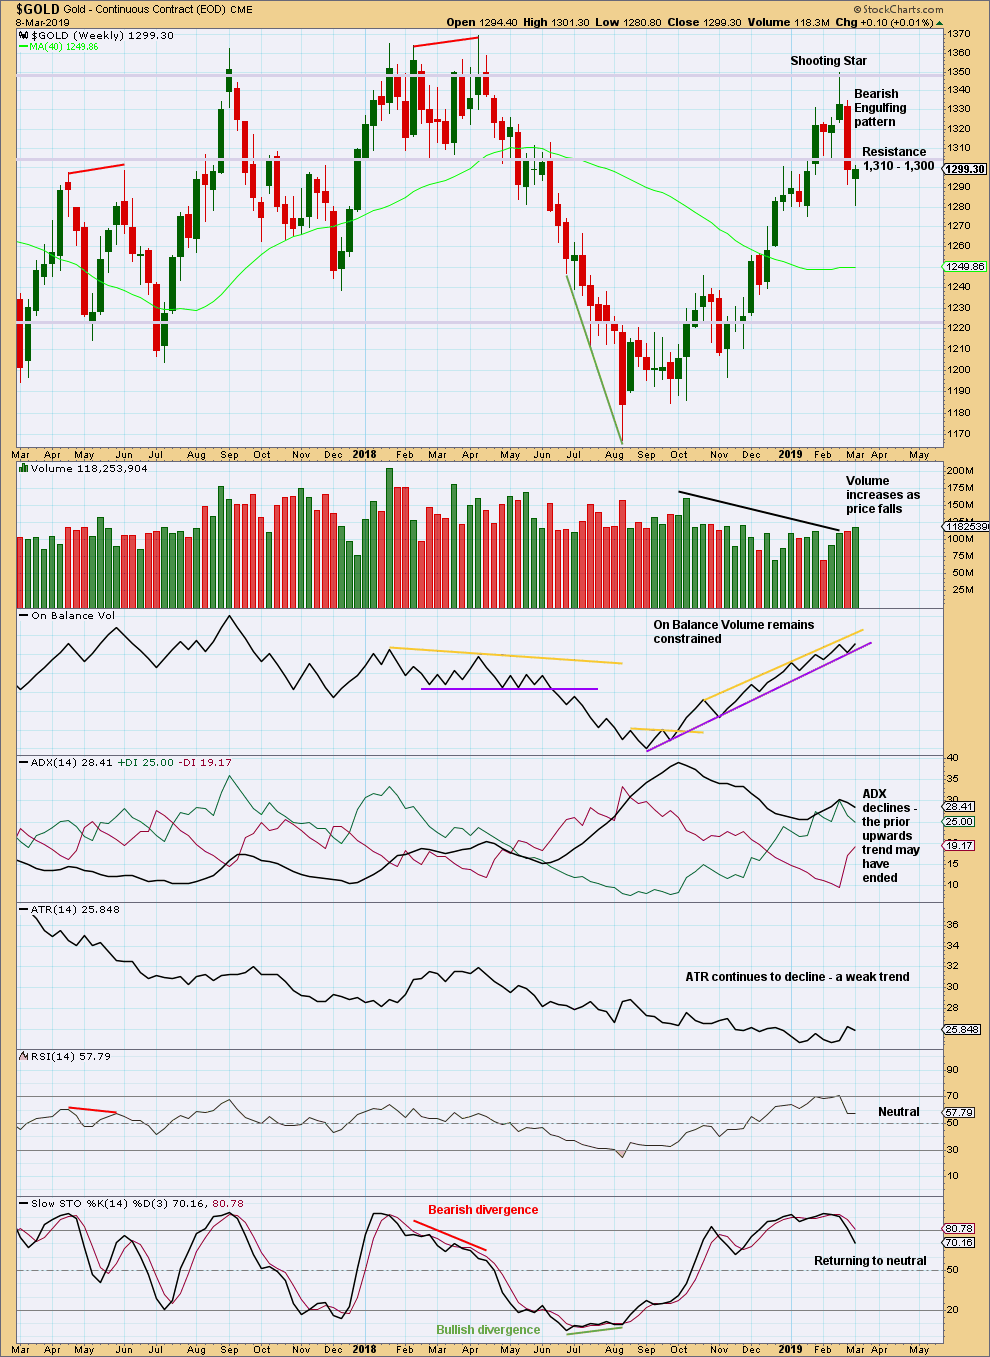
There are now two bearish candlestick reversal patterns on the weekly chart: a Shooting Star and a Bearish Engulfing pattern. This supports the view that a high is in place.
Last weekly candlestick may not be considered a bullish reversal pattern as it does not come after a downwards trend at this time frame. The long lower wick is still bullish.
DAILY CHART
Click chart to enlarge. Chart courtesy of StockCharts.com.
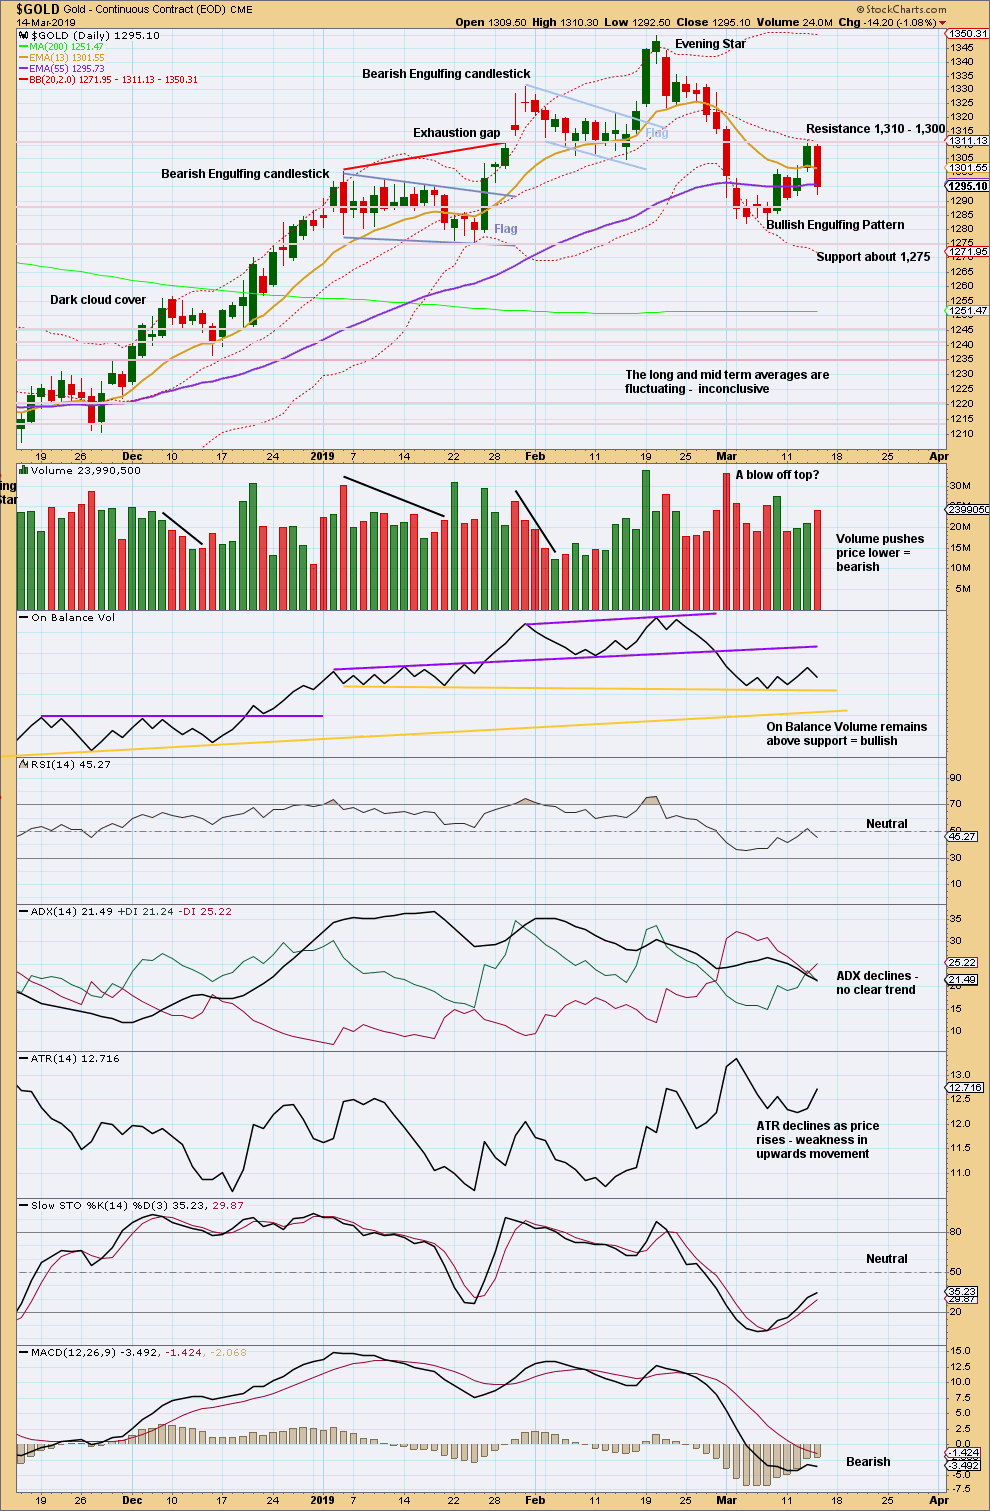
A strong downwards day with increased ATR and volume suggests a back test of resistance about 1,310 may now be complete. It would now be typical to see price move down and away from this area.
Today’s candlestick is not labelled as a Bearish Engulfing pattern, because it does not come at the end of a reasonable rise in price. For a candlestick reversal pattern to be read as such it needs to have a trend to reverse.
GDX WEEKLY CHART
Click chart to enlarge. Chart courtesy of StockCharts.com.
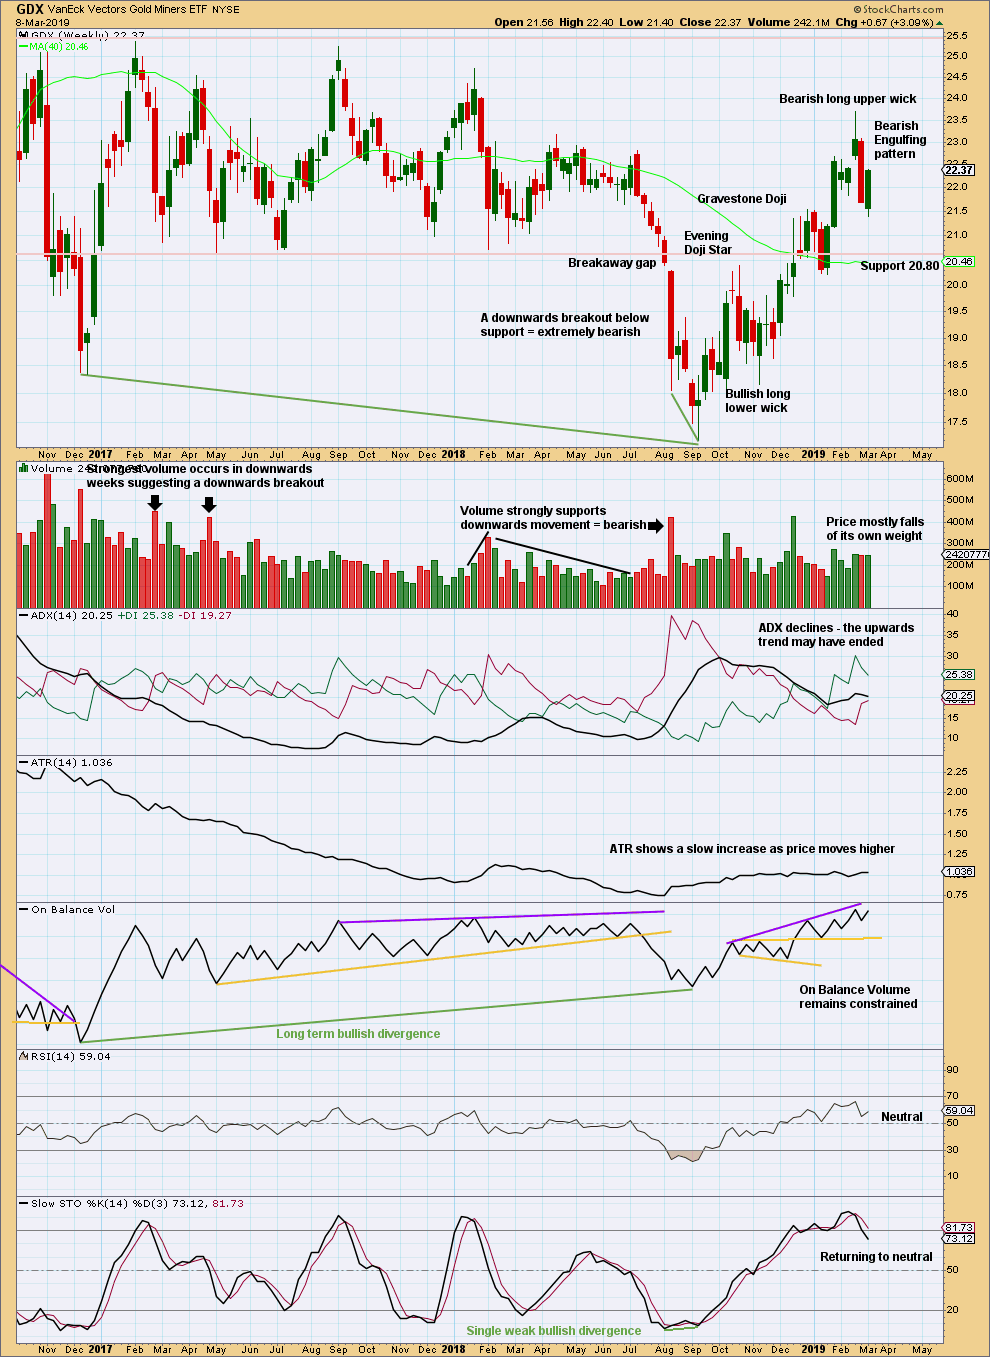
The Bearish Engulfing pattern at the weekly chart level should still be given weight in this analysis. It signals an end to the upwards trend and a new downwards or sideways trend.
GDX DAILY CHART
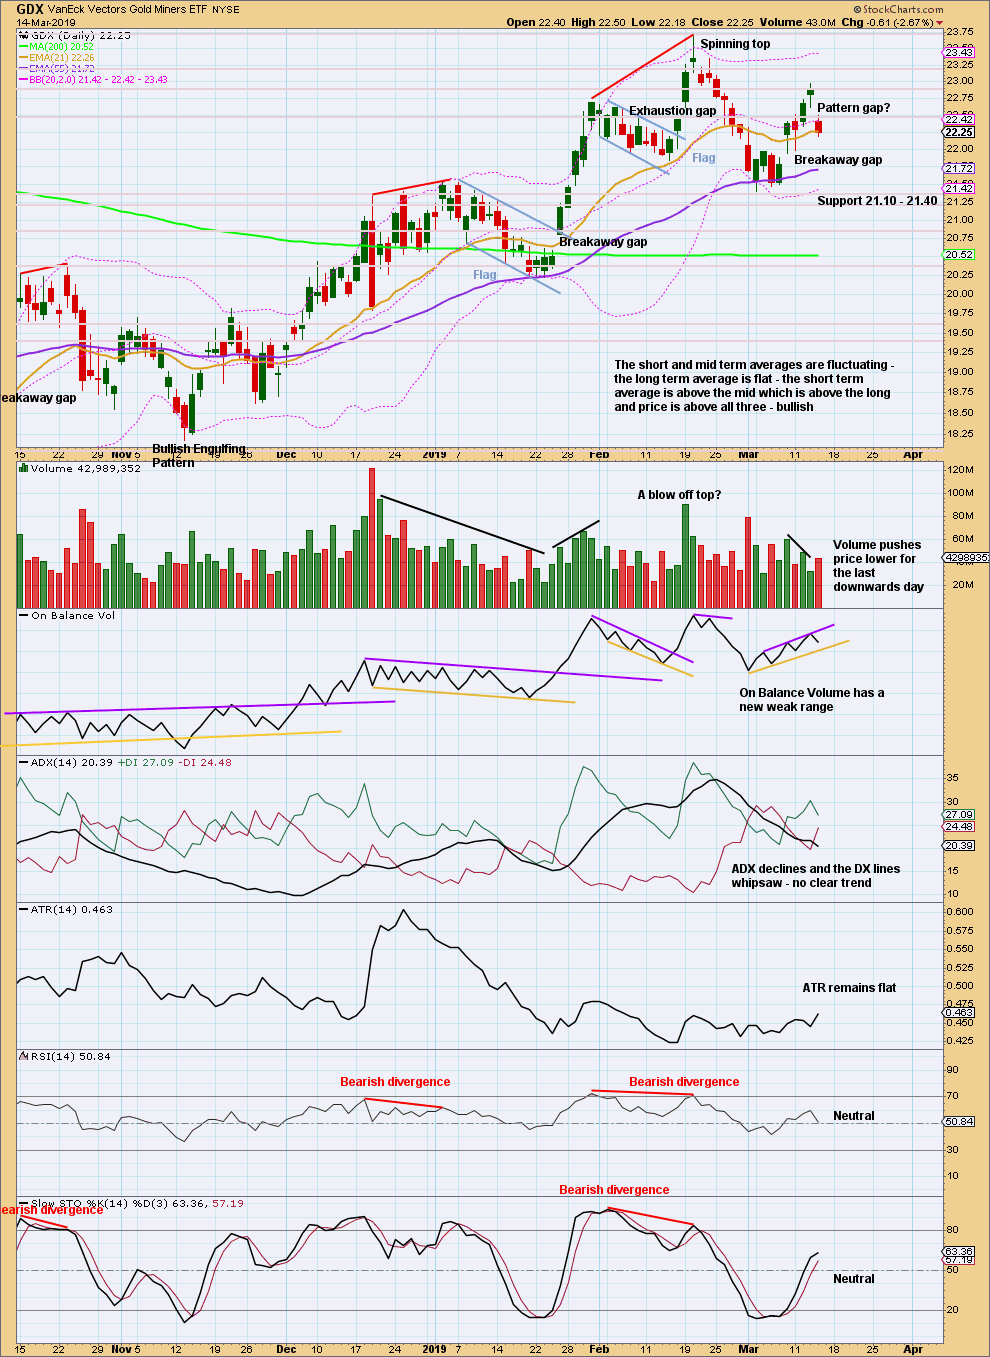
Click chart to enlarge. Chart courtesy of StockCharts.com.
Friday saw an upwards breakout from a small consolidation that has support from volume and a breakaway gap. Look now for support at the breakaway gap at 21.89 and resistance above about 22.50 and then 22.90.
Volume now suggests more downwards movement from here. Look for support next about 21.10 to 21.40.
Published @ 10:32 p.m. EST.
—
Careful risk management protects your trading account(s).
Follow my two Golden Rules:
1. Always trade with stops.
2. Risk only 1-5% of equity on any one trade.
Hourly chart updated:
Minute ii now has a better proportion to minute i. It’s still finding resistance about the lower edge of the pink channel.
This may be another good entry opportunity, if members were stopped out or hadn’t tried to short.
Remember: risk management is the biggest most important aspect of trading. Always use stops, and risk only 1-5% of equity on any one trade. Those are my two Golden Rules for trading, and I’m really serious about it. If newer members learn only that from me I’ll have done a good job.
Daily gold chart exhibited similar bullish candlestik bottom patterns Frying pan around 1280. One in Jan and March 11.
It appears 12800 is a strong resistance.
Lara, sad to hear about a mass shooting in your beautiful, peaceful country 😢
Thanks Dreamer.
Especially Christchurch. They’ve endured so much horror in the last several years. Still not rebuilt after the earthquakes. Now this.
But there’s a big outpouring of love happening here in NZ to counter the hate today. We’ll be okay.