
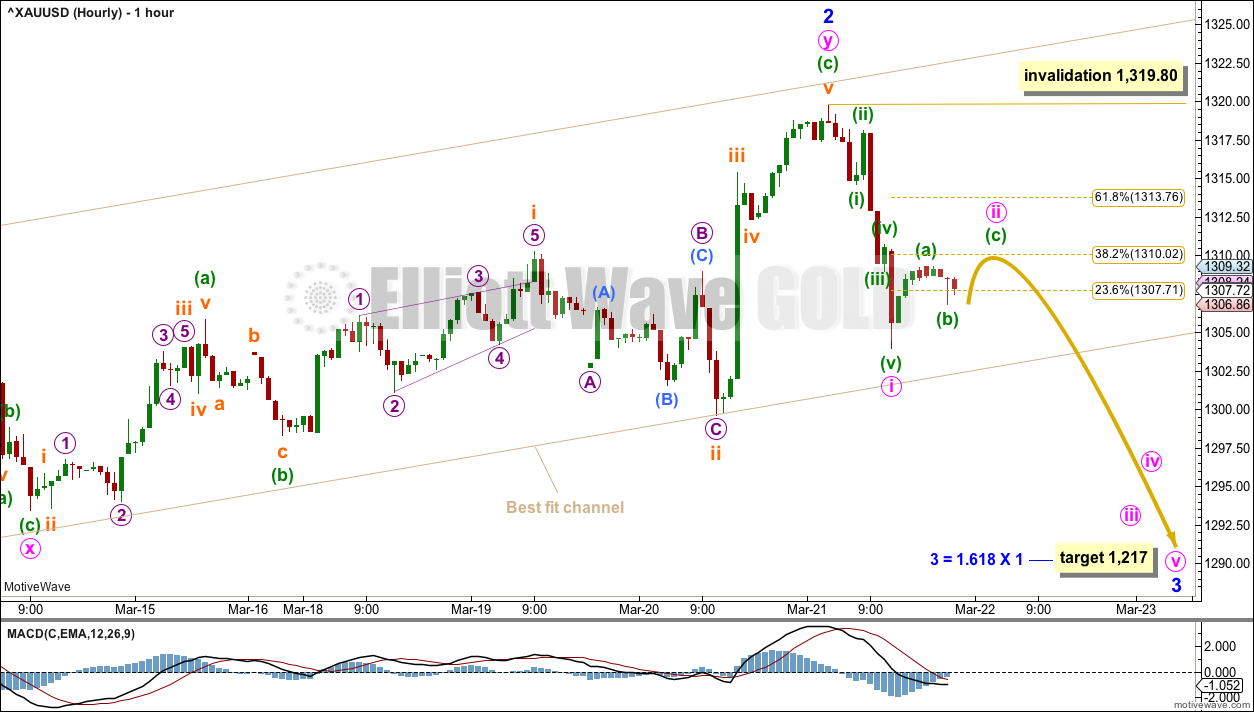
A short-term Elliott wave target for upwards movement to end was calculated yesterday at 1,318 to 1,322. Upwards movement continued to a high at 1,319.80.
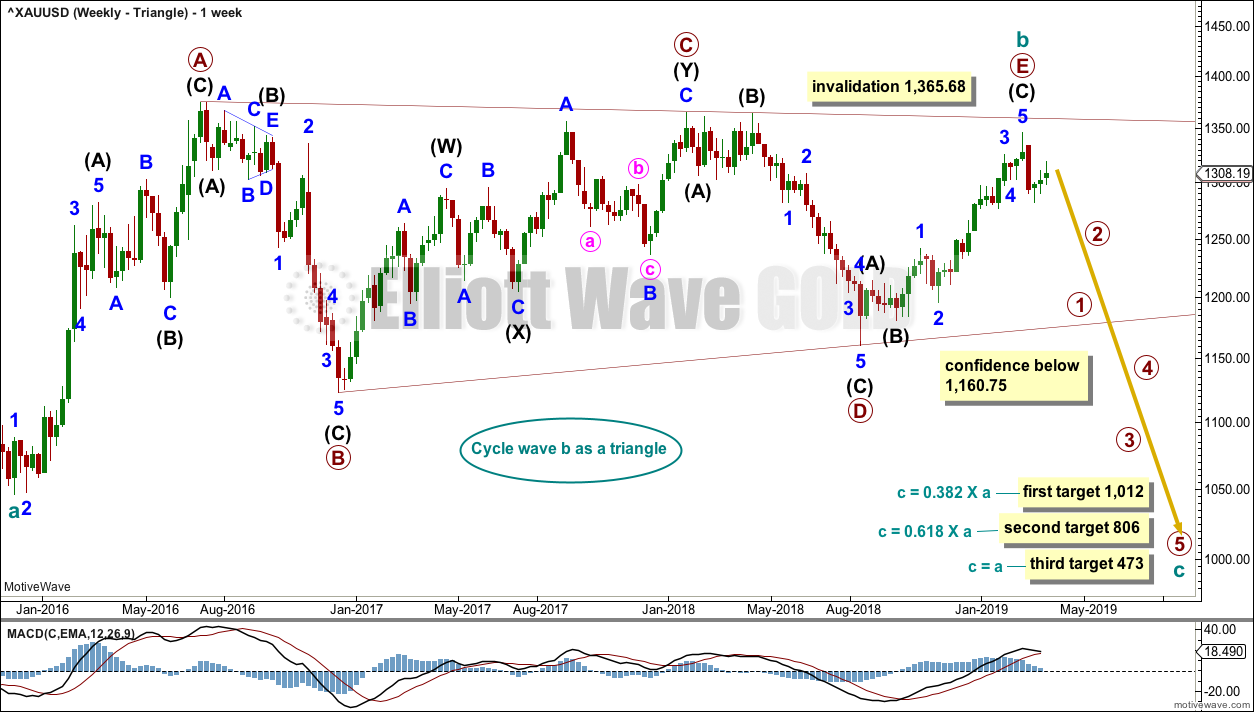
Summary: Three long-term targets are now calculated for cycle wave c to end. Confidence in a new downwards trend may be had with a new low below 1,160.75.
The mid-term target for a third wave down is at 1,217. A target calculated using the flag is about 1,236.
For the short term, a breach of the best fit channel on the daily and hourly charts would add some confidence that the downwards trend has resumed.
New updates to this analysis are in bold.
Grand SuperCycle analysis is here.
Last monthly charts are here. Video is here.
MAIN ELLIOTT WAVE COUNT
WEEKLY CHART – TRIANGLE
Click chart to enlarge.
This is the preferred wave count.
Cycle wave b may be a complete regular contracting triangle. If it continues further, then primary wave E may not move beyond the end of primary wave C above 1,365.68.
Four of the five sub-waves of a triangle must be zigzags, with only one sub-wave allowed to be a multiple zigzag. Wave C is the most common sub-wave to subdivide as a multiple, and this is how primary wave C for this example fits best.
There are no problems in terms of subdivisions or rare structures for this wave count. It has an excellent fit and so far a typical look.
This wave count would expect a cycle degree trend change has recently occurred. Cycle wave c would most likely make new lows below the end of cycle wave a at 1,046.27 to avoid a truncation.
Primary wave E should exhibit reasonable weakness as it comes to an end. Triangles often end with declining ATR, weak momentum and weak volume.
If this weekly wave count is correct, then cycle wave c downwards should develop strength, ATR should show some increase, and MACD should exhibit an increase in downwards momentum.
Three targets are calculated for cycle wave c. Cycle wave a lasted 4.25 years. Cycle wave b may be over in 3.17 years. Cycle wave c may last a minimum of 2 years and possibly up to 5 years.
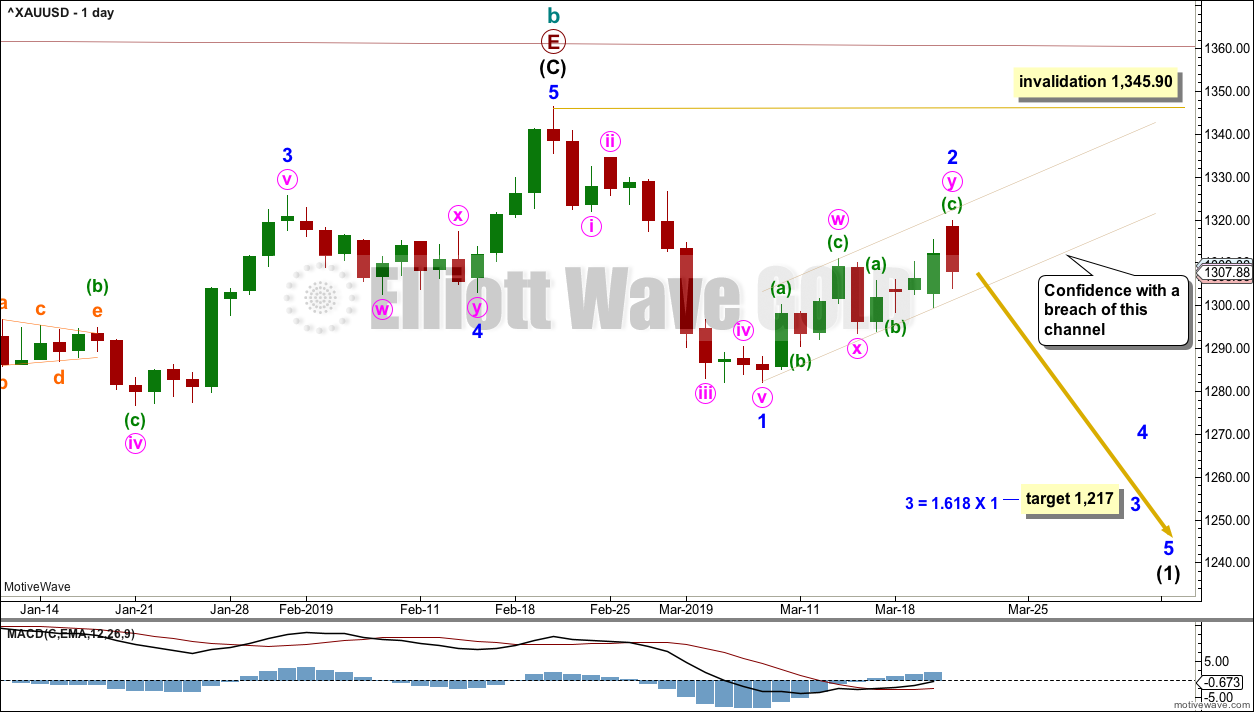
DAILY CHART – TRIANGLE
Click chart to enlarge.
Cycle wave c must subdivide as a five wave structure, either an impulse or an ending diagonal. An impulse is much more common and that shall be how it is labelled unless overlapping suggests a diagonal should be considered.
A new trend at cycle degree should begin with a five wave structure on the daily chart, which will be labelled minor wave 1.
Minor wave 2 subdivides well as a double zigzag on the hourly chart and now looks complete. A best fit channel is drawn about minor wave 2. Copy this over to the hourly chart. When this channel is breached by a full daily candlestick below and not touching the lower edge, that would provide strong confidence that minor wave 2 should be over and minor wave 3 should be underway.
Minor wave 2 may not move beyond the start of minor wave 1 above 1,345.90. The invalidation point will remain the same while price remains within the channel. The risk that minor wave 2 may still continue higher remains.
HOURLY CHART
Click chart to enlarge.
The zigzag over at the last high may have only been the first zigzag in a double zigzag.
Double zigzags are fairly common structures for second waves.
The second zigzag labelled minute wave y now fits as a completed structure.
There now looks to be a completed five wave impulse downwards. This is labelled minute wave i. Minute wave ii may now continue a little higher as a three wave structure, ending about either the 0.382 or 0.618 Fibonacci ratios.
Thereafter, minute wave iii of minor wave 3 should have the power to break below the lower edge of the best fit channel, and below support about 1,300.
A new target is calculated for minor wave 3; it expects to exhibit the most common Fibonacci ratio to minor wave 1.
Minute wave ii may not move beyond the start of minute wave i above 1,319.80.
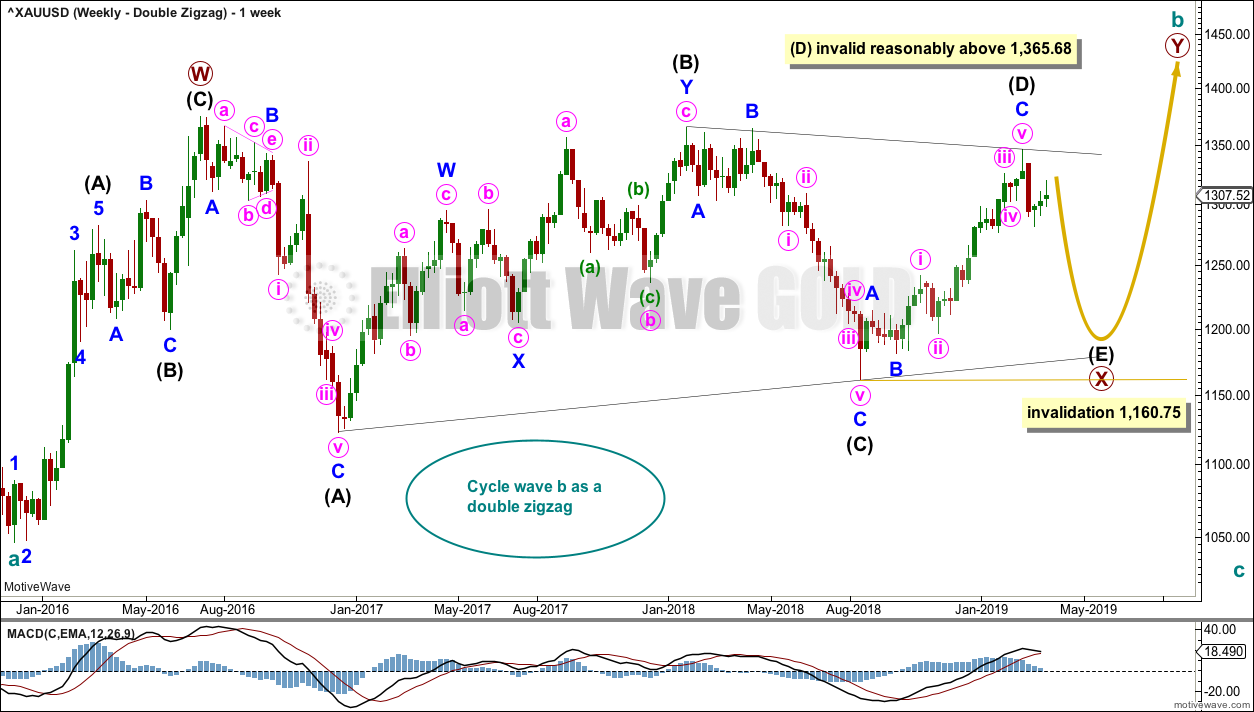
WEEKLY CHART – DOUBLE ZIGZAG
Click chart to enlarge.
It is possible that cycle wave b may be an incomplete double zigzag or a double combination.
The first zigzag in the double is labelled primary wave W. This has a good fit.
The double may be joined by a corrective structure in the opposite direction, a triangle labelled primary wave X. The triangle would be about four fifths complete.
Within multiples, X waves are almost always zigzags and rarely triangles. Within the possible triangle of primary wave X, it is intermediate wave (B) that is a multiple; this is acceptable, but note this is not the most common triangle sub-wave to subdivide as a multiple. These two points reduce the probability of this wave count.
Intermediate wave (D) may be complete. The (B)-(D) trend line is almost perfectly adhered to with the smallest overshoot within intermediate wave (C). This is acceptable.
Intermediate wave (E) should continue to exhibit weakness: ATR should continue to show a steady decline, and MACD may begin to hover about zero.
Intermediate wave (E) may not move beyond the end of intermediate wave (C) below 1,160.75.
This wave count may now expect downwards movement for several weeks.
Primary wave Y would most likely be a zigzag because primary wave X would be shallow; double zigzags normally have relatively shallow X waves.
Primary wave Y may also be a flat correction if cycle wave b is a double combination, but combinations normally have deep X waves. This would be less likely.
This wave count has good proportions and no problems in terms of subdivisions.
ALTERNATE ELLIOTT WAVE COUNT
WEEKLY CHART
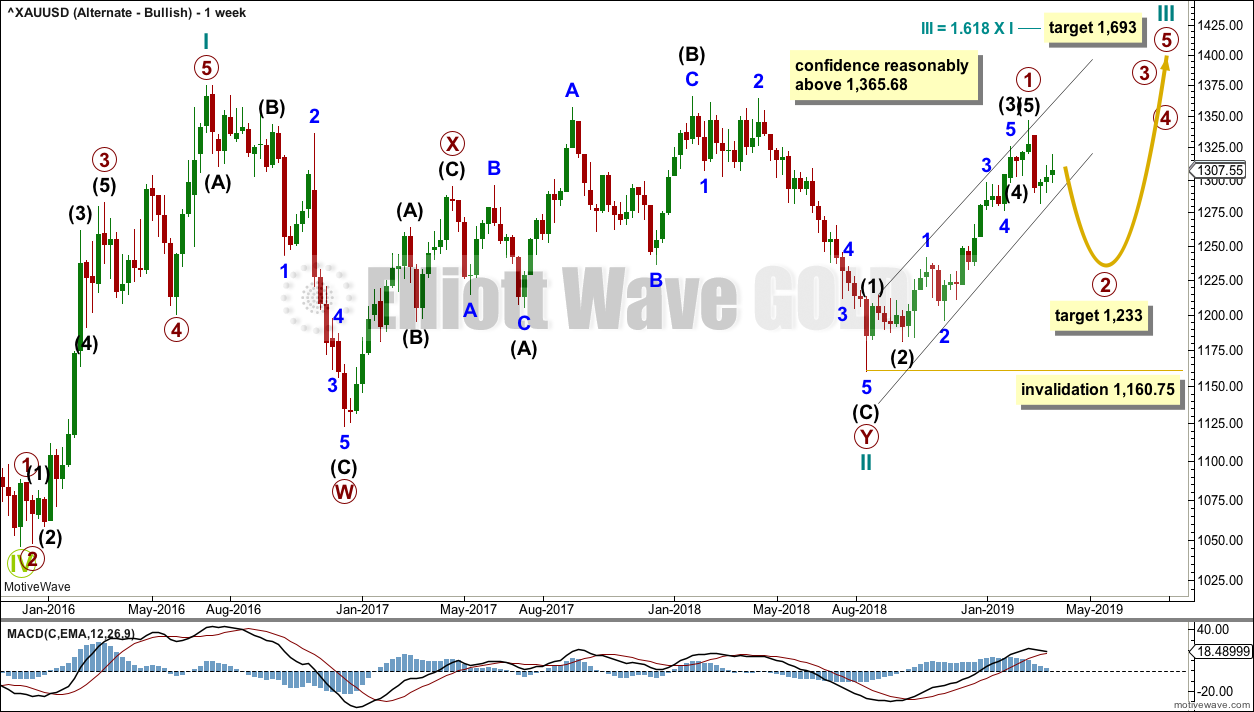
Click chart to enlarge.
If Gold is in a new bull market, then it should begin with a five wave structure upwards on the weekly chart. However, the biggest problem with this wave count is the structure labelled cycle wave I because this wave count must see it as a five wave structure, but it looks more like a three wave structure.
Commodities often exhibit swift strong fifth waves that force the fourth wave corrections coming just prior to be more brief and shallow than their counterpart second waves. It is unusual for a commodity to exhibit a quick second wave and a more time consuming fourth wave, and this is how cycle wave I is labelled. The probability of this wave count is low due to this problem.
Cycle wave II subdivides well as a double combination: zigzag – X – expanded flat.
Cycle wave III may have begun. Within cycle wave III, primary wave 1 may now be complete. The target for primary wave 2 is the 0.618 Fibonacci ratio of primary wave 1. Primary wave 2 may not move beyond the start of primary wave 1 below 1,160.75.
A black channel is drawn about primary wave 1. Primary wave 2 may breach the lower edge of this channel.
Cycle wave III so far for this wave count would have been underway now for 27 weeks. It should be beginning to exhibit some support from volume, increase in upwards momentum and increasing ATR. However, volume continues to decline, ATR continues to decline and is very low, and momentum is weak in comparison to cycle wave I. This wave count lacks support from classic technical analysis.
TECHNICAL ANALYSIS
WEEKLY CHART
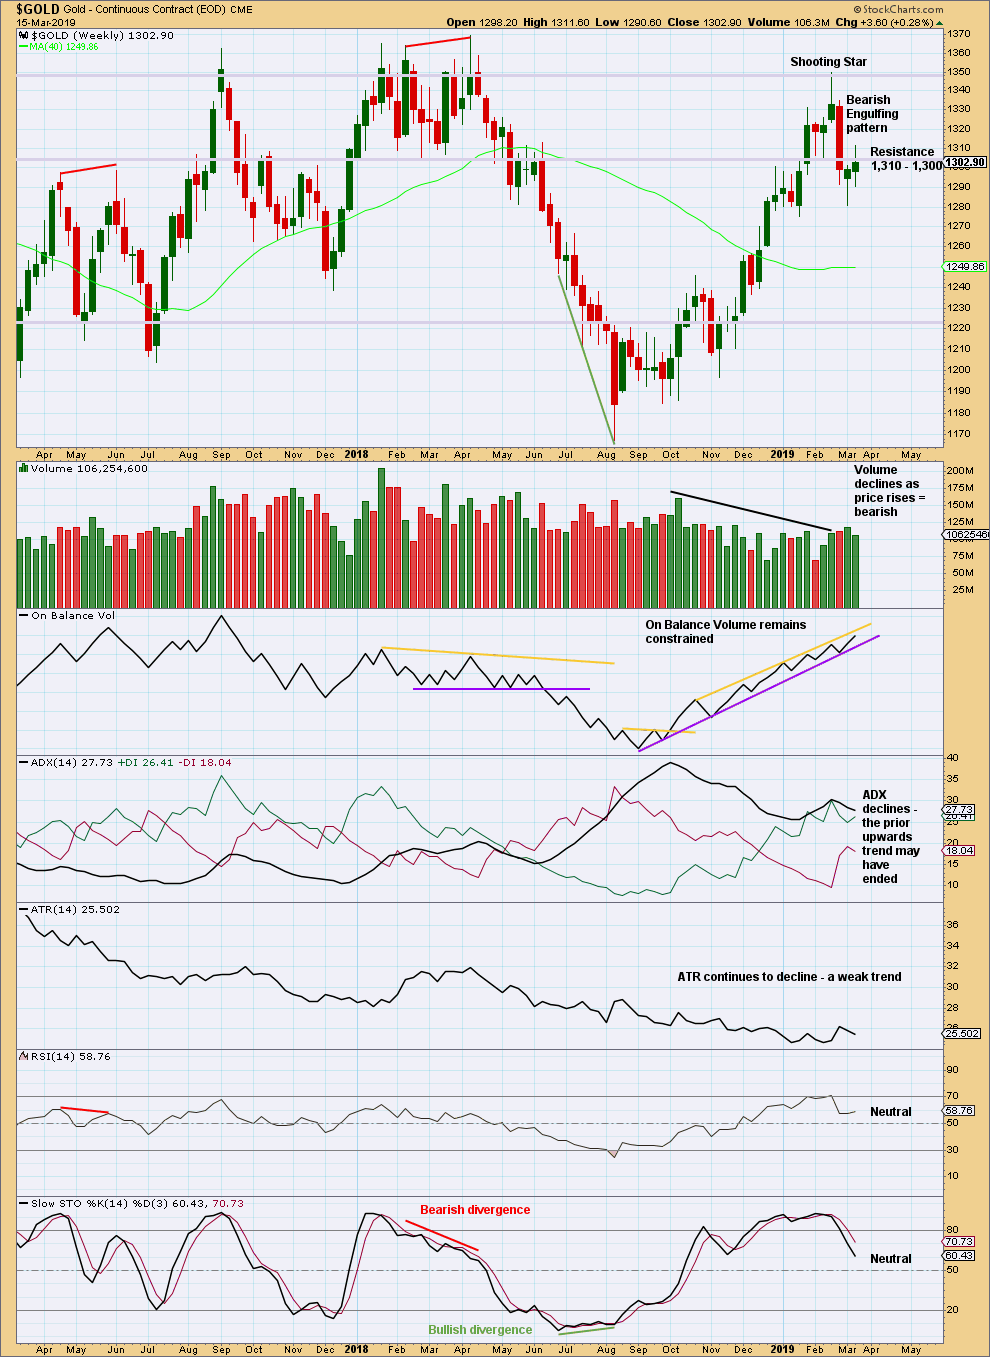
Click chart to enlarge. Chart courtesy of StockCharts.com.
There are now two bearish candlestick reversal patterns on the weekly chart: a Shooting Star and a Bearish Engulfing pattern. This supports the view that a high is in place.
For the short term, price has not managed to close back above strong resistance at 1,310. This upwards bounce looks like a typical back test of resistance, which was prior support.
DAILY CHART
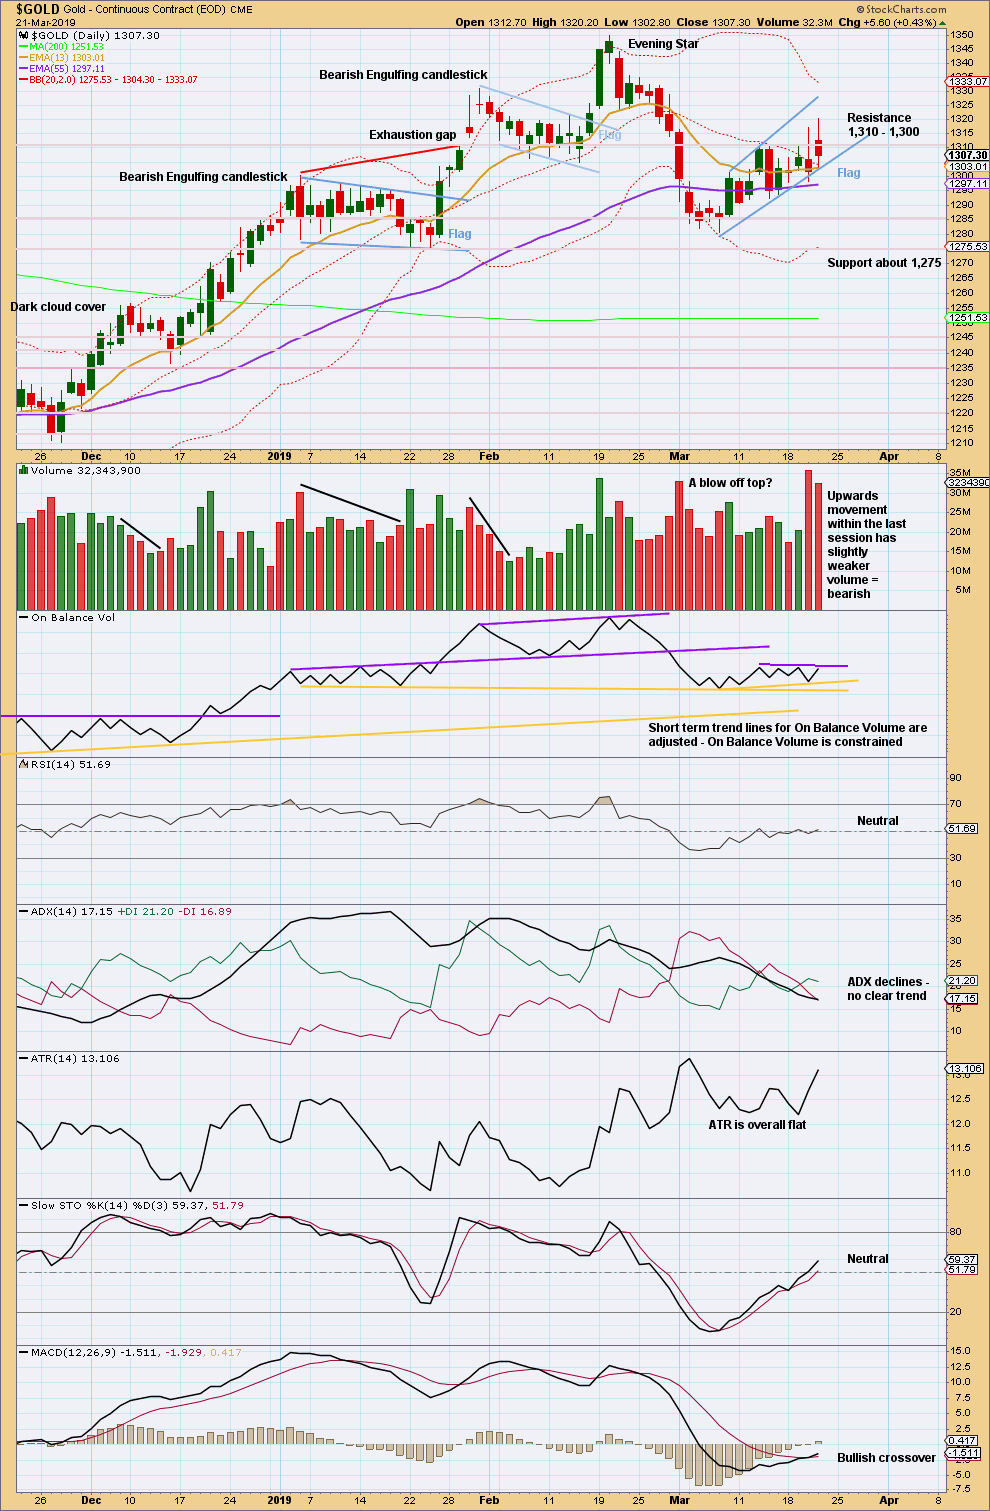
Click chart to enlarge. Chart courtesy of StockCharts.com.
Price has not managed to close above resistance at 1,310. It has quickly reversed.
The short-term volume profile is unclear. Overall, it looks slightly bearish (but not clear enough for confidence).
On Balance Volume yesterday gave a short-term bearish signal with a break below a short-term support line, but today it broke back above that line. Both short-term resistance and support lines are adjusted today.
The flag pattern remains valid. The best performing flags and pennants complete within 14 sessions. So far this one has lasted 10 sessions. Flags are reliable continuation patterns. A downwards breakout would be expected. The target calculated using the flag pole is about 1,236.
GDX WEEKLY CHART
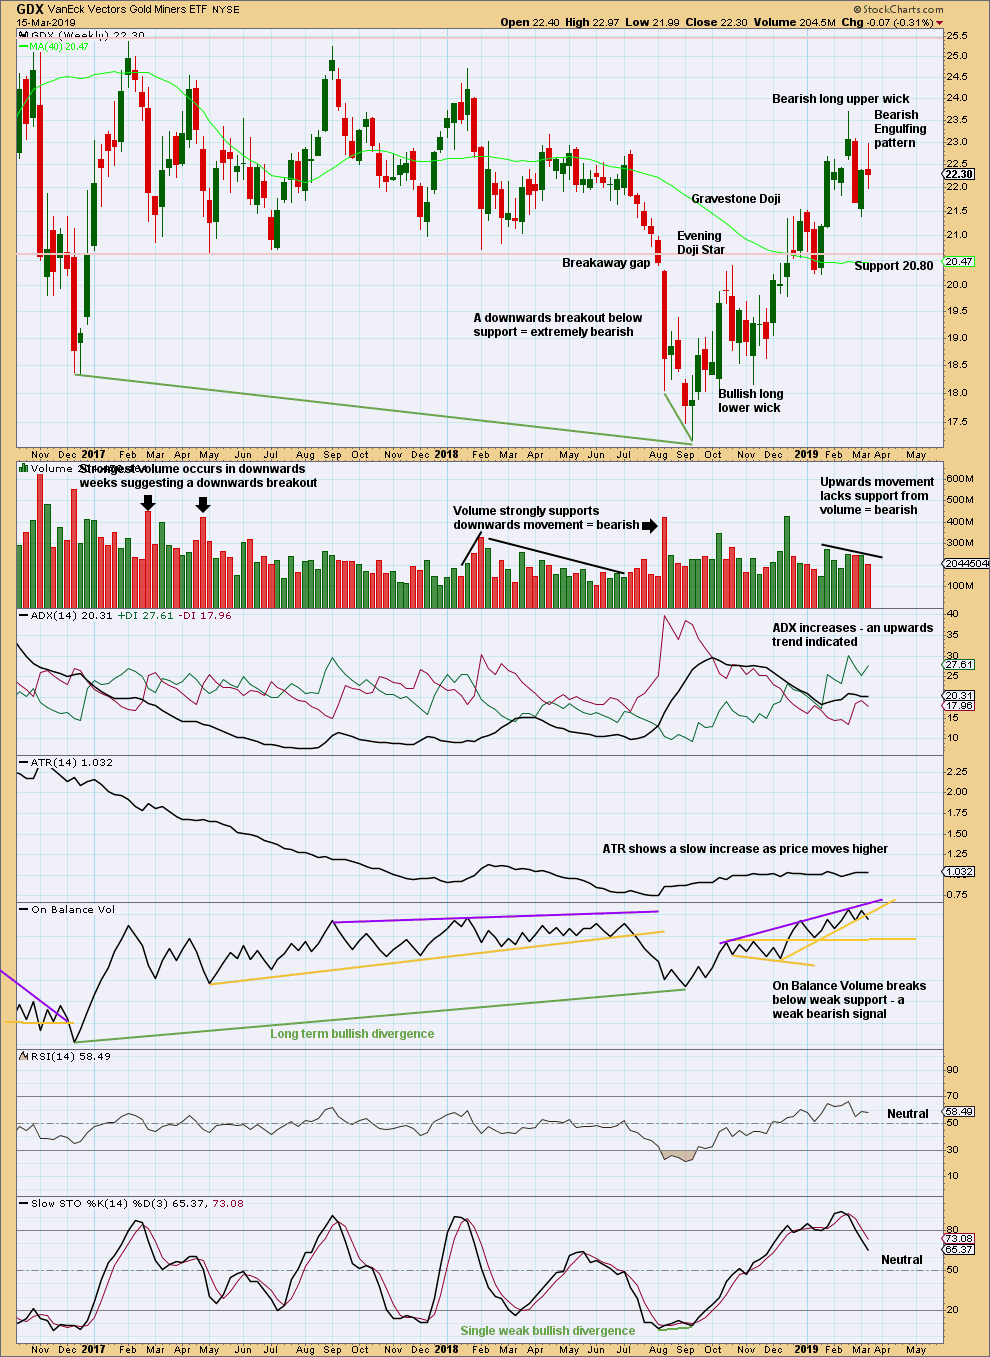
Click chart to enlarge. Chart courtesy of StockCharts.com.
The Bearish Engulfing pattern at the weekly chart level should still be given weight in this analysis. It signals an end to the upwards trend and a new downwards or sideways trend.
Last week completes an upwards week with the balance of volume down. The short-term volume profile should be judged on the daily chart. The mid-term profile is bearish. On Balance Volume is bearish.
Although ADX now indicates an upwards trend, this may be treated with some suspicion. A new swing low below the prior low of the week beginning 22nd January at 20.22 would confirm a trend change.
GDX DAILY CHART
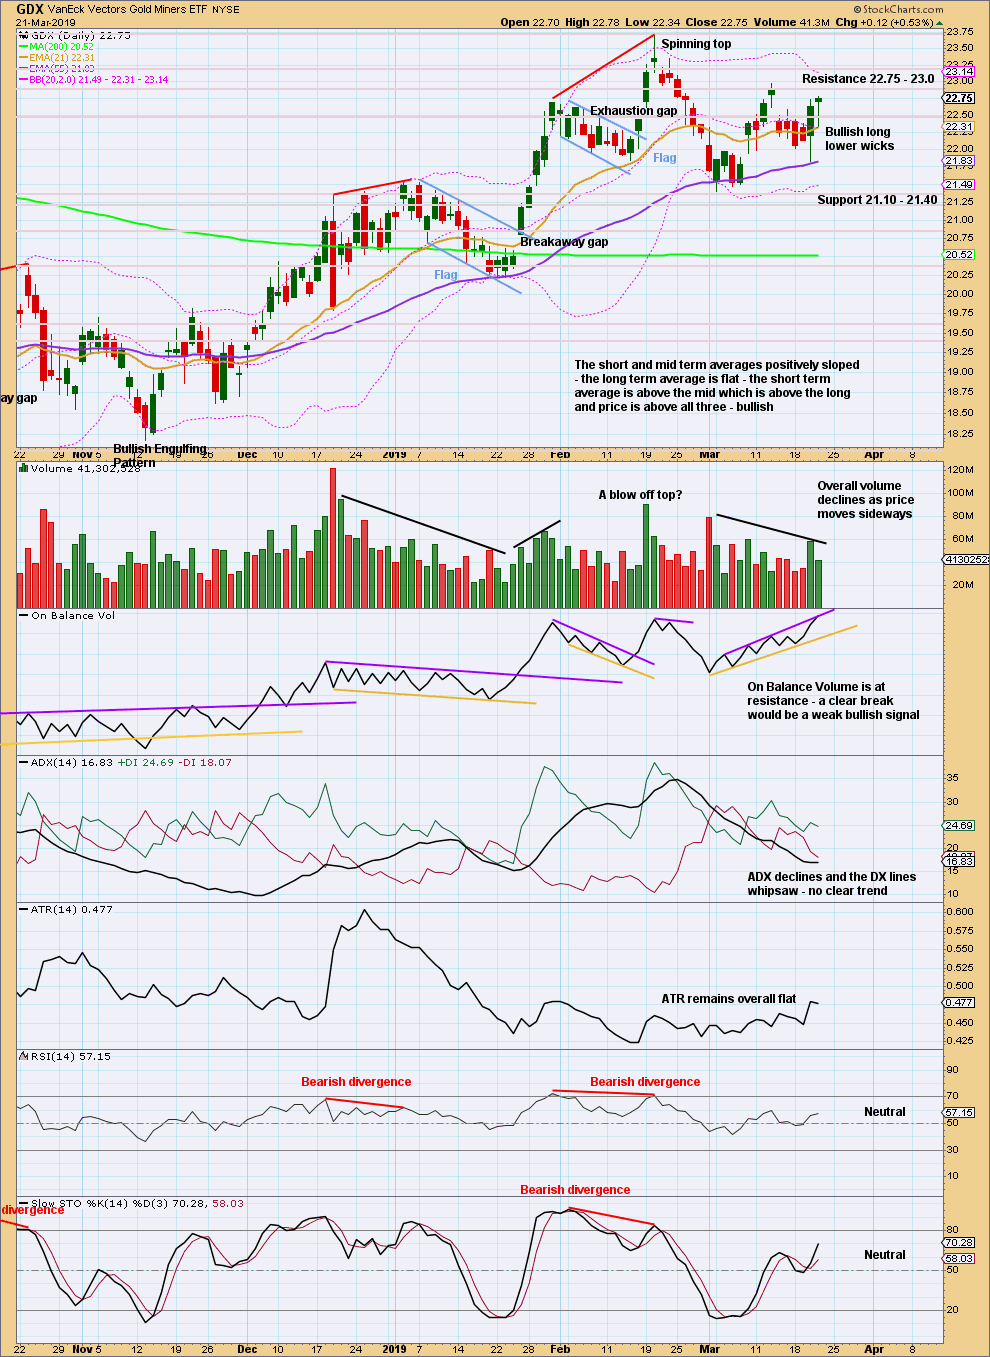
Click chart to enlarge. Chart courtesy of StockCharts.com.
Price is now range bound with resistance about 22.75 – 23 and support about 21.40. A breakout is required to indicate the next direction. An upwards breakout requires support from volume for confidence, a downwards breakout does not.
On Balance Volume is making highs prior to price. This favours an upwards breakout.
Published @ 10:10 p.m. EST.
—
Careful risk management protects your trading account(s).
Follow my two Golden Rules:
1. Always trade with stops.
2. Risk only 1-5% of equity on any one trade.
Hourly chart updated:
Minute ii now fits as a zigzag very nicely and has reached the 0.618 Fibonacci ratio. This looks like it may be complete.
This count now expects to see a third wave down at two degrees begin here, to gather strength next week. At its end it may see a capitulation spike, very strong downwards movement which may have support from volume.
3-21-19 [prepped, not sent]
Lara, many investing gurus at kitco and elsewhere are predicting gold to 1400 this year. Nick’s comments on yesterday’s posting thinks the current price moves are leaning toward a big-picture bull count (correction within). Dreamer agrees there’s room in the upcoming months for price to rise upward– looking at the double ziz-zag weekly. I guess if the Double Zig-zag primary x wave completed by Aug/Sept, an upturn could run thru the end of this year. Just speculating.
Intermed A lasted about _5_ months
Intermed B lasted about _12_ months
Intermed C lasted about _8_ months
Intermed D lasted about _6_months
Intermed E ?? end in August/Sept
The Double ZigZag does seem to appease both the EWG current downard count and the kitco/analyist year-end projection.
Ah, but can the current EWG downward projection turn into a corrective wave within the alternate weekly bull count?? Could I see your wave count on that in a daily/hrly chart? Hope that is not too much work to ask of you.
dsprospering wisdom: when life gives you lemons don’t put them in a broken fridge.
(yes my fridge is broken) 🙂 🙁
ds, nice to see you posting…. I think Int wave E could be complete around July, but it will take a bit longer for confirmation on the correct count. It’s going to be so nice when this giant triangle is done and we finally get some larger impulses!
Maybe we could get Lara to update her $USD chart. Last update was Nov.
If you want to take a look, EWI has free pro week until next Wed with counts for Gold and USD, among others.
The double ZZ count does fit a very bullish scenario.
For now, both the main count and the double ZZ count need to see the next five down complete. The main count is labelling this 1-2-3 at minor degree. The double ZZ count would label it A-B-C at minor degree.
When that is complete then at the daily and hourly chart time frames the counts will diverge. At that point it will then be necessary for me to provide a daily and hourly count for the double ZZ count as well as the preferred count.
That’s when I’ll do it.
And 1,160.75 is the price point that differentiates them.
Intermediate (E) is the last shortest wave in a triangle. So I’d expect it to be more brief than all the other waves. August / September would be the longest I’d expect it to go. Maybe June / July?