
A bounce on Friday remains below the short-term invalidation point for the hourly Elliott wave count. The mid and long-term targets remain the same.
Summary: Three long-term targets are now calculated for cycle wave c to end. Confidence in a new downwards trend may be had with a new low below 1,160.75.
The mid-term target for a third wave down is at 1,217. A target calculated using the flag is about 1,236.
For the short term, a breach of the best fit channel on the daily and hourly charts would add some confidence that the downwards trend has resumed.
New updates to this analysis are in bold.
Grand SuperCycle analysis is here.
Last monthly charts are here. Video is here.
MAIN ELLIOTT WAVE COUNT
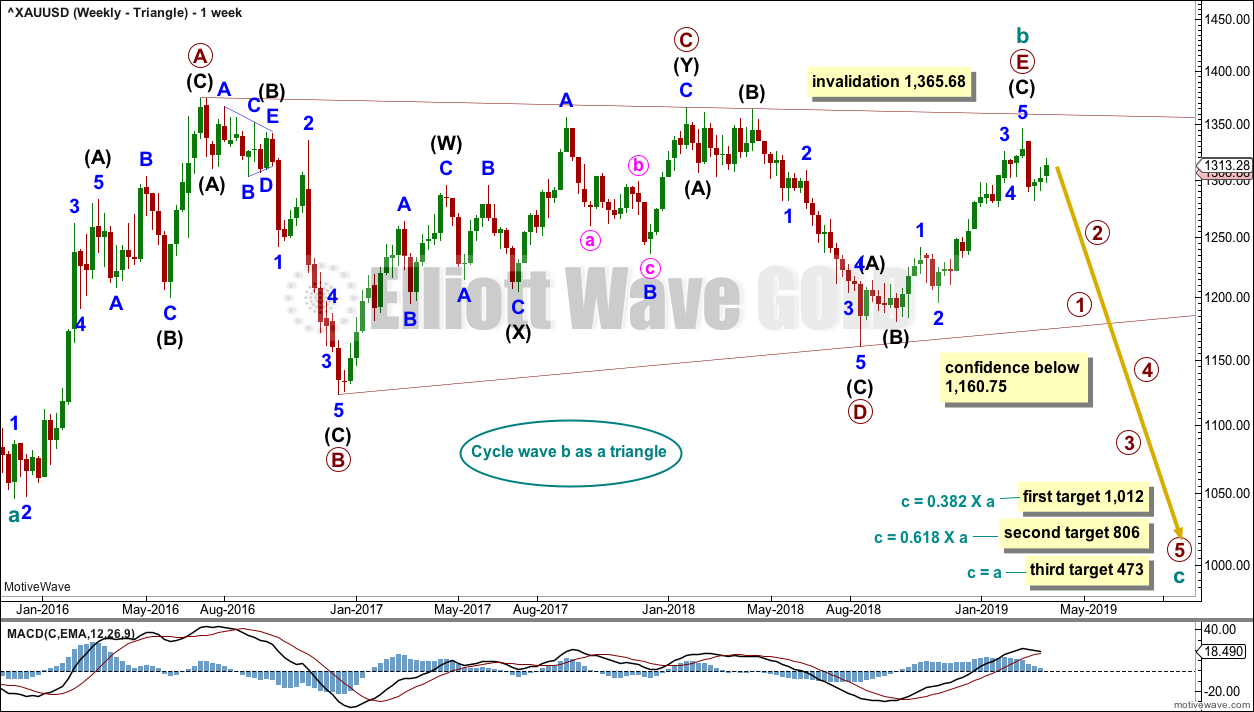
WEEKLY CHART – TRIANGLE
Click chart to enlarge.
This is the preferred wave count.
Cycle wave b may be a complete regular contracting triangle. If it continues further, then primary wave E may not move beyond the end of primary wave C above 1,365.68.
Four of the five sub-waves of a triangle must be zigzags, with only one sub-wave allowed to be a multiple zigzag. Wave C is the most common sub-wave to subdivide as a multiple, and this is how primary wave C for this example fits best.
There are no problems in terms of subdivisions or rare structures for this wave count. It has an excellent fit and so far a typical look.
This wave count would expect a cycle degree trend change has recently occurred. Cycle wave c would most likely make new lows below the end of cycle wave a at 1,046.27 to avoid a truncation.
Primary wave E should exhibit reasonable weakness as it comes to an end. Triangles often end with declining ATR, weak momentum and weak volume.
If this weekly wave count is correct, then cycle wave c downwards should develop strength, ATR should show some increase, and MACD should exhibit an increase in downwards momentum.
Three targets are calculated for cycle wave c. Cycle wave a lasted 4.25 years. Cycle wave b may be over in 3.17 years. Cycle wave c may last a minimum of 2 years and possibly up to 5 years.
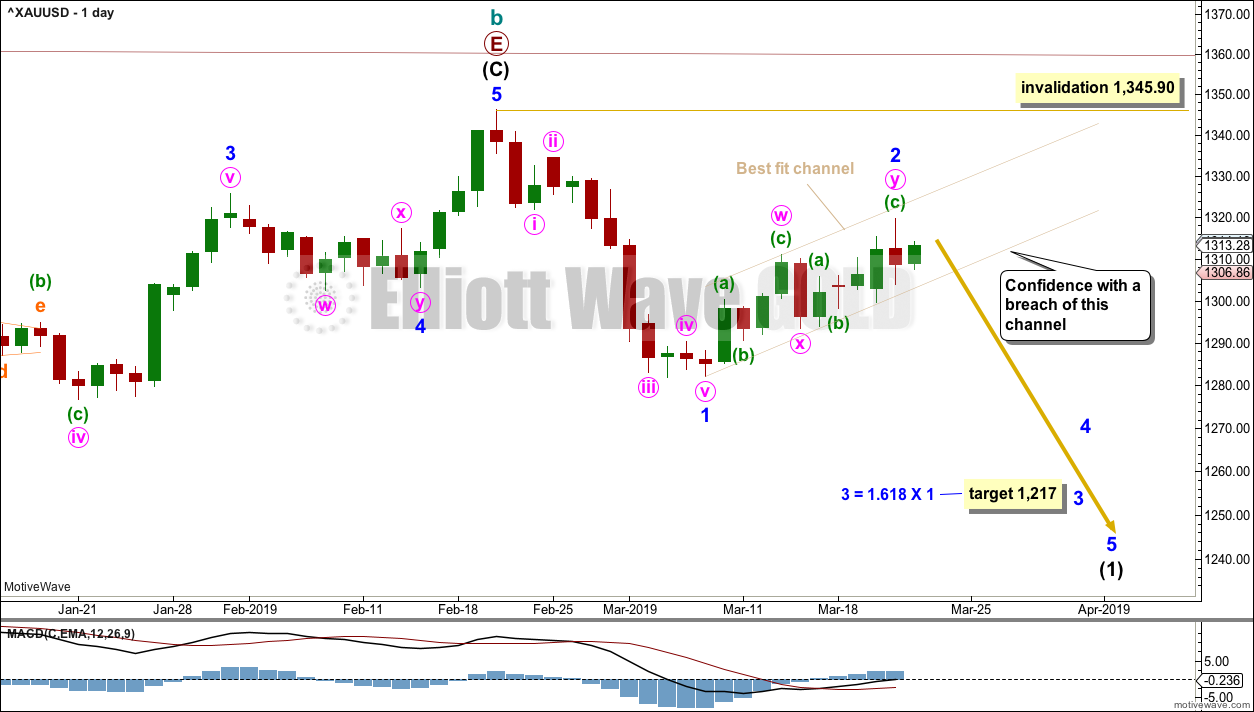
DAILY CHART – TRIANGLE
Click chart to enlarge.
Cycle wave c must subdivide as a five wave structure, either an impulse or an ending diagonal. An impulse is much more common and that shall be how it is labelled unless overlapping suggests a diagonal should be considered.
A new trend at cycle degree should begin with a five wave structure on the daily chart, which will be labelled minor wave 1.
Minor wave 2 subdivides well as a double zigzag on the hourly chart and now looks complete. A best fit channel is drawn about minor wave 2. Copy this over to the hourly chart. When this channel is breached by a full daily candlestick below and not touching the lower edge, that would provide strong confidence that minor wave 2 should be over and minor wave 3 should be underway.
Minor wave 2 may not move beyond the start of minor wave 1 above 1,345.90. The invalidation point will remain the same while price remains within the channel. The risk that minor wave 2 may still continue higher remains.
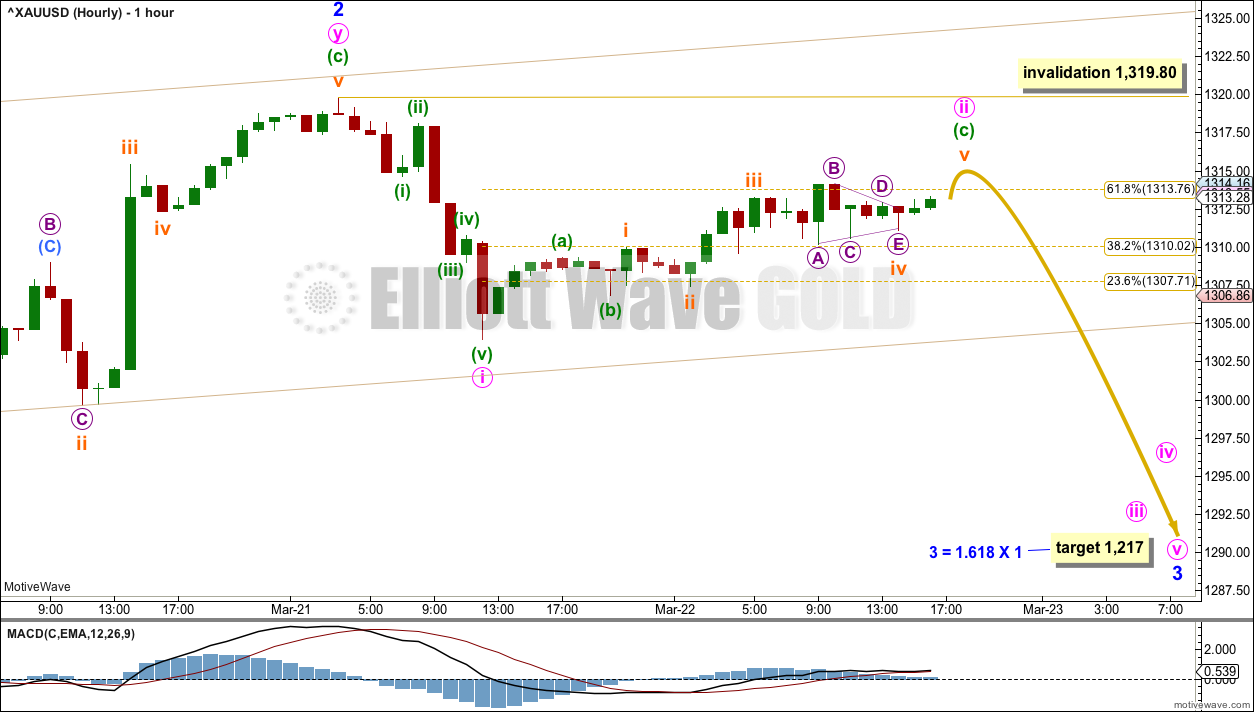
HOURLY CHART
Click chart to enlarge.
Double zigzags are fairly common structures for second waves.
The second zigzag labelled minute wave y now fits as a completed structure.
There now looks to be a completed five wave impulse downwards. This is labelled minute wave i. Minute wave ii may now continue a little higher ending about the 0.618 Fibonacci ratio.
Thereafter, minute wave iii of minor wave 3 should have the power to break below the lower edge of the best fit channel, and below support about 1,300.
A new target is calculated for minor wave 3; it expects to exhibit the most common Fibonacci ratio to minor wave 1.
Minute wave ii may not move beyond the start of minute wave i above 1,319.80.
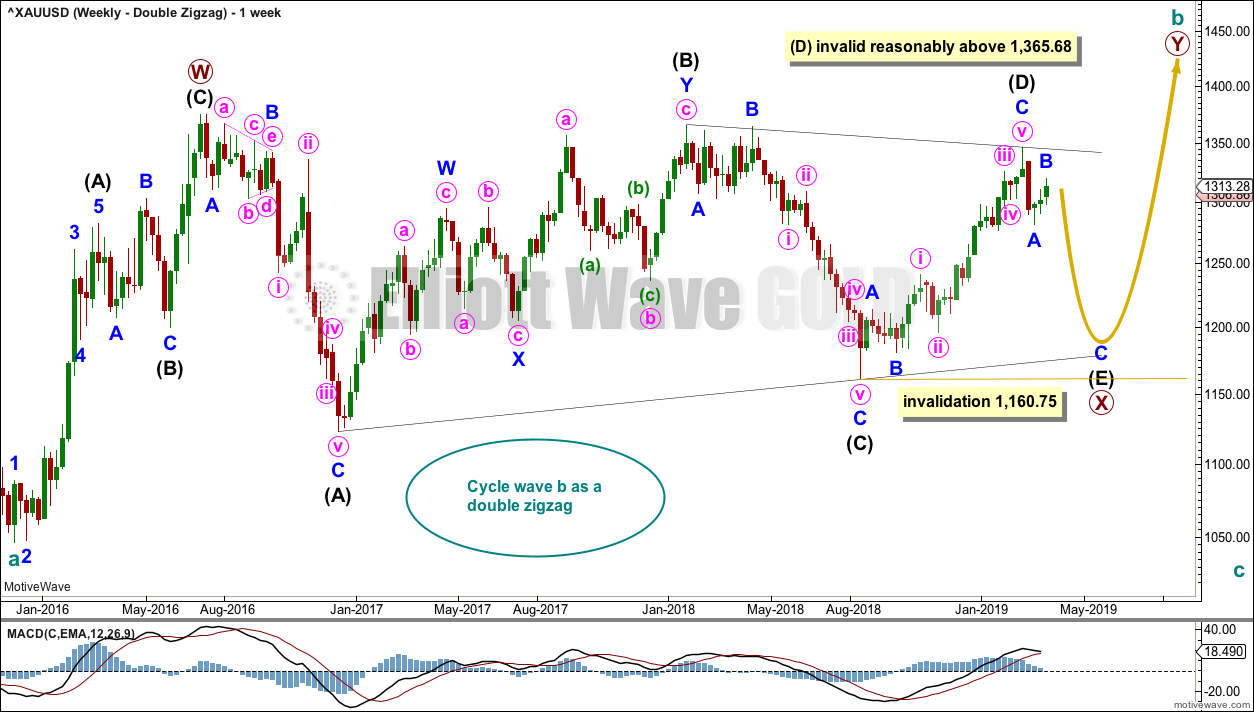
WEEKLY CHART – DOUBLE ZIGZAG
Click chart to enlarge.
It is possible that cycle wave b may be an incomplete double zigzag or a double combination.
The first zigzag in the double is labelled primary wave W. This has a good fit.
The double may be joined by a corrective structure in the opposite direction, a triangle labelled primary wave X. The triangle would be about four fifths complete.
Within multiples, X waves are almost always zigzags and rarely triangles. Within the possible triangle of primary wave X, it is intermediate wave (B) that is a multiple; this is acceptable, but note this is not the most common triangle sub-wave to subdivide as a multiple. These two points reduce the probability of this wave count.
Intermediate wave (D) may be complete. The (B)-(D) trend line is almost perfectly adhered to with the smallest overshoot within intermediate wave (C). This is acceptable.
Intermediate wave (E) should continue to exhibit weakness: ATR should continue to show a steady decline, and MACD may begin to hover about zero.
Intermediate wave (E) may not move beyond the end of intermediate wave (C) below 1,160.75.
This wave count may now expect downwards movement for several weeks.
Primary wave Y would most likely be a zigzag because primary wave X would be shallow; double zigzags normally have relatively shallow X waves.
Primary wave Y may also be a flat correction if cycle wave b is a double combination, but combinations normally have deep X waves. This would be less likely.
This wave count has good proportions and no problems in terms of subdivisions.
Intermediate wave (E) should subdivide as a zigzag labelled minor waves A-B-C. Zigzags subdivide 5-3-5, exactly the same the start of an impulse.
The preferred wave count labels downwards movement minor waves 1-2-3, and this wave count labels downwards movement minor waves A-B-C. At the daily and hourly chart levels, the subdivisions for both wave counts are seen in the same way.
ALTERNATE ELLIOTT WAVE COUNT
WEEKLY CHART
Click chart to enlarge.
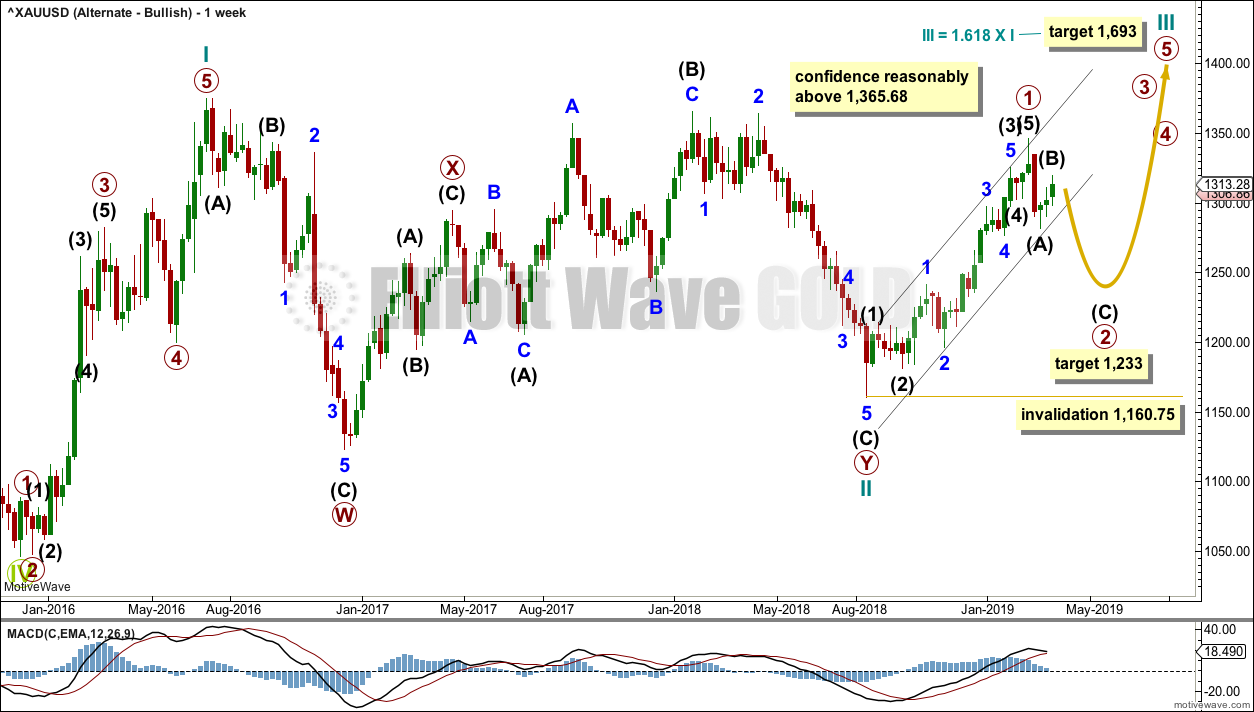
If Gold is in a new bull market, then it should begin with a five wave structure upwards on the weekly chart. However, the biggest problem with this wave count is the structure labelled cycle wave I because this wave count must see it as a five wave structure, but it looks more like a three wave structure.
Commodities often exhibit swift strong fifth waves that force the fourth wave corrections coming just prior to be more brief and shallow than their counterpart second waves. It is unusual for a commodity to exhibit a quick second wave and a more time consuming fourth wave, and this is how cycle wave I is labelled. The probability of this wave count is low due to this problem.
Cycle wave II subdivides well as a double combination: zigzag – X – expanded flat.
Cycle wave III may have begun. Within cycle wave III, primary wave 1 may now be complete. The target for primary wave 2 is the 0.618 Fibonacci ratio of primary wave 1. Primary wave 2 may not move beyond the start of primary wave 1 below 1,160.75.
A black channel is drawn about primary wave 1. Primary wave 2 may breach the lower edge of this channel.
Cycle wave III so far for this wave count would have been underway now for 27 weeks. It should be beginning to exhibit some support from volume, increase in upwards momentum and increasing ATR. However, volume continues to decline, ATR continues to decline and is very low, and momentum is weak in comparison to cycle wave I. This wave count lacks support from classic technical analysis.
TECHNICAL ANALYSIS
WEEKLY CHART
Click chart to enlarge. Chart courtesy of StockCharts.com.
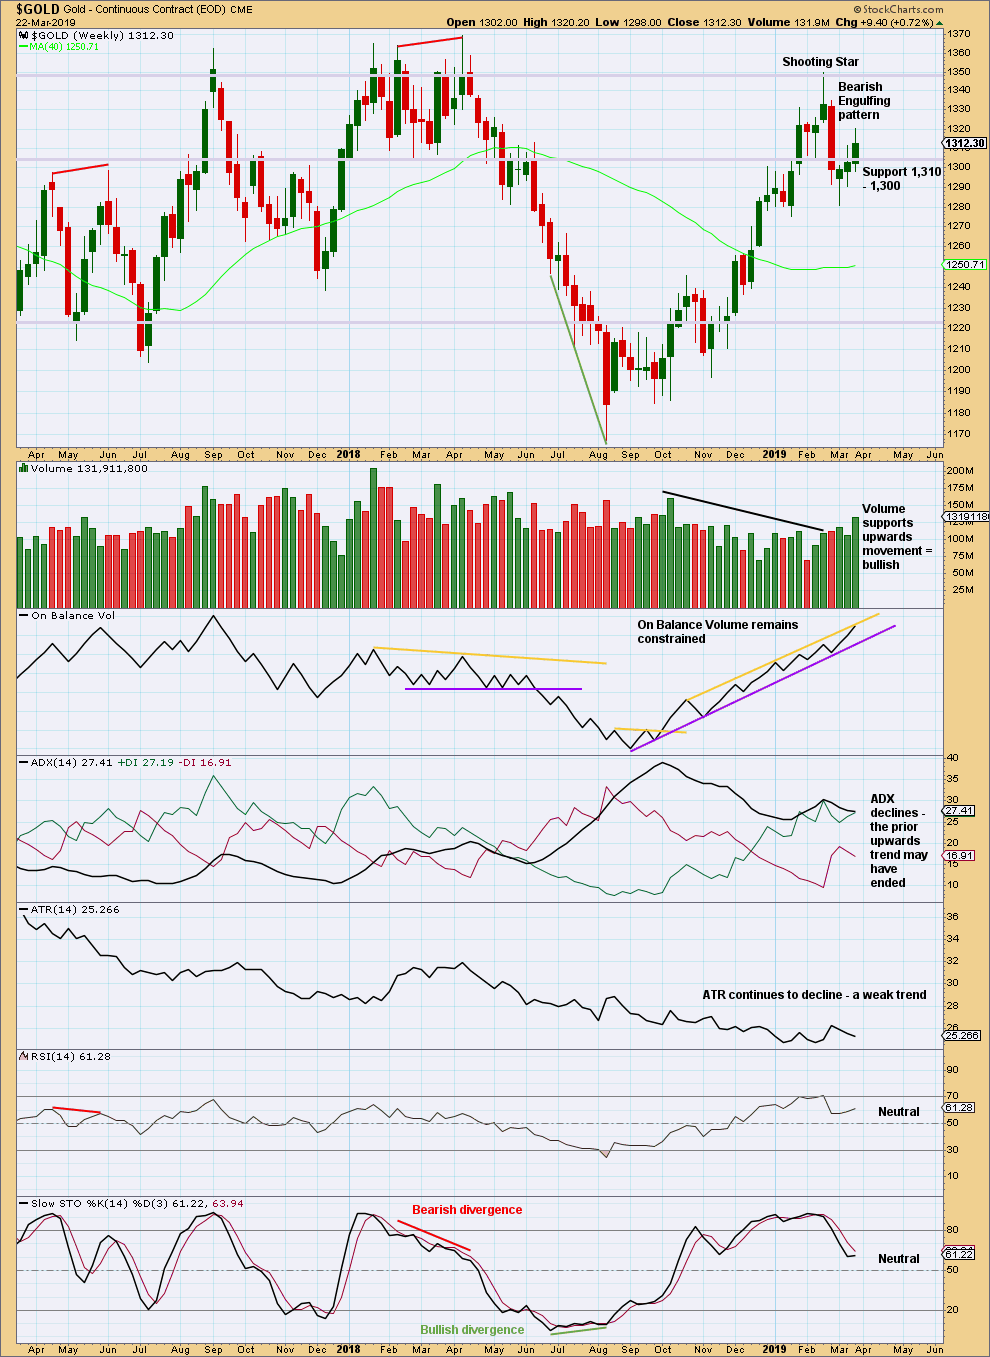
Support from volume for upwards movement suggests more upwards movement next week.
Support about 1,310 – 1,300 was breached by downwards movement, and resistance there has now been breached by upwards movement. This area of prior strong support and resistance has by now been weakened.
DAILY CHART
Click chart to enlarge. Chart courtesy of StockCharts.com.
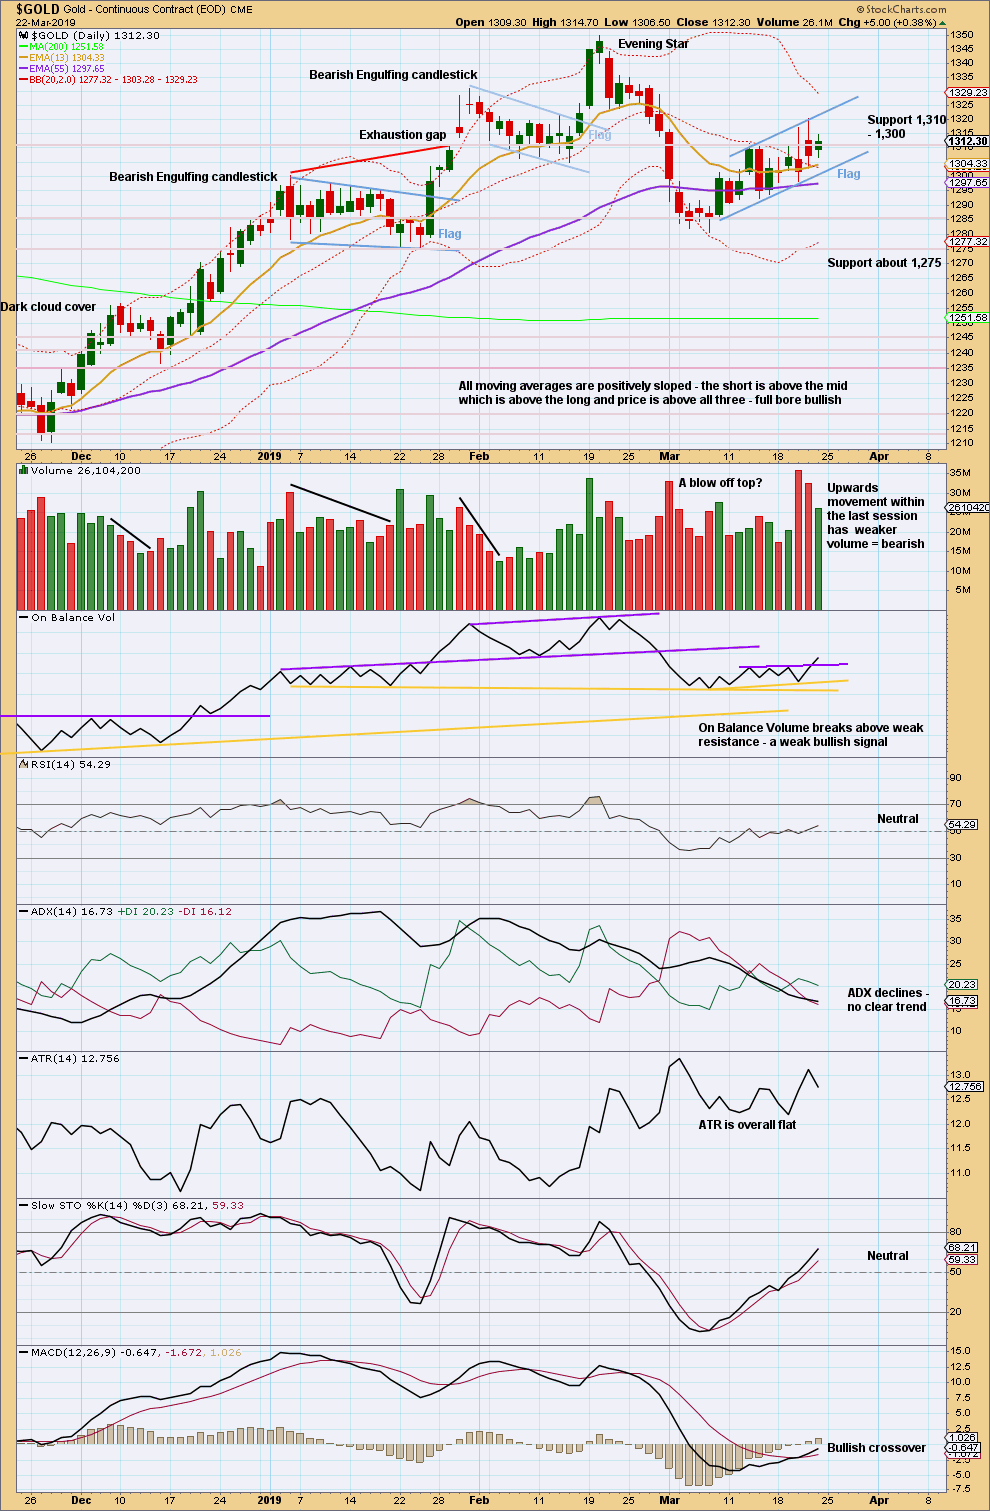
The short-term volume profile is unclear. Overall, it looks slightly bearish (but not clear enough for confidence).
The bullish signal from On Balance Volume today is not strong; the trend line breached has not been long held.
The flag pattern remains valid. The best performing flags and pennants complete within 14 sessions. So far this one has lasted 11 sessions. Flags are reliable continuation patterns. A downwards breakout would be expected. The target calculated using the flag pole is about 1,236.
GDX WEEKLY CHART
Click chart to enlarge. Chart courtesy of StockCharts.com.
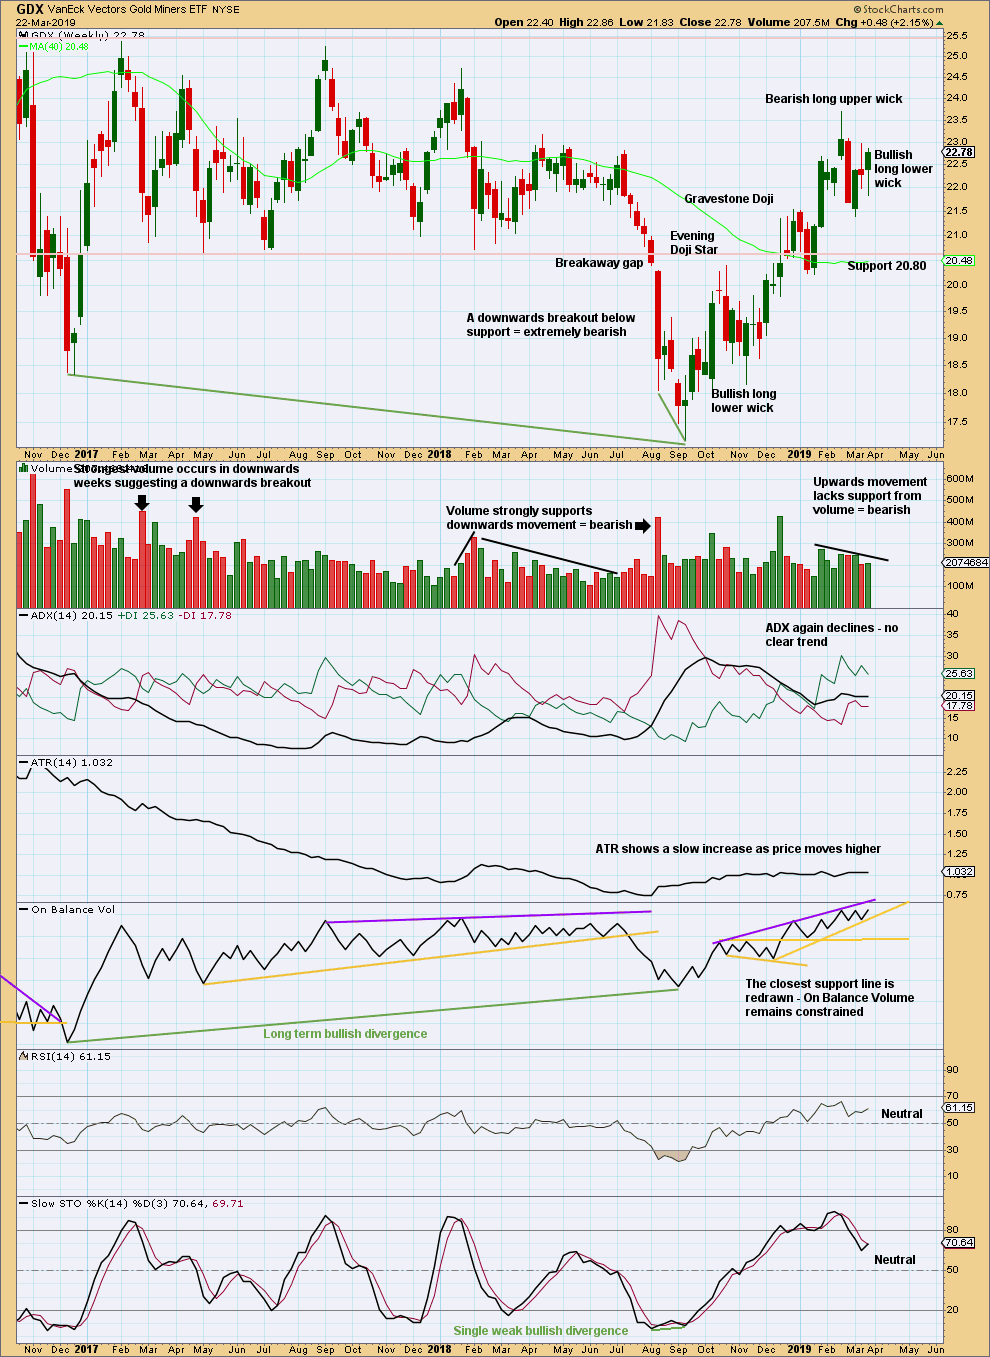
A new swing low below the prior low of the week beginning 22nd January at 20.22 would confirm a trend change. For now GDX may be assumed to remain in an upwards trend. There is a series of higher highs and higher lows from the low in September 2018.
For the short term, a bullish long lower wick and price closing near the high for the week suggest more upwards movement next week.
GDX DAILY CHART
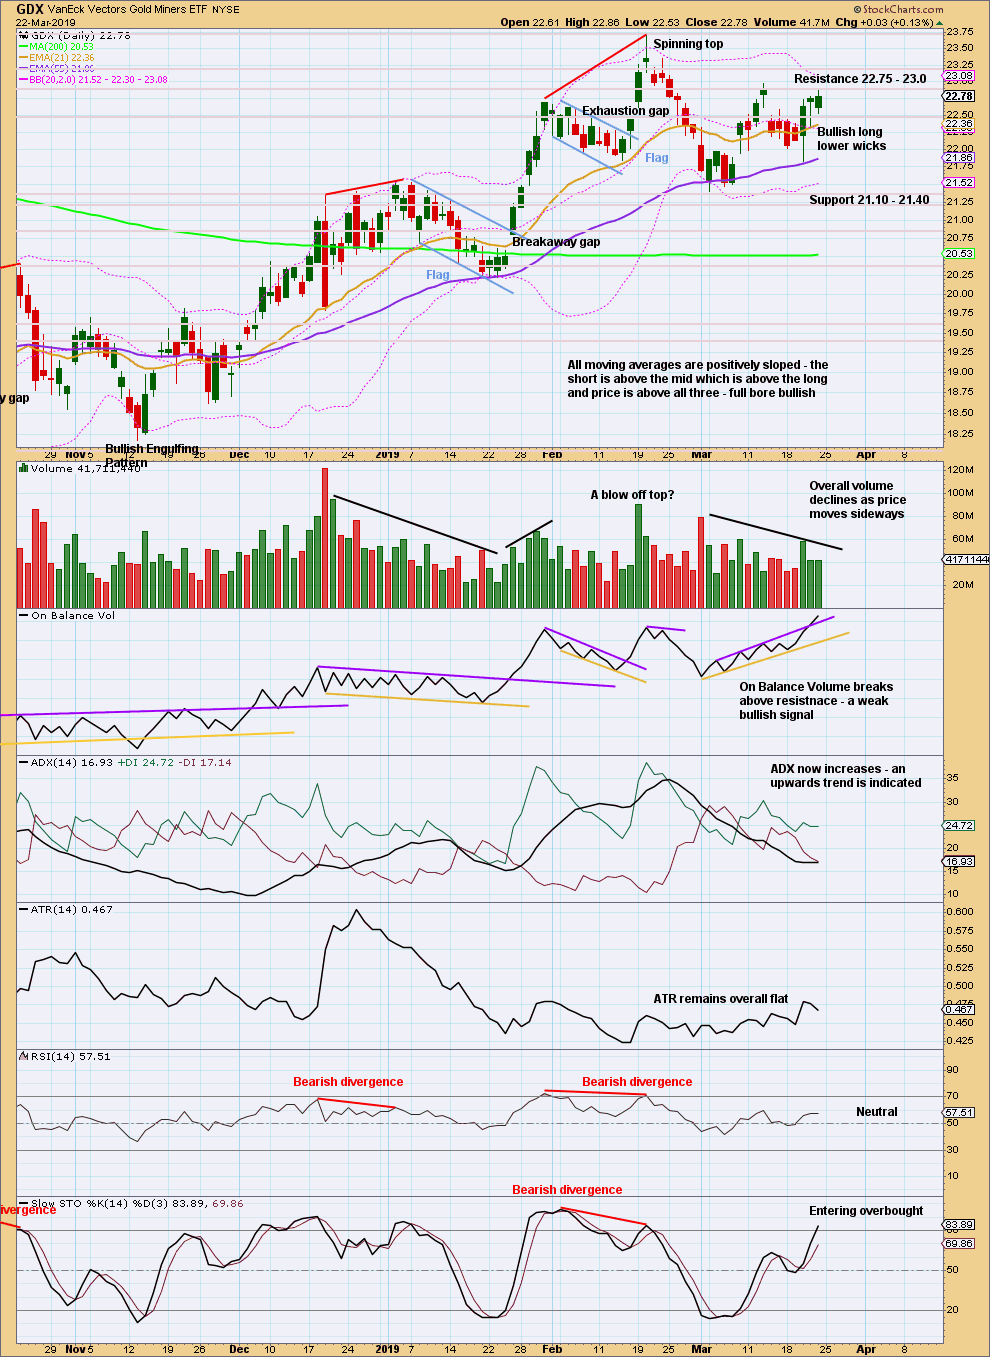
Click chart to enlarge. Chart courtesy of StockCharts.com.
Price is now range bound with resistance about 22.75 – 23 and support about 21.40. A breakout is required to indicate the next direction. An upwards breakout requires support from volume for confidence, a downwards breakout does not.
On Balance Volume is making highs prior to price. This favours an upwards breakout.
Published @ 11:26 p.m. EST.
—
Careful risk management protects your trading account(s).
Follow my two Golden Rules:
1. Always trade with stops.
2. Risk only 1-5% of equity on any one trade.
The double zigzag is invalidated.
The best fit now for subdivisions of this upwards movement is a triple zigzag. This is a rare structure, but I have seen a few.
Because of the rarity I did not consider this as likely to happen.
Minor 2 continues and might be ending with an expanding diagonal?
To Lara , Dreamer: thank you both for your comments/response on 3-21-19.
Hrly chart recently invalidated.
Yes , powerful move up that, got stopped out this time.