
Price continues lower as the Elliott wave counts expect. Today volume and ATR suggest this may end soon. Resistance is identified for a potential bounce.
Summary: Three long-term targets are now calculated for cycle wave c to end. Confidence in a new downwards trend may be had with a new low below 1,160.75.
For the short term, minor wave 1 may now be coming to an end. When it is complete, then expect a multi-day bounce or consolidation for minor wave 2. Expect minor wave 2 to find strong resistance about 1,300 – 1,310.
New updates to this analysis are in bold.
Grand SuperCycle analysis is here.
Last historic analysis with monthly charts is here.
MAIN ELLIOTT WAVE COUNT
WEEKLY CHART – TRIANGLE

Click chart to enlarge.
This is the preferred wave count.
Cycle wave b may be a complete regular contracting triangle. If it continues further, then primary wave E may not move beyond the end of primary wave C above 1,365.68.
Four of the five sub-waves of a triangle must be zigzags, with only one sub-wave allowed to be a multiple zigzag. Wave C is the most common sub-wave to subdivide as a multiple, and this is how primary wave C for this example fits best.
There are no problems in terms of subdivisions or rare structures for this wave count. It has an excellent fit and so far a typical look.
This wave count would expect a cycle degree trend change has just occurred. Cycle wave c would most likely make new lows below the end of cycle wave a at 1,046.27 to avoid a truncation.
Primary wave E should exhibit reasonable weakness as it comes to an end. Triangles often end with declining ATR, weak momentum and weak volume.
If this weekly wave count is correct, then cycle wave c downwards should develop strength, ATR should show some increase, and MACD should exhibit an increase in downwards momentum.
Three targets are calculated for cycle wave c. Cycle wave a lasted 4.25 years. Cycle wave b may be over in 3.17 years. Cycle wave c may last a minimum of 2 years and possibly up to 5 years.
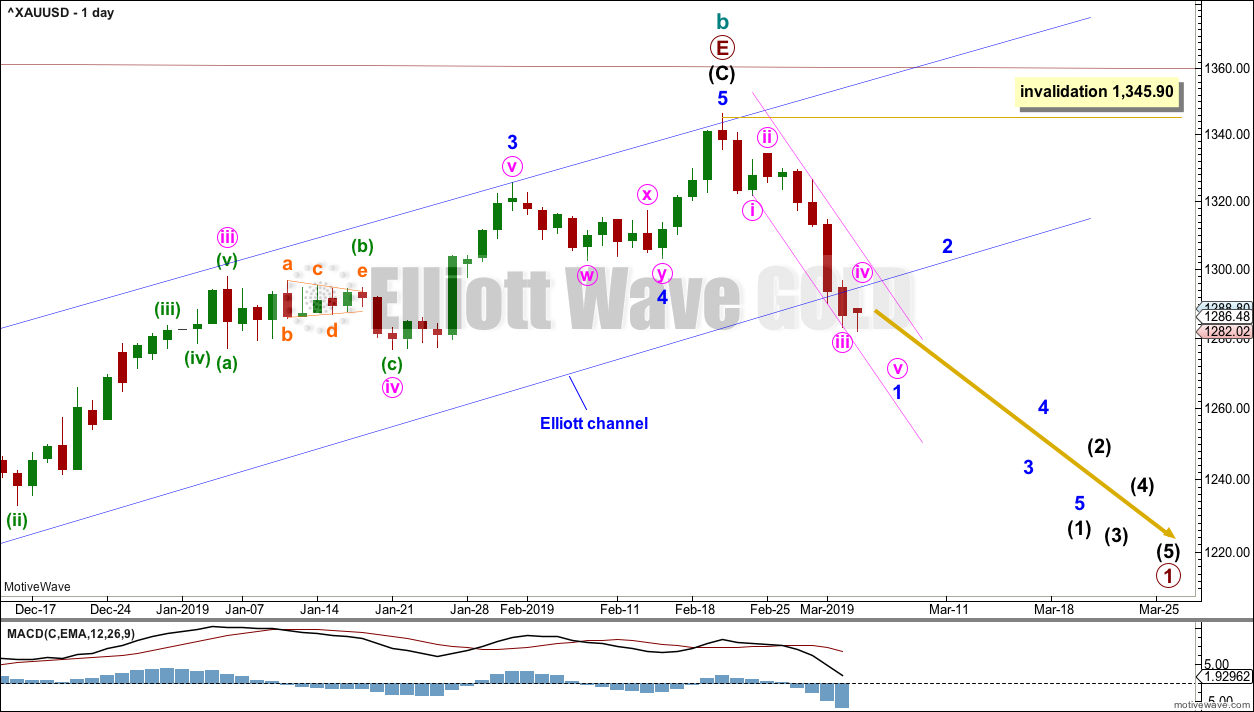
DAILY CHART – TRIANGLE
Click chart to enlarge.
Further confidence in this wave count may be had now that the blue channel is breached by a full daily candlestick below and not touching the lower edge.
Classic analysis offers good support to this wave count.
Cycle wave c must subdivide as a five wave structure, either an impulse or an ending diagonal. An impulse is much more common and that shall be how it is labelled unless overlapping suggests a diagonal should be considered.
A new trend at cycle degree should begin with a five wave structure on the daily chart, which will be labelled minor wave 1. When minor wave 1 is complete, then minor wave 2 may not move beyond its start above 1,345.90.
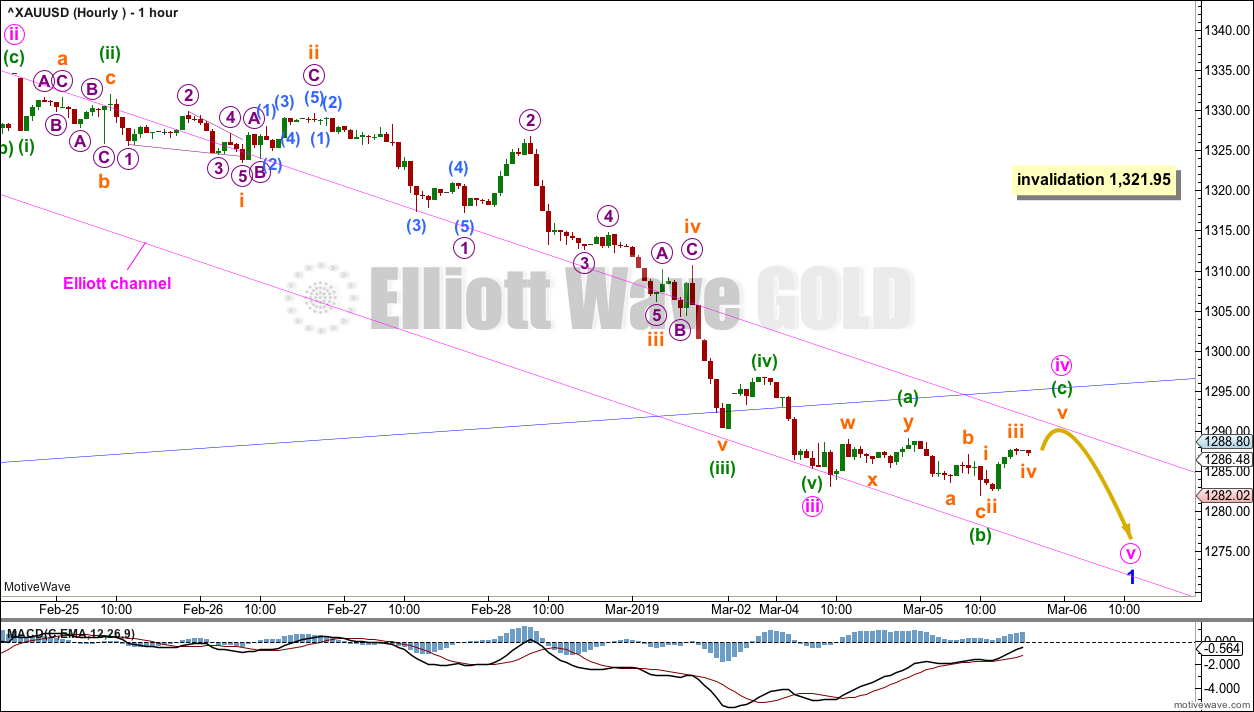
HOURLY CHART
Click chart to enlarge.
Minute waves i,ii and iii may be complete.
Minute wave iv may not move into minute wave i price territory above 1,321.95. Minute wave iv may be continuing sideways as an expanded flat correction. It may find resistance at the upper edge of the pink channel.
An Elliott channel is drawn about minor wave 1 using Elliott’s first technique. Although this channel does not contain all movement, it may still show where minute wave iv finds resistance. Minute wave iv may also find resistance about the lower edge of the wider blue channel, which is copied over from the daily chart.
When minor wave 1 may be complete, then minor wave 2 may unfold over a few days.
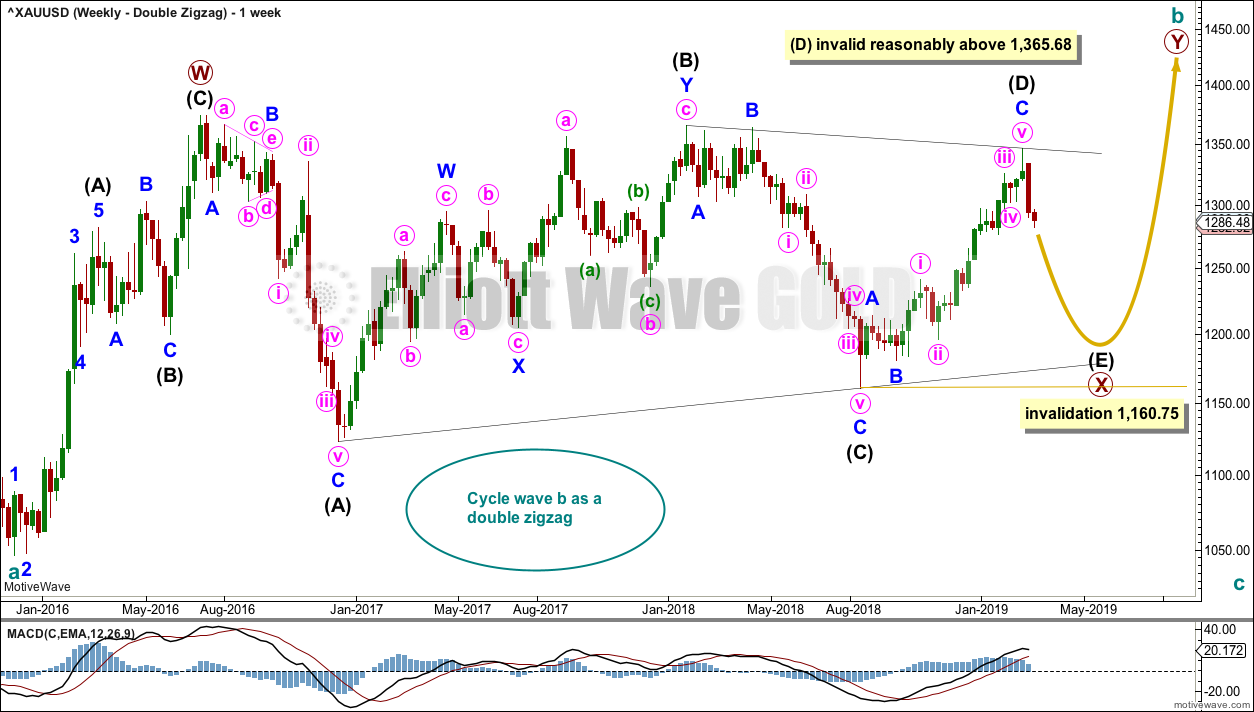
WEEKLY CHART – DOUBLE ZIGZAG
Click chart to enlarge.
It is possible that cycle wave b may be an incomplete double zigzag or a double combination.
The first zigzag in the double is labelled primary wave W. This has a good fit.
The double may be joined by a corrective structure in the opposite direction, a triangle labelled primary wave X. The triangle would be about four fifths complete.
Within multiples, X waves are almost always zigzags and rarely triangles. Within the possible triangle of primary wave X, it is intermediate wave (B) that is a multiple; this is acceptable, but note this is not the most common triangle sub-wave to subdivide as a multiple. These two points reduce the probability of this wave count.
Intermediate wave (D) may be complete. The (B)-(D) trend line is almost perfectly adhered to with the smallest overshoot within intermediate wave (C). This is acceptable.
Intermediate wave (E) should continue to exhibit weakness: ATR should continue to show a steady decline, and MACD may begin to hover about zero.
Intermediate wave (E) may not move beyond the end of intermediate wave (C) below 1,160.75.
This wave count may now expect downwards movement for several weeks.
Primary wave Y would most likely be a zigzag because primary wave X would be shallow; double zigzags normally have relatively shallow X waves.
Primary wave Y may also be a flat correction if cycle wave b is a double combination, but combinations normally have deep X waves. This would be less likely.
This wave count has good proportions and no problems in terms of subdivisions.
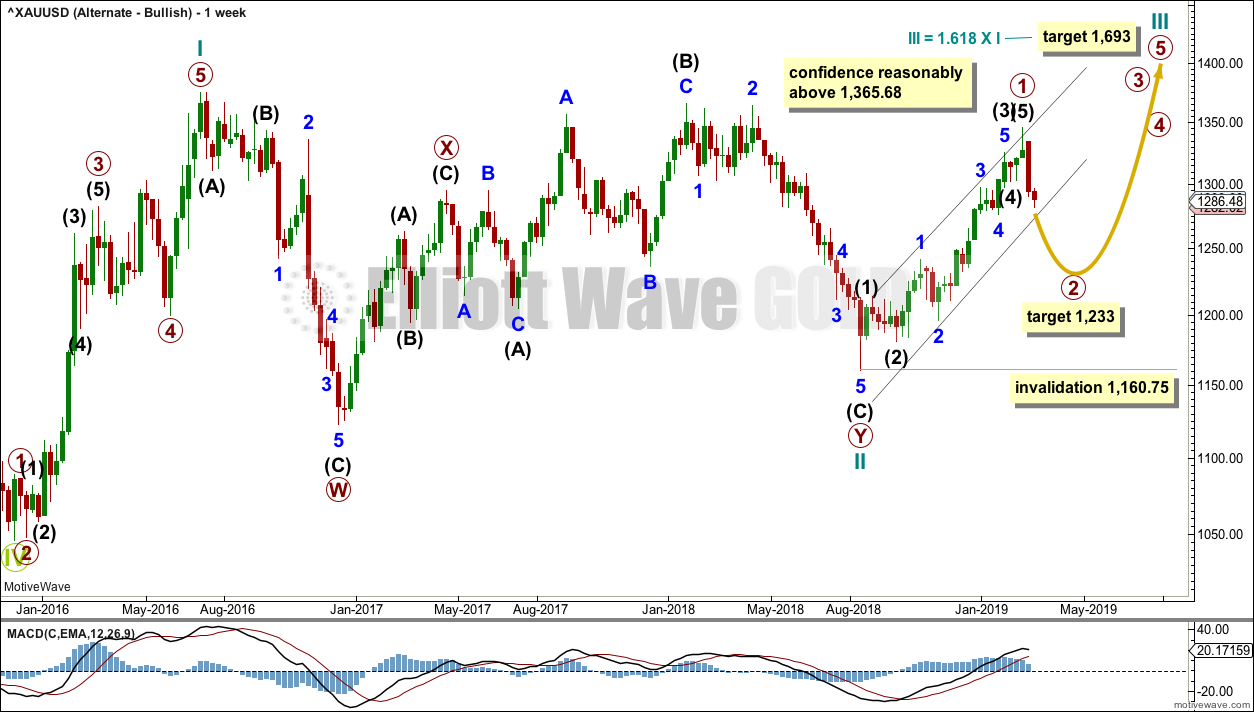
WEEKLY CHART – ALTERNATE BULLISH
Click chart to enlarge.
Because the preferred wave count is at a critical juncture in expecting a cycle degree trend change, it is time to consider an alternate which expects the continuation of the an upwards trend.
It is possible that the low in December 2015 was the end of a bear market and that Gold has been in a basing action for the past three years. Downwards movement to that low will subdivide as a double zigzag, a corrective structure.
If Gold is in a new bull market, then it should begin with a five wave structure upwards on the weekly chart. However, the biggest problem with this wave count is the structure labelled cycle wave I because this wave count must see it as a five wave structure, but it looks more like a three wave structure.
Commodities often exhibit swift strong fifth waves that force the fourth wave corrections coming just prior to be more brief and shallow than their counterpart second waves. It is unusual for a commodity to exhibit a quick second wave and a more time consuming fourth wave, and this is how cycle wave I is labelled. The probability of this wave count is low due to this problem.
Cycle wave II subdivides well as a double combination: zigzag – X – expanded flat.
Cycle wave III may have begun. Within cycle wave III, primary wave 1 may now be complete. The target for primary wave 2 is the 0.618 Fibonacci ratio of primary wave 1. Primary wave 2 may not move beyond the start of primary wave 1 below 1,160.75.
A black channel is drawn about primary wave 1. Primary wave 2 may breach the lower edge of this channel.
Cycle wave III so far for this wave count would have been underway now for 27 weeks. It should be beginning to exhibit some support from volume, increase in upwards momentum and increasing ATR. However, volume continues to decline, ATR continues to decline and is very low, and momentum is weak in comparison to cycle wave I. This wave count lacks support from classic technical analysis.
TECHNICAL ANALYSIS
WEEKLY CHART
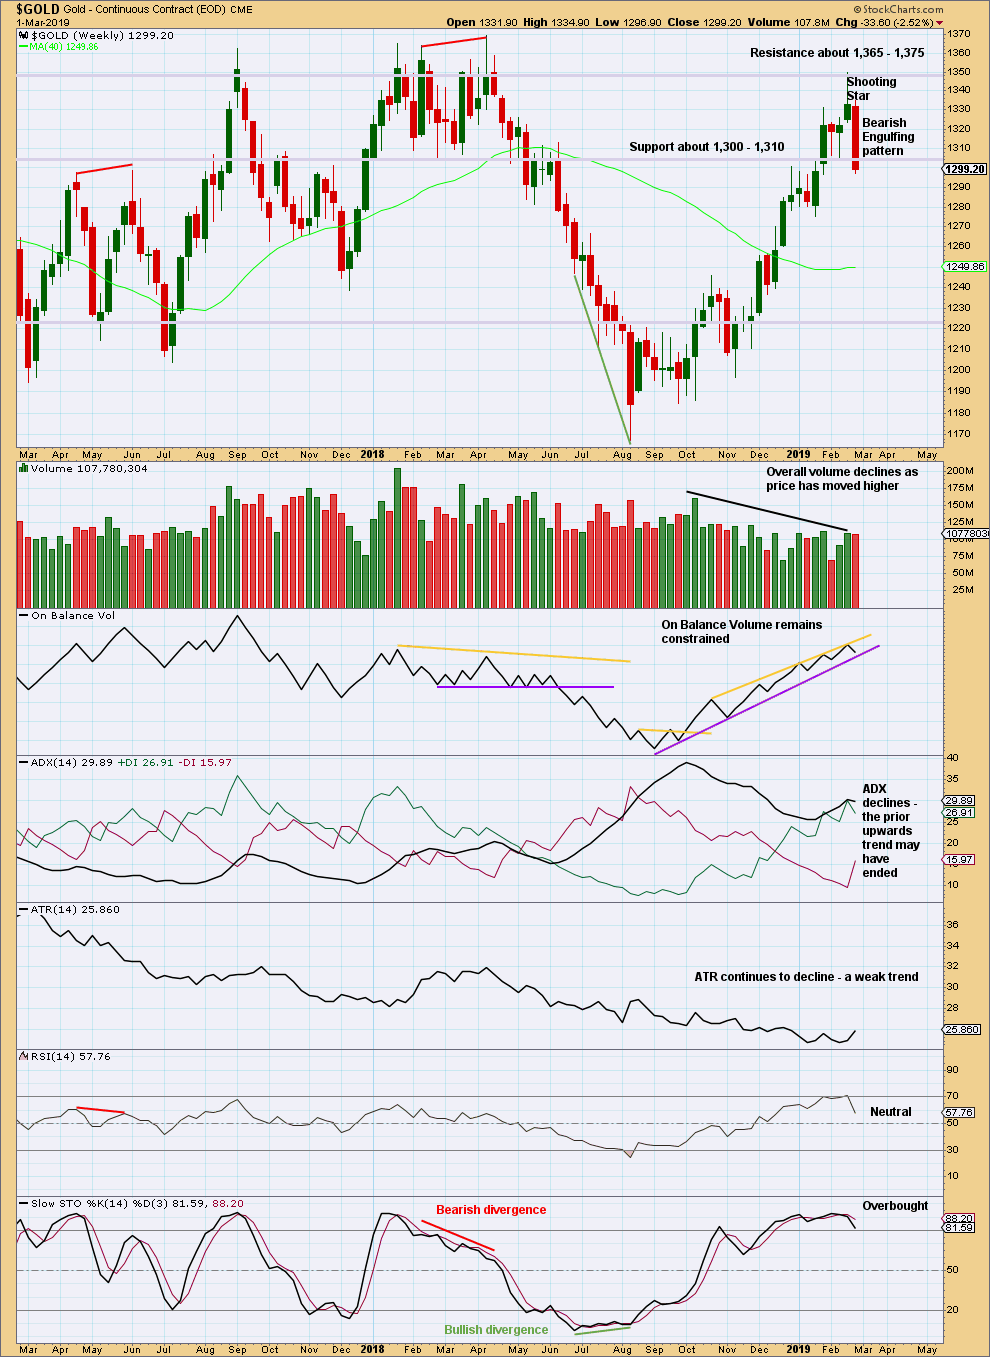
Click chart to enlarge. Chart courtesy of StockCharts.com.
There are now two bearish candlestick reversal patterns on the weekly chart: a Shooting Star and a Bearish Engulfing pattern. This supports the view that a high is in place.
DAILY CHART
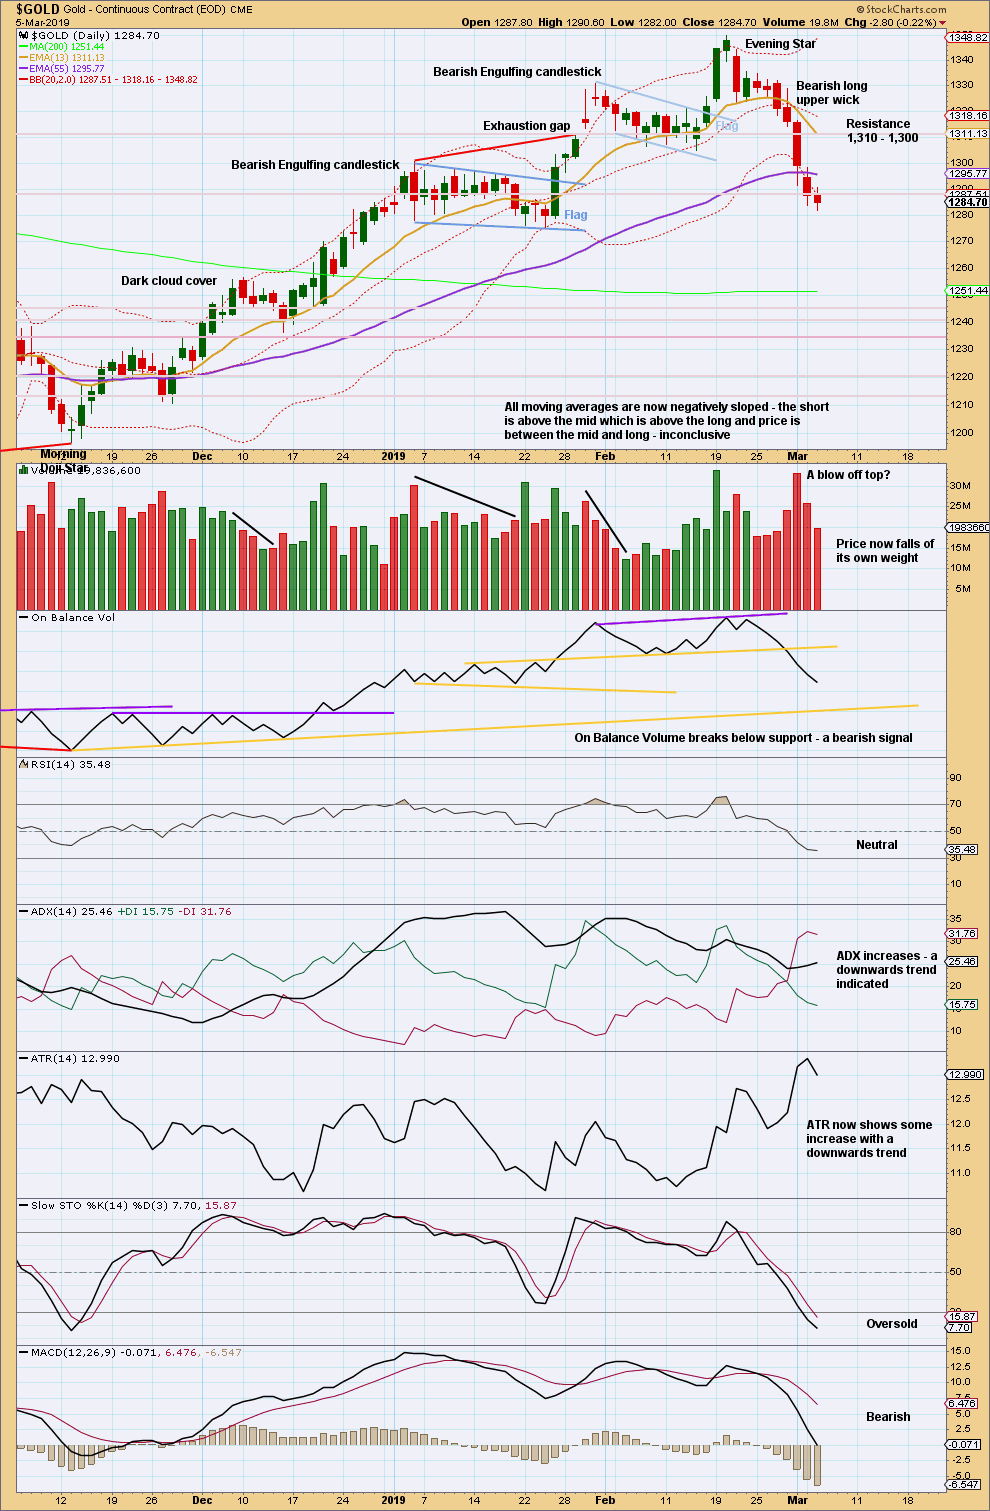
Click chart to enlarge. Chart courtesy of StockCharts.com.
The Evening Star reversal pattern indicates a trend change here to either down or sideways.
With volume and ATR today both declining, it looks like downwards movement may end soon. Look for a possible test of resistance at 1,300 – 1,310.
GDX WEEKLY CHART
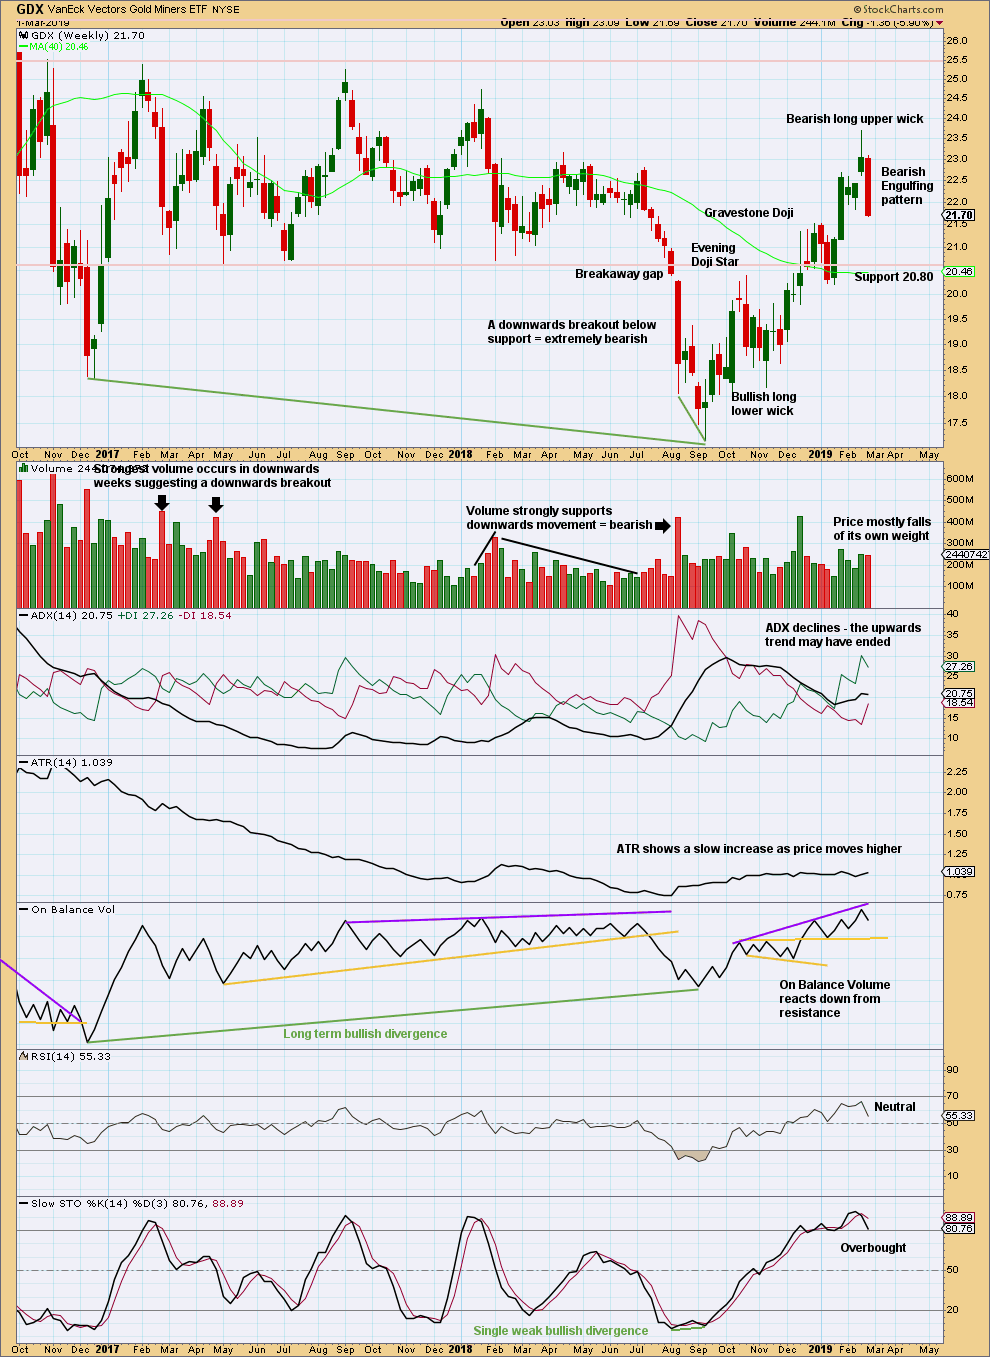
Click chart to enlarge. Chart courtesy of StockCharts.com.
The Bearish Engulfing pattern at the weekly chart level should be given weight in this analysis. It signals an end to the upwards trend and a new downwards or sideways trend.
GDX DAILY CHART
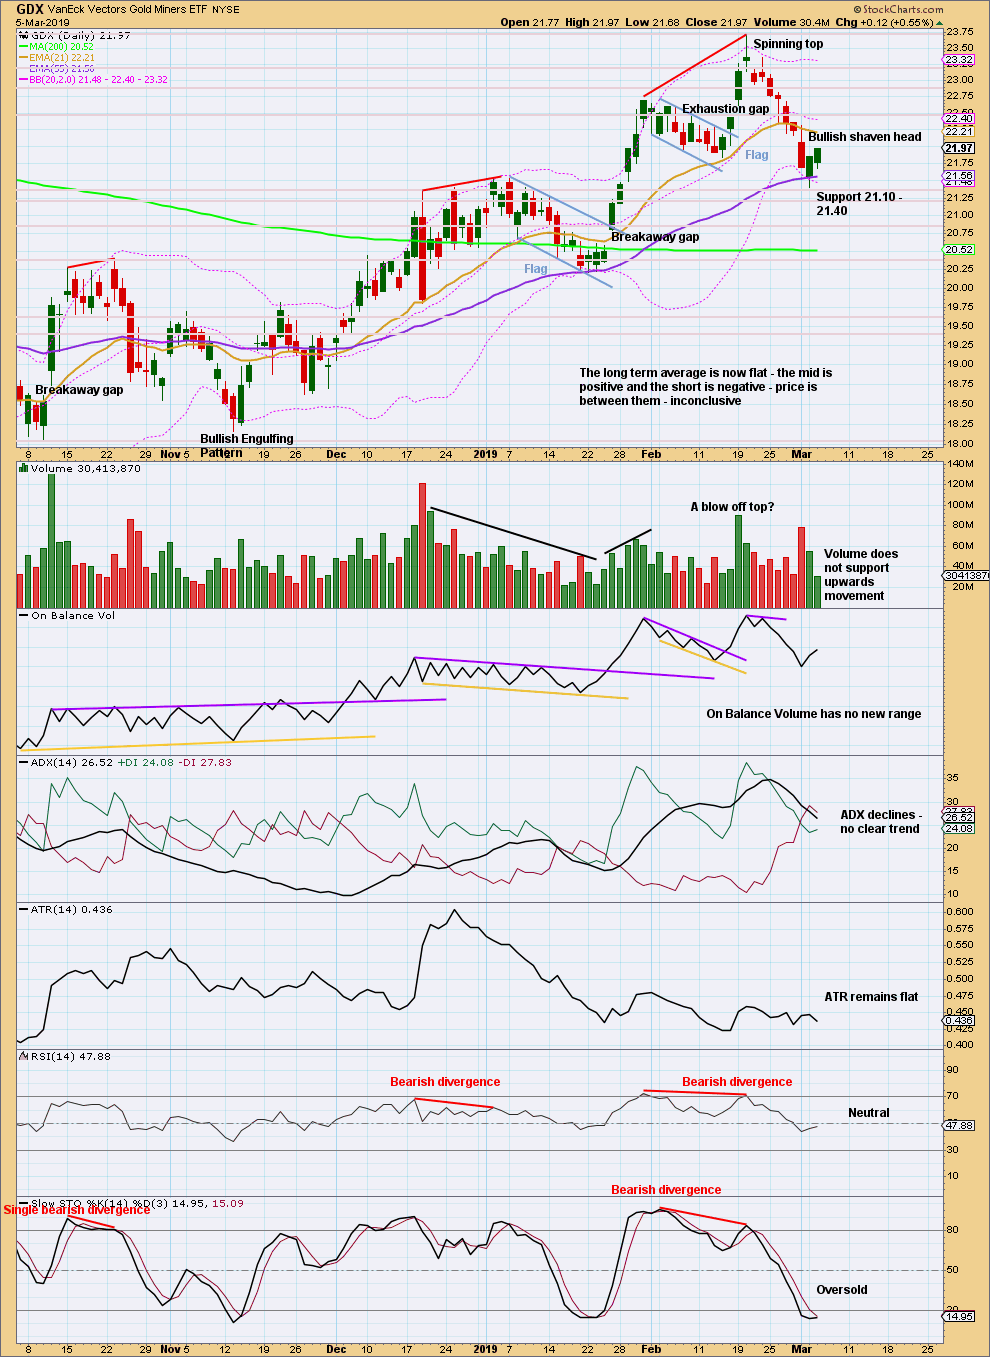
Click chart to enlarge. Chart courtesy of StockCharts.com.
A long lower wick and a bounce off support suggest more upwards movement tomorrow for the short term. It looks like GDX may also have found a high; upwards movement here may be a counter trend bounce.
Look for next support about 21.40 to 21.10.
Published @ 07:07 p.m. EST.
—
Careful risk management protects your trading account(s).
Follow my two Golden Rules:
1. Always trade with stops.
2. Risk only 1-5% of equity on any one trade.
Hi Lara,
I got an alternative count for weekly chart with (Red) label of (A),(B) and (C); Any specific reason that this alternative wave count is not valid? (C) wave could be a five wave structure to a high of $1500… How do you think? Many thanks.
Hansen
It’s possible, but less likely:
Your wave (A) up fits better as a “3”
Your (B) wave fits better as a W-X-Y. For your (B) wave to be an A-B-C, the C wave would be truncated, which is also less likely.
So far, what would be your Wave 1 of (C), looks more like a “3”.
I would rather you try and figure out how to see your red (B) could subdivide and meet all Elliott wave rules before answering your question.
That’s the key, and the answer to your question is there.
If you have a go and can’t figure it out, then let me know and I’ll then give a fuller answer.
I combined your two pictures (one double zigzag and one alternative bullish) into one. I am kind of getting your point of the less likely count because wave c of (B) was not truncated? if it was truncated, what the fabi ratio of wave c should be? Much appreciated of your correction.
I’ve just spent most of my morning struggling with the counts for the S&P, to now jump into Gold and see it’s behaving very nicely indeed.
I know that the start of minute iii is above and outside the downwards sloping pink channel, but that’s okay. I’ve found that Gold often has curved impulses, but using a channel drawn with Elliott’s first technique still may show where the fourth wave finds support / resistance. That’s working nicely today.
I can now calculate a target for minor 1 to end for you using the most common Fibonacci ratio of minute v to minute i.
Thanks Lara, appreciate these updates.
I took a year off trading , did you get rid of the Gold app you used to have ?
I still have the app on my phone, so tried opening it. First time in a long time. Screen comes up and says “Gone Fishing”. lol. Should say “Gone Surfing”. Looks like it’s inactive.
Personally, I tried the app when it came out but found it was still better to use the website where you could zoom the screen with ease.
What would be great is if somehow we had a alert that someone had posted a comment.
We had that feature a long time ago when EWG used a different comment system. I think it was DISQUS. The issue was that members comments were viewable by the public.
We asked for that feature when EWG switched to the current comment system. For some reason that feature was unavailable.
Sorry everybody. The problem with the app was a third party provider couldn’t do in app purchases, and so Apple stopped accepting their app submissions.
Cesar has learned how to build an app, but the integration with our website is a whole other layer of complexity and he says he needs someone else to do that.
At this time spending thousands on getting apps built just doesn’t make sense for our business.
Cesar has found a potential solution to new comment notifications and he says he’ll be testing that soon.