

S&P 500
Downwards movement continued as the Elliott wave analysis expected.
Summary: Targets for a multi-week pullback are 2,637 or 2,656.
At its end, this pullback may offer an opportunity to join the upwards trend prior to new all time highs.
The biggest picture, Grand Super Cycle analysis, is here.
Last published monthly charts are here. Video is here.
ELLIOTT WAVE COUNT
WEEKLY CHART
Click chart to enlarge.
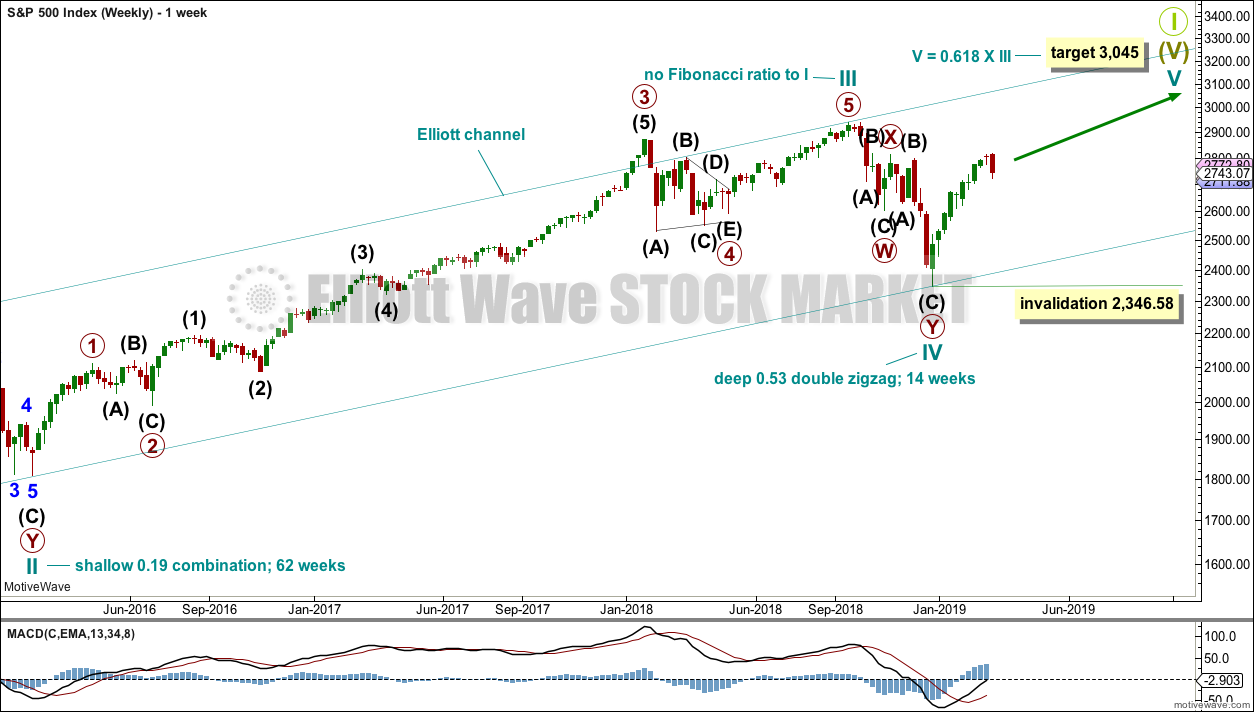
This weekly chart shows all of cycle waves III, IV and V so far.
Cycle wave II fits as a time consuming double combination: flat – X – zigzag. Combinations tend to be more time consuming corrective structures than zigzags. Cycle wave IV has completed as a multiple zigzag that should be expected to be more brief than cycle wave II.
Cycle wave IV may have ended at the lower edge of the Elliott channel.
Within cycle wave V, no second wave correction may move beyond the start of its first wave below 2,346.58.
Although both cycle waves II and IV are labelled W-X-Y, they are different corrective structures. There are two broad groups of Elliott wave corrective structures: the zigzag family, which are sharp corrections, and all the rest, which are sideways corrections. Multiple zigzags belong to the zigzag family and combinations belong to the sideways family. There is perfect alternation between the possible double zigzag of cycle wave IV and the combination of cycle wave II.
Although there is gross disproportion between the duration of cycle waves II and IV, the size of cycle wave IV in terms of price makes these two corrections look like they should be labelled at the same degree. Proportion is a function of either or both of price and time.
Draw the Elliott channel about Super Cycle wave (V) with the first trend line from the end of cycle wave I (at 2,079.46 on the week beginning 30th November 2014) to the high of cycle wave III, then place a parallel copy on the low of cycle wave II. Cycle wave V may find resistance about the upper edge.
It is possible that cycle wave V may end in October 2019. If it does not end there, or if the AD line makes new all time highs during or after June 2019, then the expectation for cycle wave V to end would be pushed out to March 2020 as the next possibility. Thereafter, the next possibility may be October 2020. March and October are considered as likely months for a bull market to end as in the past they have been popular. That does not mean though that this bull market may not end during any other month.
DAILY CHART
Click chart to enlarge.
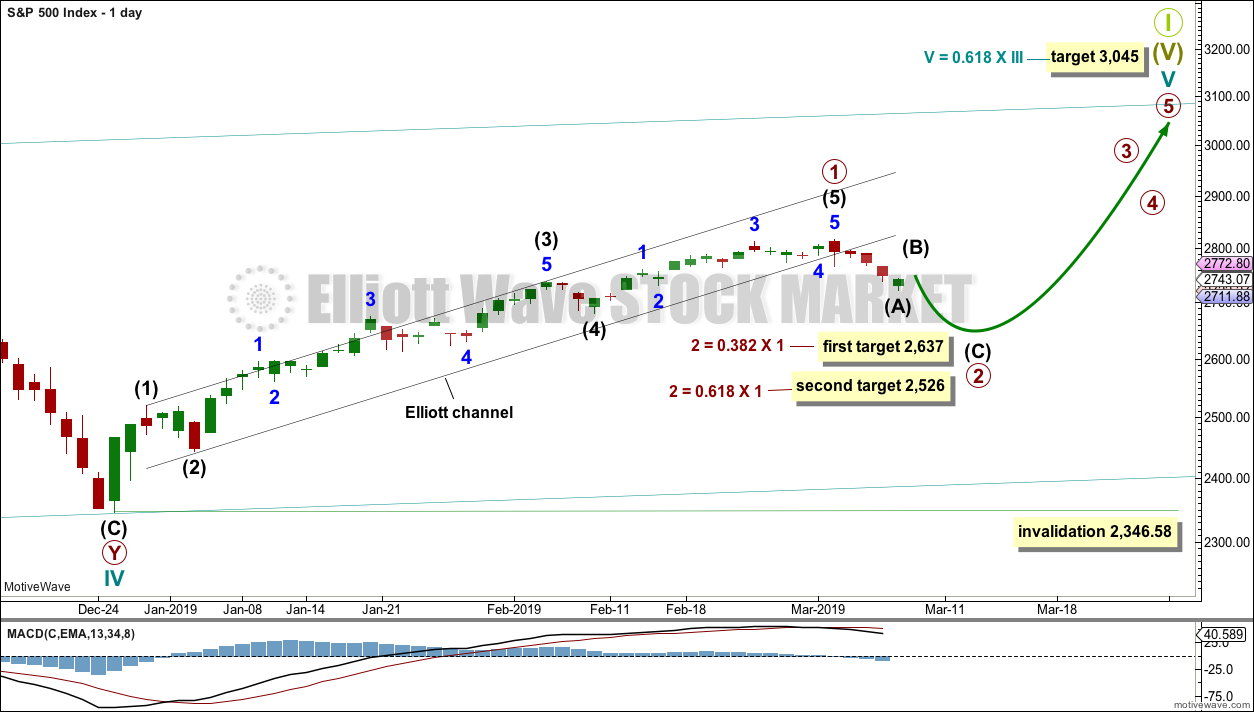
The daily chart will focus on the structure of cycle wave V.
Within Super Cycle wave (V), cycle wave III may not be the shortest actionary wave. Because cycle wave III is shorter than cycle wave I, this limits cycle wave V to no longer than equality in length with cycle wave III at 3,477.39. A target is calculated for cycle wave V to end prior to this point.
Cycle wave V must subdivide as a five wave motive structure, either an impulse or an ending diagonal. An impulse is much more common and that will be how it is labelled. A diagonal would be considered if overlapping suggests it.
Primary wave 1 is labelled as complete. Two targets are given for primary wave 2. The higher 0.382 Fibonacci ratio may be preferred in the first instance. If price keeps dropping through this target or if it gets there and the structure of primary wave 2 is incomplete, then the second lower target may be used.
Primary wave 2 may not move beyond the start of primary wave 1 below 2,346.58.
Primary wave 2 would most likely subdivide as a zigzag, but it may subdivide as any corrective structure except a triangle. The focus for the next few weeks will be on identifying when a complete structure for primary wave 2 may be seen.
TECHNICAL ANALYSIS
WEEKLY CHART
Click chart to enlarge. Chart courtesy of StockCharts.com.
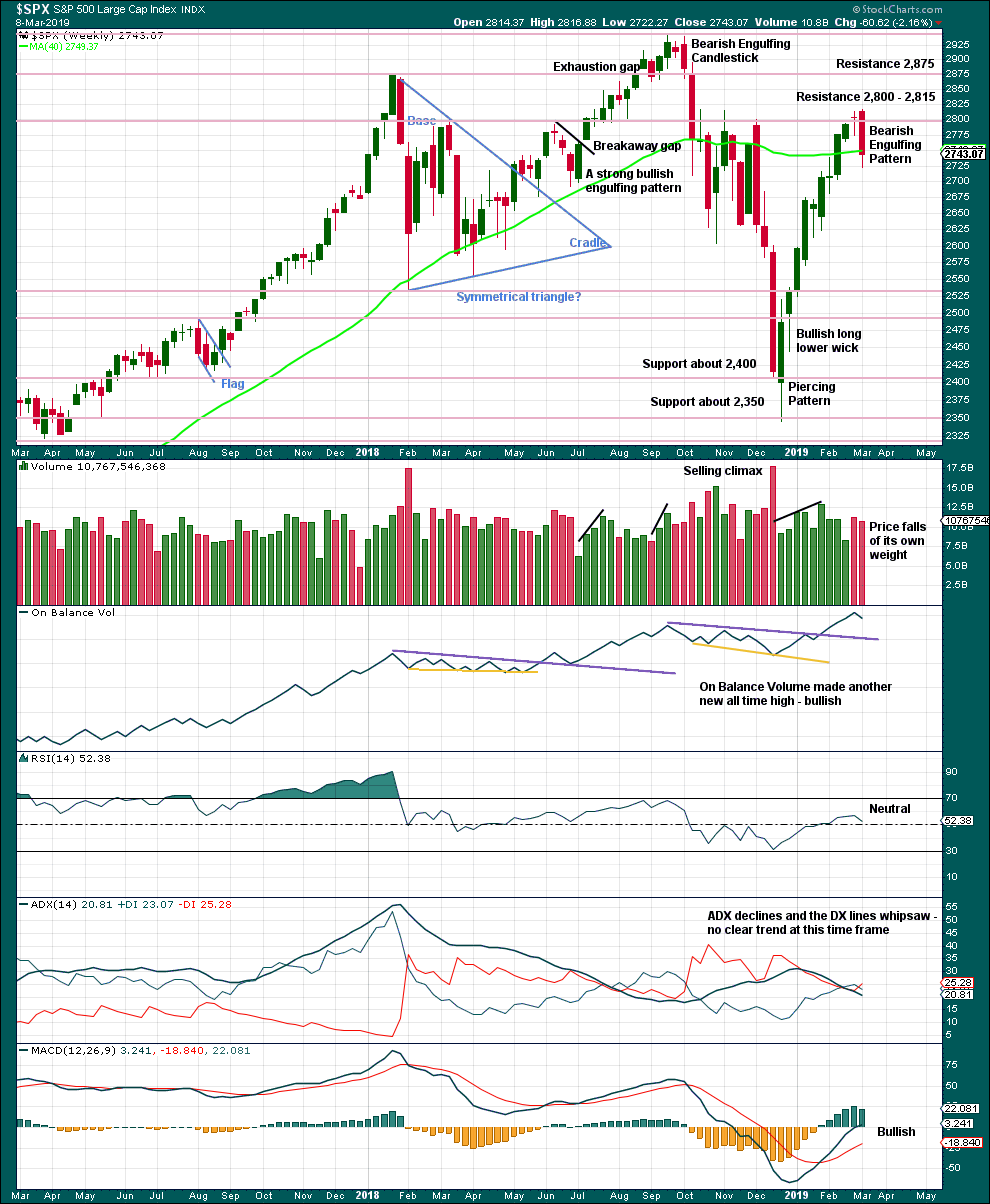
This week the strong Bearish Engulfing candlestick pattern supports the Elliott wave count.
DAILY CHART
Click chart to enlarge. Chart courtesy of StockCharts.com.
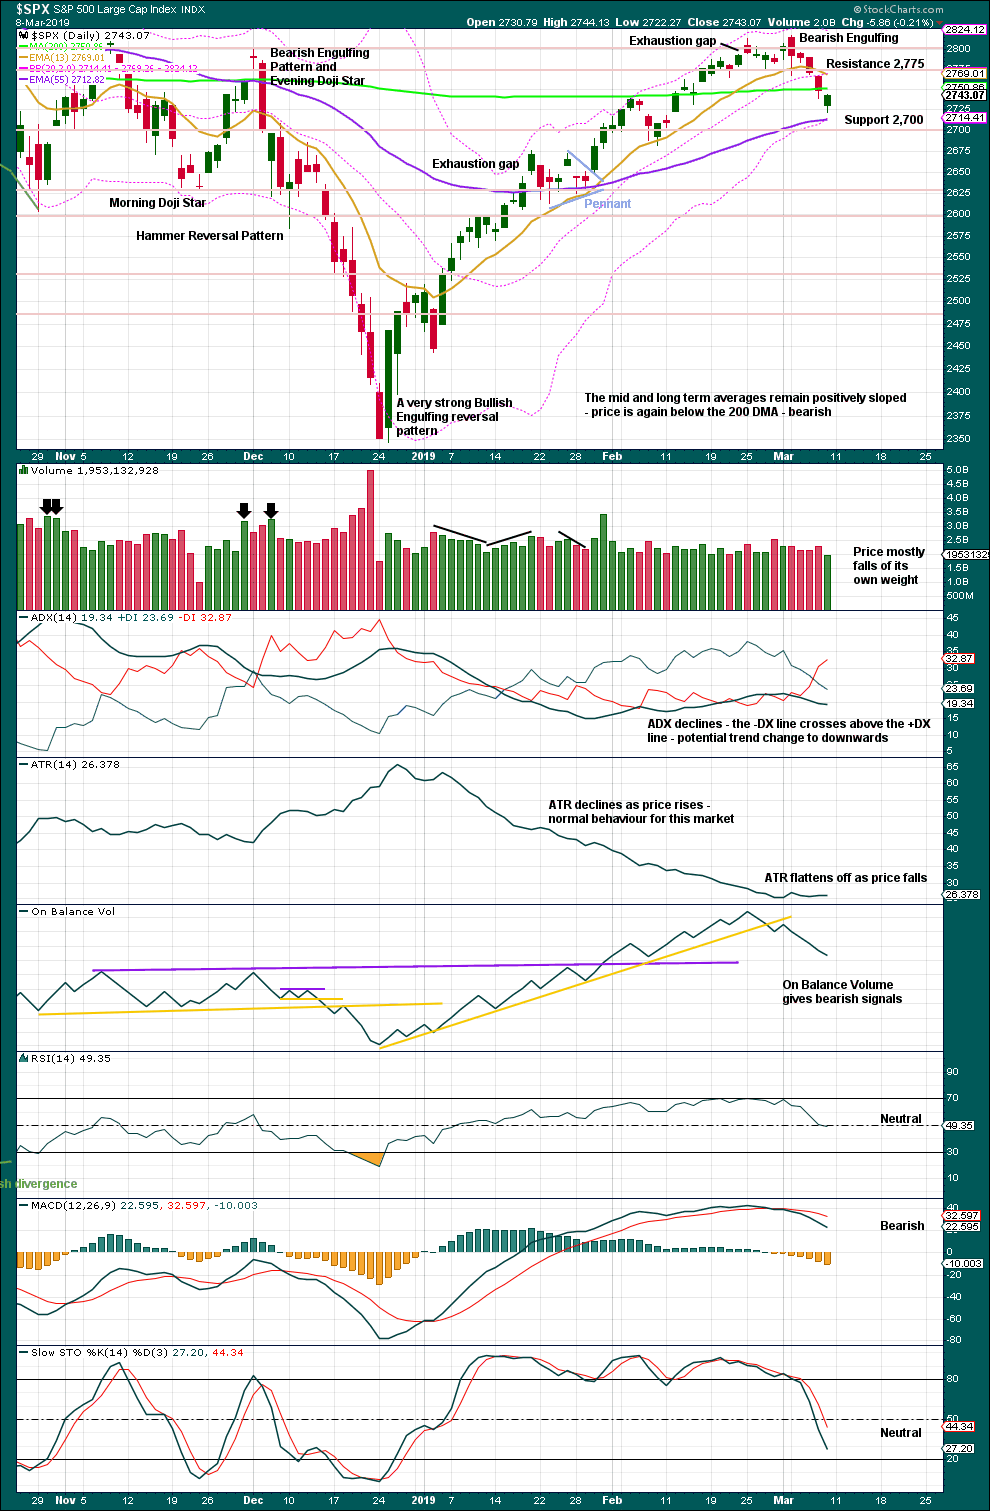
The December 2018 low is expected to remain intact. The two 90% upwards days on 26th December 2018 and 6th January 2019 indicate this upwards trend has internal strength.
On Balance Volume supports the Elliott wave count. Look for next support about 2,625 and then 2,600.
BREADTH – AD LINE
WEEKLY CHART
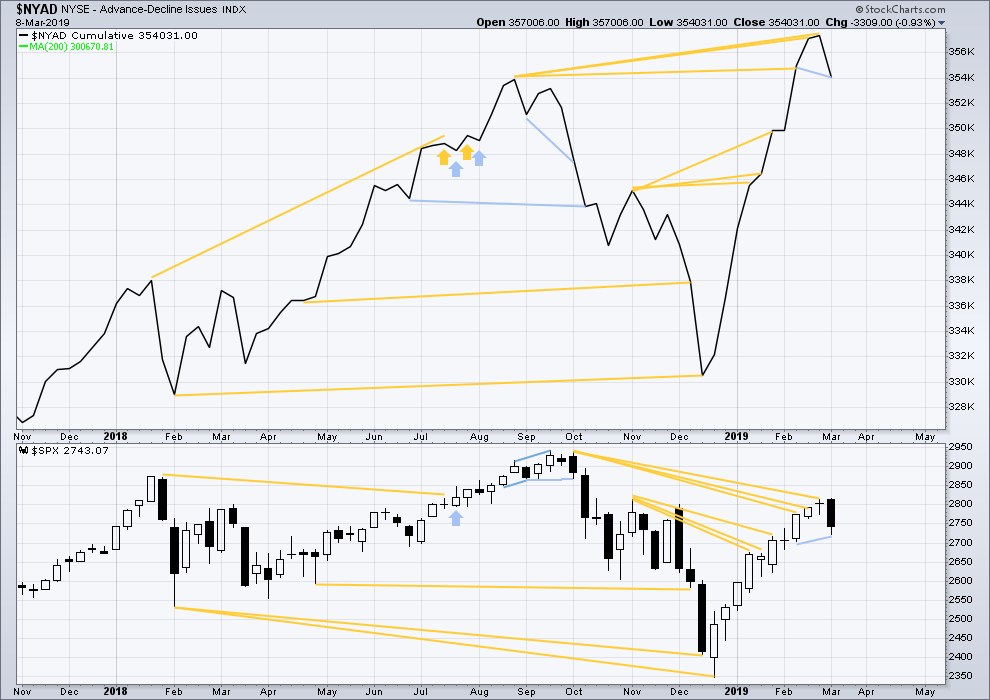
Click chart to enlarge. Chart courtesy of StockCharts.com. So that colour blind members are included, bearish signals
will be noted with blue and bullish signals with yellow.
Every single bear market from the Great Depression and onwards has been preceded by a minimum of 4-6 months divergence between price and the AD line. With the AD line making a new all time high again last week, the end of this bull market and the start of a new bear market must be a minimum of 4 months away, which is mid to end June 2019 at this time.
This week the AD line has made a new low below the prior low of the week beginning 11th February, but price has not. This divergence is bearish for the short term.
DAILY CHART
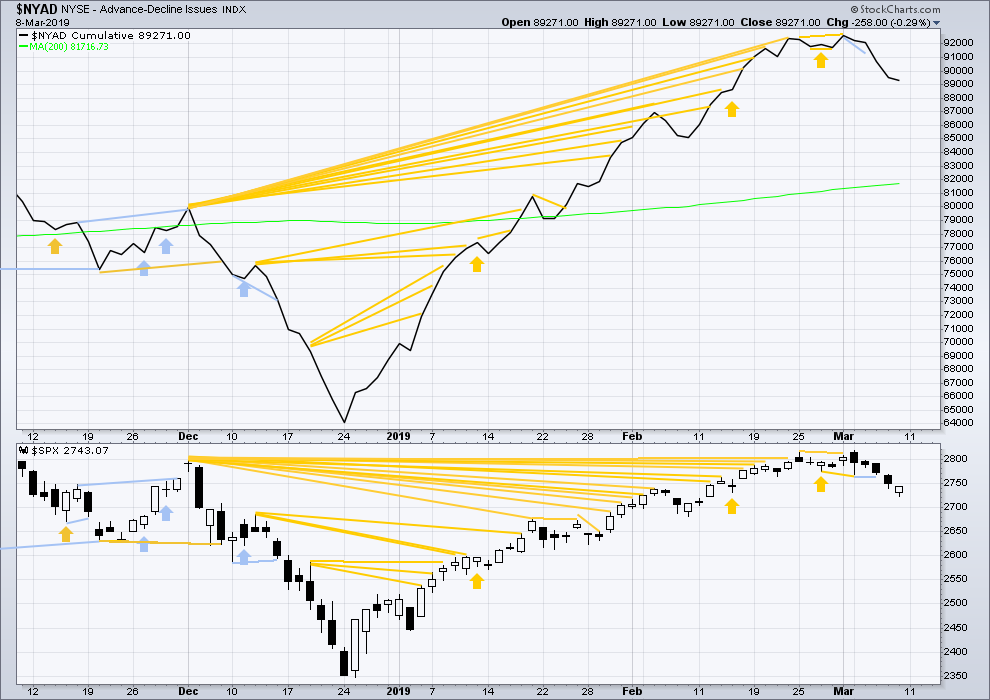
Click chart to enlarge. Chart courtesy of StockCharts.com. So that colour blind members are included, bearish signals
will be noted with blue and bullish signals with yellow.
Breadth should be read as a leading indicator.
Today both price and the AD line moved lower. There is no new divergence. The fall in price today has support from a decline in market breadth.
VOLATILITY – INVERTED VIX CHART
WEEKLY CHART
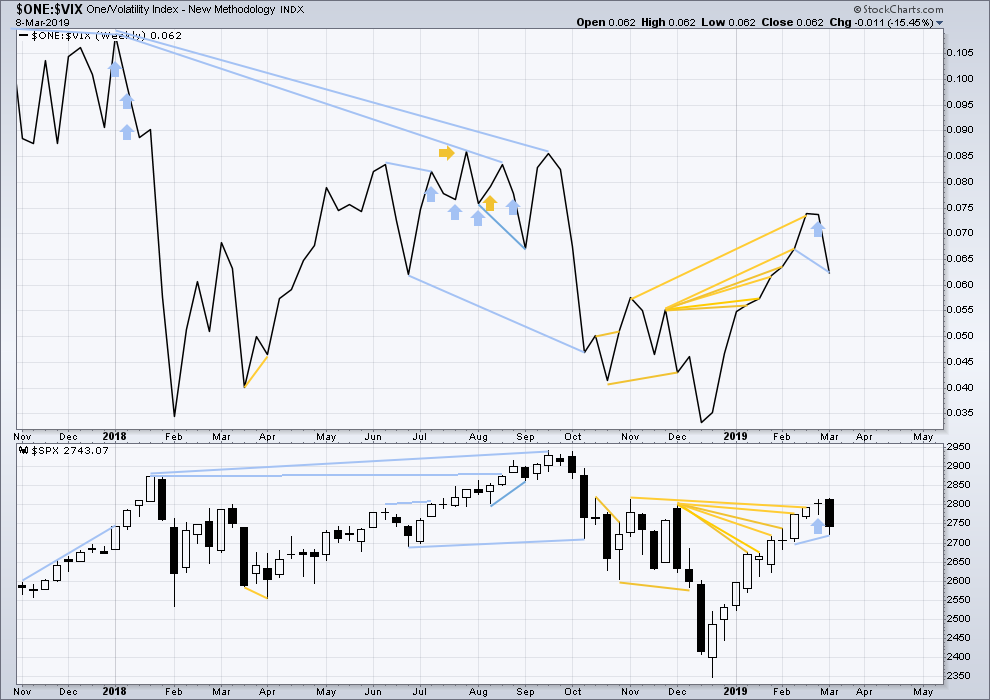
Click chart to enlarge. Chart courtesy of StockCharts.com. So that colour blind members are included, bearish signals
will be noted with blue and bullish signals with yellow.
Inverted VIX has made a new low below the prior low of the week beginning 11th of February, but price has not. This divergence is bearish.
DAILY CHART
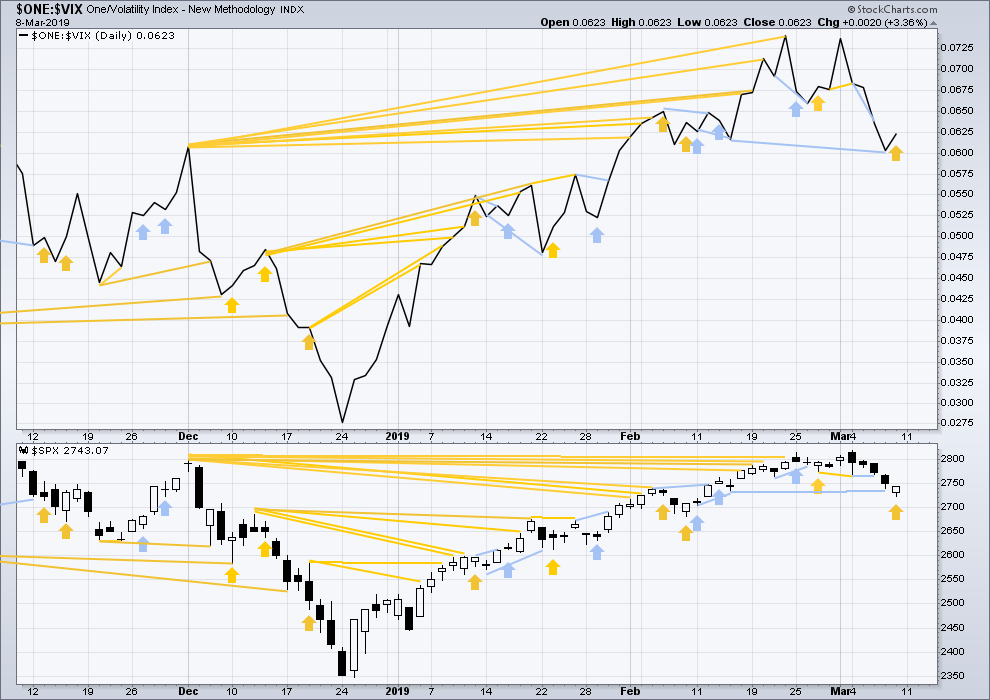
Click chart to enlarge. Chart courtesy of StockCharts.com. So that colour blind members are included, bearish signals
will be noted with blue and bullish signals with yellow.
On Friday price moved lower, but inverted VIX moved higher. This divergence is bullish for the short term.
DOW THEORY
Dow Theory confirms a bear market. This does not necessarily mean a bear market at Grand Super Cycle degree though; Dow Theory makes no comment on Elliott wave counts. On the 25th of August 2015 Dow Theory also confirmed a bear market. The Elliott wave count sees that as part of cycle wave II. After Dow Theory confirmation of a bear market in August 2015, price went on to make new all time highs and the bull market continued.
DJIA: 23,344.52 – a close on the 19th of December at 23,284.97 confirms a bear market.
DJT: 9,806.79 – price has closed below this point on the 13th of December.
S&P500: 2,532.69 – a close on the 19th of December at 2,506.96 provides support to a bear market conclusion.
Nasdaq: 6,630.67 – a close on the 19th of December at 6,618.86 provides support to a bear market conclusion.
With all the indices moving now higher, Dow Theory would confirm a bull market if the following highs are made:
DJIA: 26,951.81
DJT: 11,623.58
S&P500: 2,940.91
Nasdaq: 8,133.30.
GOLD
Upwards movement on Friday indicates the first wave down is complete. Fibonacci ratios are used to calculate targets.
Summary: Three long-term targets are now calculated for cycle wave c to end. Confidence in a new downwards trend may be had with a new low below 1,160.75.
For the short term, minor wave 2 may now test resistance about 1,300 – 1,310. Within this range is the 0.382 Fibonacci ratio of minor wave 1 at 1,306.69, which is the preferred target.
Grand SuperCycle analysis is here.
Monthly charts are updated in this analysis.
MAIN ELLIOTT WAVE COUNT
MONTHLY CHART
Click chart to enlarge.
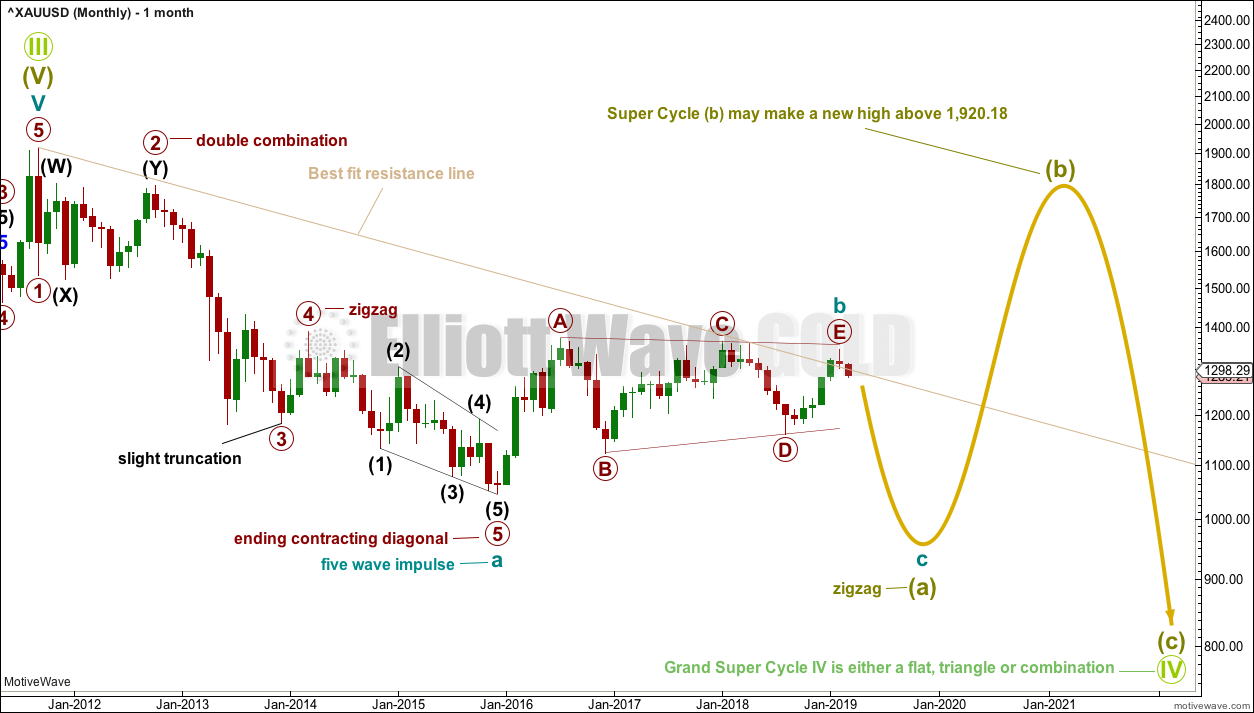
The main wave count will look at the large downwards wave from the all time high as a five wave impulse. For this main wave count, it will be labelled as cycle wave a, within a zigzag for Super Cycle wave (a).
It is also possible to move the degree of labelling up one degree and see this as a five wave structure complete for Super Cycle wave (a).
Both degrees of labelling would be valid, but in the interests of keeping charts and ideas to a manageable level only one shall be published at this stage. The difference will not be material for at least a year and probably more.
If cycle wave a is a five, then cycle wave b may not move beyond its start above 1,920.18.
Cycle wave b at this stage will be labelled on the monthly chart as a complete regular contracting triangle, but it may also be an incomplete double zigzag or double combination. Both ideas will be published on weekly charts.
When cycle wave b is complete, then cycle wave c downwards should unfold. Cycle wave c would most likely reach about equality in length with cycle wave a.
If this wave count unfolds as expected, then a huge zigzag downwards may be complete when cycle wave c completes. That would then be expected to be followed by a huge three wave structure upwards, most likely another zigzag for Super Cycle wave (b), which may make a new all time high.
The larger structure for Grand Super Cycle wave (IV) would be starting out with a huge zigzag downwards, indicating either a flat, triangle or combination.
WEEKLY CHART – TRIANGLE
Click chart to enlarge.
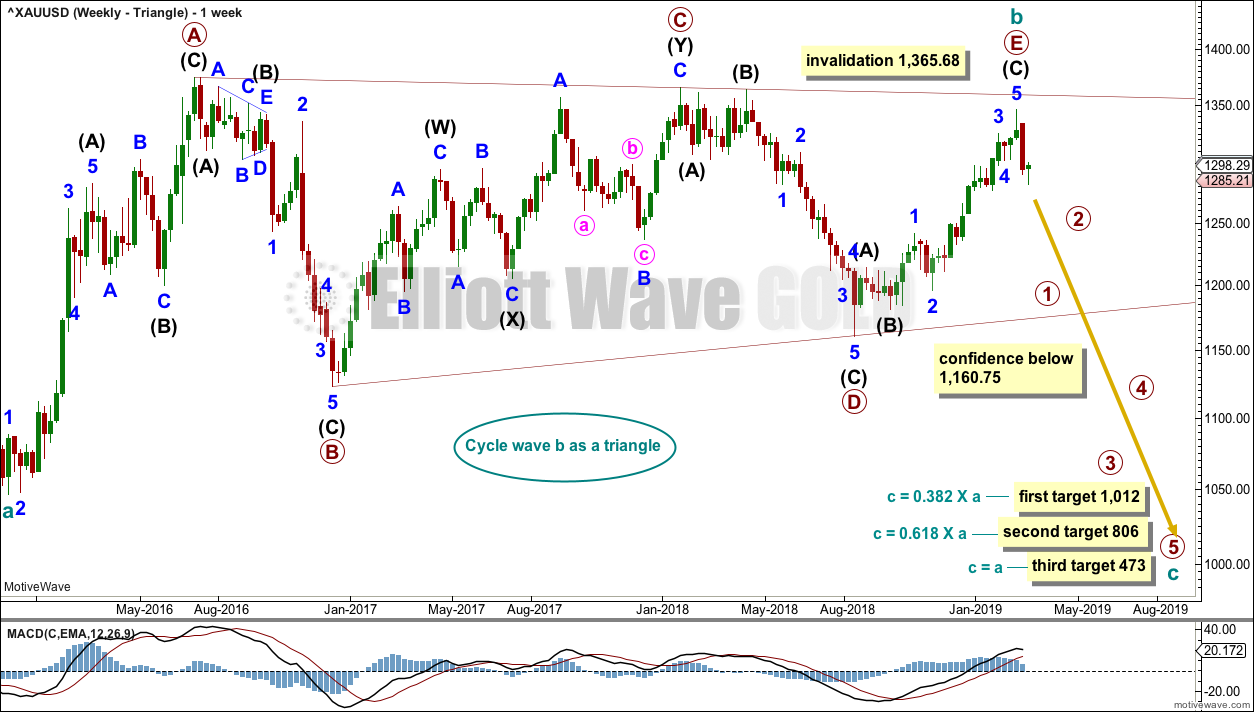
This is the preferred wave count.
Cycle wave b may be a complete regular contracting triangle. If it continues further, then primary wave E may not move beyond the end of primary wave C above 1,365.68.
Four of the five sub-waves of a triangle must be zigzags, with only one sub-wave allowed to be a multiple zigzag. Wave C is the most common sub-wave to subdivide as a multiple, and this is how primary wave C for this example fits best.
There are no problems in terms of subdivisions or rare structures for this wave count. It has an excellent fit and so far a typical look.
This wave count would expect a cycle degree trend change has just occurred. Cycle wave c would most likely make new lows below the end of cycle wave a at 1,046.27 to avoid a truncation.
Primary wave E should exhibit reasonable weakness as it comes to an end. Triangles often end with declining ATR, weak momentum and weak volume.
If this weekly wave count is correct, then cycle wave c downwards should develop strength, ATR should show some increase, and MACD should exhibit an increase in downwards momentum.
Three targets are calculated for cycle wave c. Cycle wave a lasted 4.25 years. Cycle wave b may be over in 3.17 years. Cycle wave c may last a minimum of 2 years and possibly up to 5 years.
DAILY CHART – TRIANGLE
Click chart to enlarge.
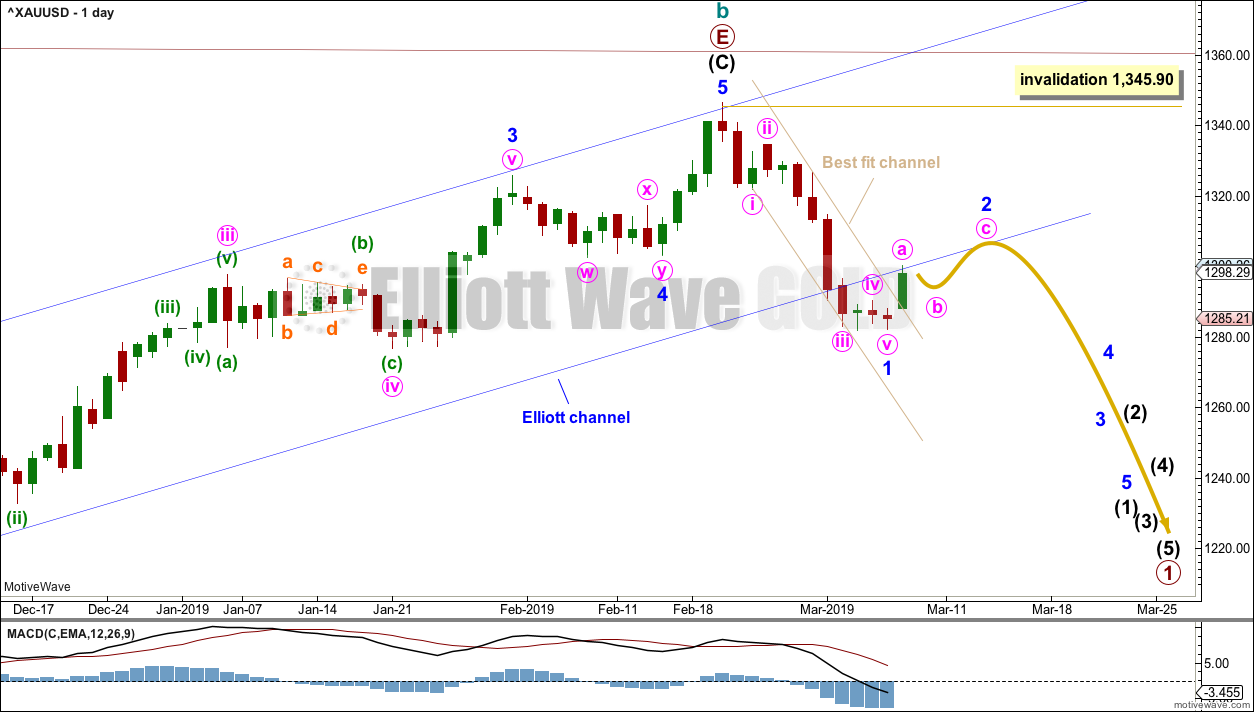
Further confidence in this wave count may be had now that the blue channel is breached.
Classic analysis offers good support to this wave count.
Cycle wave c must subdivide as a five wave structure, either an impulse or an ending diagonal. An impulse is much more common and that shall be how it is labelled unless overlapping suggests a diagonal should be considered.
A new trend at cycle degree should begin with a five wave structure on the daily chart, which will be labelled minor wave 1. A best fit channel is drawn about minor wave 1. This channel is breached by strong upwards movement on Friday, indicating minor wave 1 should be over and now minor wave 2 should be underway.
Minor wave 2 may not move beyond its start above 1,345.90.
WEEKLY CHART – DOUBLE ZIGZAG
Click chart to enlarge.
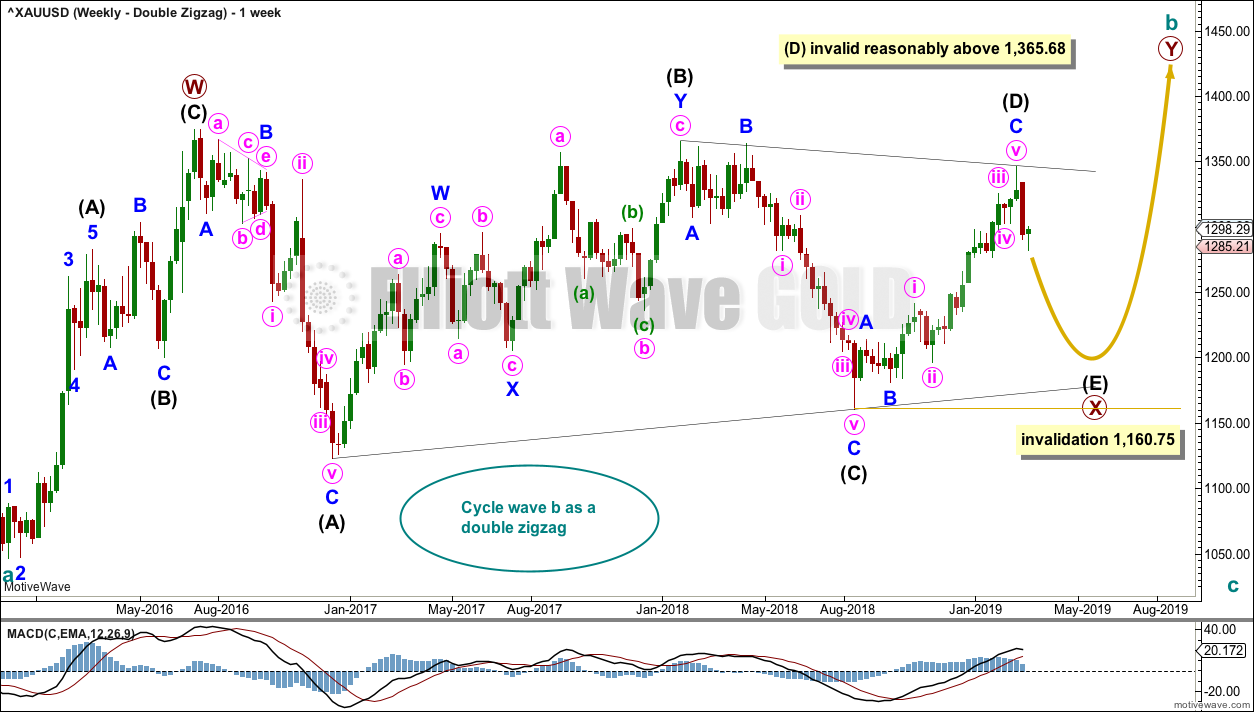
It is possible that cycle wave b may be an incomplete double zigzag or a double combination.
The first zigzag in the double is labelled primary wave W. This has a good fit.
The double may be joined by a corrective structure in the opposite direction, a triangle labelled primary wave X. The triangle would be about four fifths complete.
Within multiples, X waves are almost always zigzags and rarely triangles. Within the possible triangle of primary wave X, it is intermediate wave (B) that is a multiple; this is acceptable, but note this is not the most common triangle sub-wave to subdivide as a multiple. These two points reduce the probability of this wave count.
Intermediate wave (D) may be complete. The (B)-(D) trend line is almost perfectly adhered to with the smallest overshoot within intermediate wave (C). This is acceptable.
Intermediate wave (E) should continue to exhibit weakness: ATR should continue to show a steady decline, and MACD may begin to hover about zero.
Intermediate wave (E) may not move beyond the end of intermediate wave (C) below 1,160.75.
This wave count may now expect downwards movement for several weeks.
Primary wave Y would most likely be a zigzag because primary wave X would be shallow; double zigzags normally have relatively shallow X waves.
Primary wave Y may also be a flat correction if cycle wave b is a double combination, but combinations normally have deep X waves. This would be less likely.
This wave count has good proportions and no problems in terms of subdivisions.
FIRST ALTERNATE ELLIOTT WAVE COUNT
MONTHLY CHART
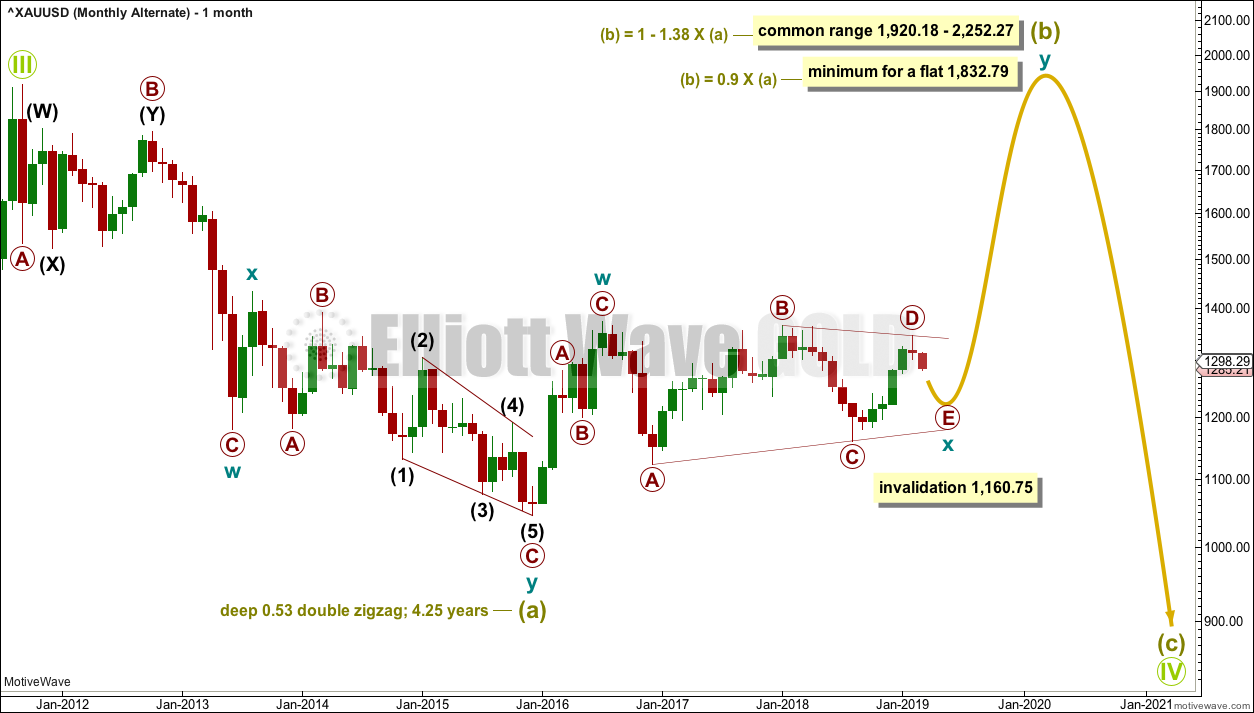
Click chart to enlarge.
The large wave down from September 2011 to November 2015 may also be seen as a three wave structure, a double zigzag.
If the big wave down is a multiple three wave structure, then Grand Super Cycle wave (IV) may be either a flat or triangle. It may not be a combination because they may not have multiples within multiples.
If Grand Super Cycle wave (IV) is a flat correction, then within it Super Cycle wave (b) must retrace a minimum 0.9 length of Super Cycle wave (a) at 1,832.79.
If Grand Super Cycle wave (IV) is a triangle, then there is no minimum requirement for Super Cycle wave (b). There is only the structural requirement that it should be a three wave structure. Super Cycle wave (b) would need to move higher for a triangle to have the right look.
At this stage, it looks like Super Cycle wave (b) for this wave count may be an unfolding double zigzag. A double zigzag for Super Cycle wave (b) may see its Y wave reach up to the minimum requirement at 1,832.79 for a flat correction, for the structure one degree higher at Grand Super Cycle degree.
SECOND ALTERNATE ELLIOTT WAVE COUNT
MONTHLY CHART
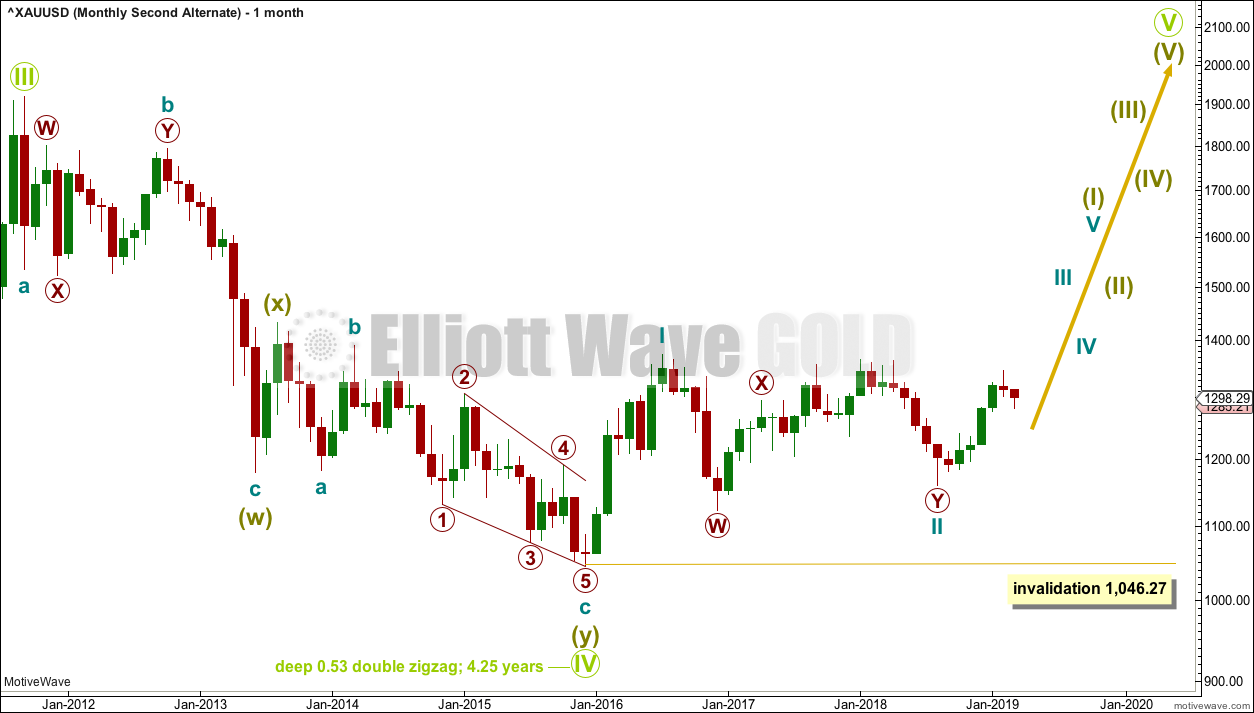
Click chart to enlarge.
By simply moving the degree of labelling within the last huge wave down all up one degree, it is possible to see that Grand Super Cycle wave IV could be over. It would be rather brief though at only 4.25 years. However, Grand Super Cycle wave II in the Grand Super Cycle analysis is expected to have lasted only about 8 years, so this possibility should be accepted.
If there has been a trend change at Grand Super Cycle degree in the end of November 2015, then a new five wave structure upwards should develop from there at the monthly chart level.
Gold will often form long slow basing movements. Its first waves can be short and its second waves long lasting and deep.
Cycle wave I may have been complete and relatively short and brief at only 7 months duration.
Cycle wave II may now be a complete double combination.
WEEKLY CHART
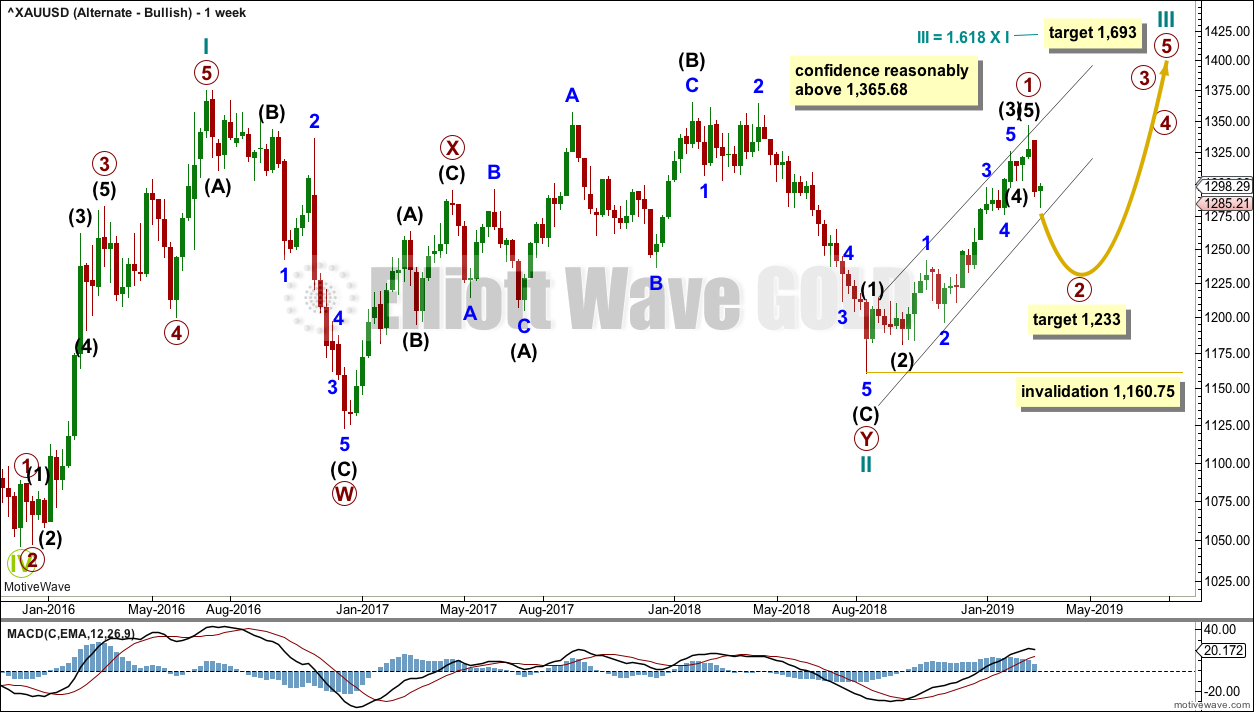
Click chart to enlarge.
If Gold is in a new bull market, then it should begin with a five wave structure upwards on the weekly chart. However, the biggest problem with this wave count is the structure labelled cycle wave I because this wave count must see it as a five wave structure, but it looks more like a three wave structure.
Commodities often exhibit swift strong fifth waves that force the fourth wave corrections coming just prior to be more brief and shallow than their counterpart second waves. It is unusual for a commodity to exhibit a quick second wave and a more time consuming fourth wave, and this is how cycle wave I is labelled. The probability of this wave count is low due to this problem.
Cycle wave II subdivides well as a double combination: zigzag – X – expanded flat.
Cycle wave III may have begun. Within cycle wave III, primary wave 1 may now be complete. The target for primary wave 2 is the 0.618 Fibonacci ratio of primary wave 1. Primary wave 2 may not move beyond the start of primary wave 1 below 1,160.75.
A black channel is drawn about primary wave 1. Primary wave 2 may breach the lower edge of this channel.
Cycle wave III so far for this wave count would have been underway now for 27 weeks. It should be beginning to exhibit some support from volume, increase in upwards momentum and increasing ATR. However, volume continues to decline, ATR continues to decline and is very low, and momentum is weak in comparison to cycle wave I. This wave count lacks support from classic technical analysis.
TECHNICAL ANALYSIS
MONTHLY CHART
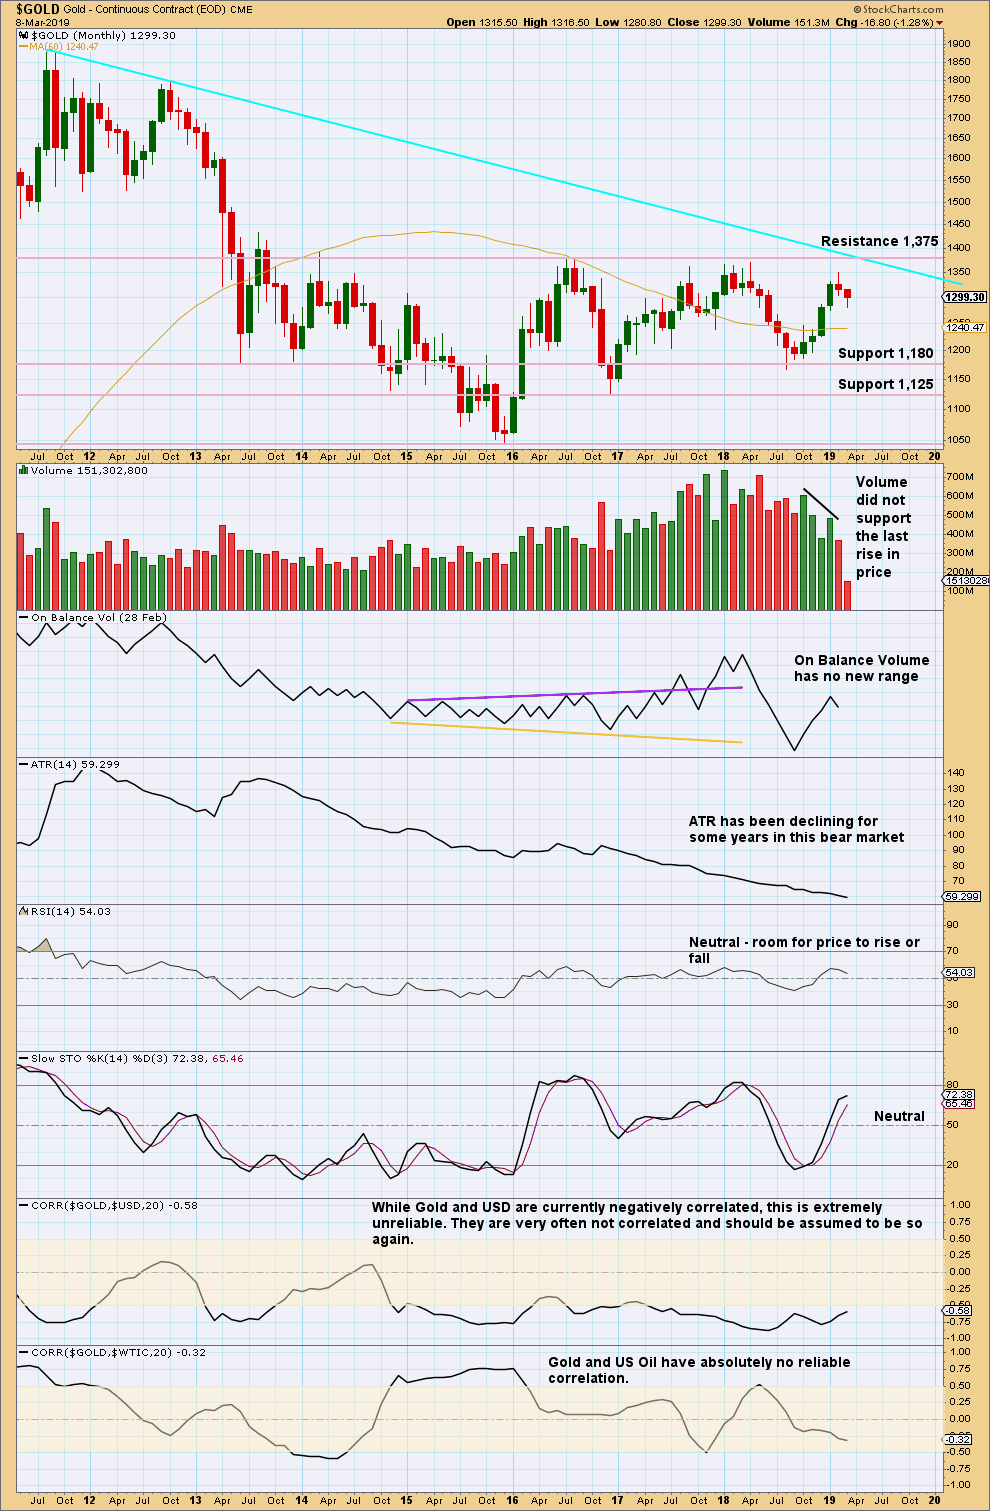
Click chart to enlarge. Chart courtesy of StockCharts.com.
Price has been range bound for years. Resistance is about 1,375 and support about 1,180 and 1,125.
ATR has also been declining for many years. This market is weak.
WEEKLY CHART
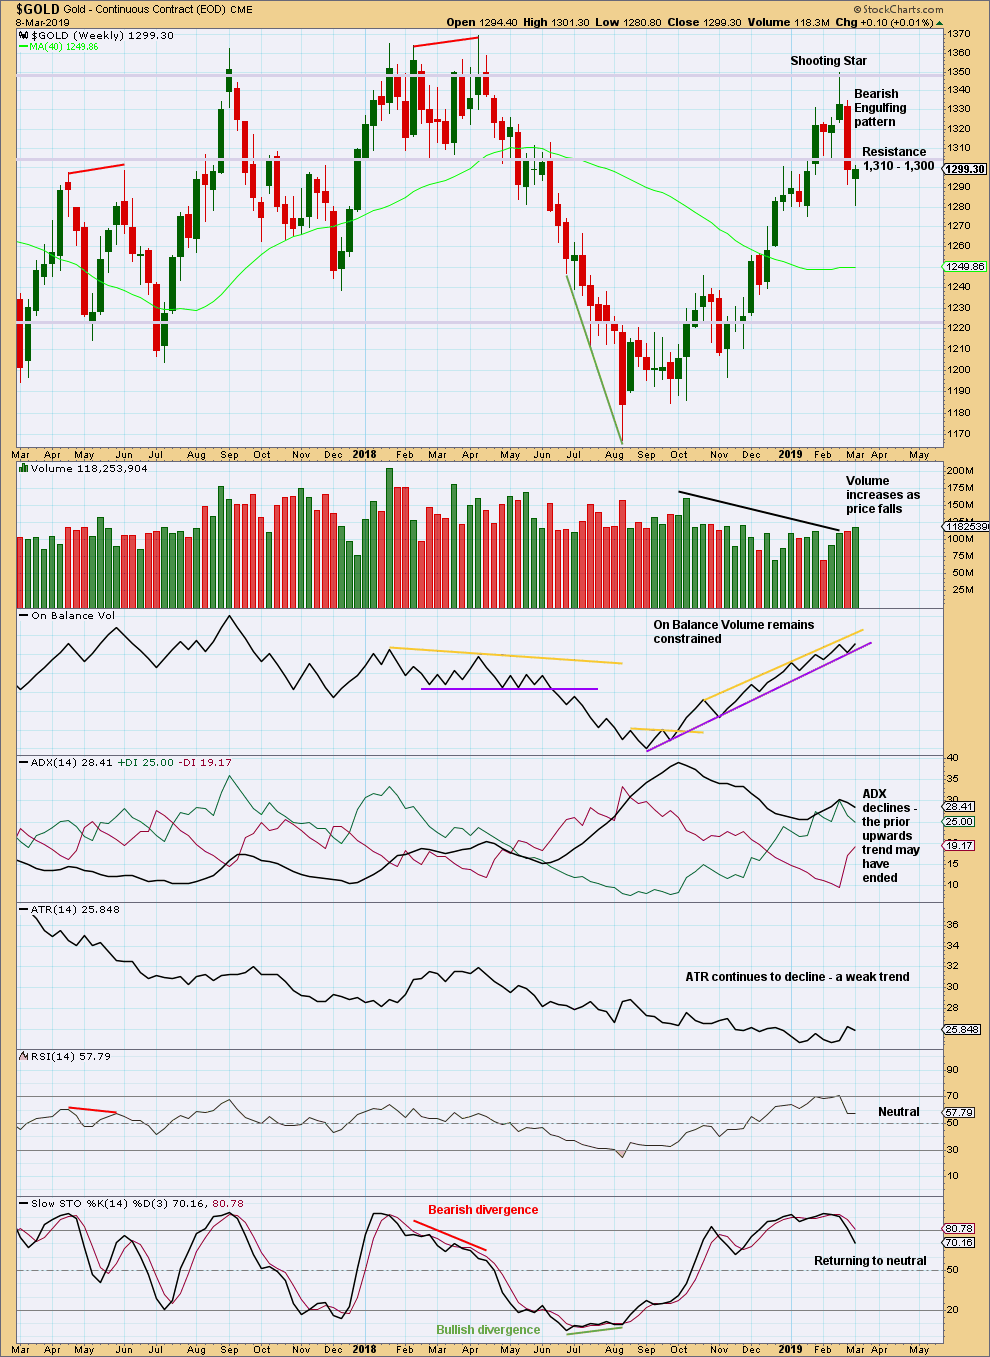
Click chart to enlarge. Chart courtesy of StockCharts.com.
There are now two bearish candlestick reversal patterns on the weekly chart: a Shooting Star and a Bearish Engulfing pattern. This supports the view that a high is in place.
This weekly candlestick may not be considered a bullish reversal pattern as it does not come after a downwards trend at this time frame. The long lower wick is still bullish.
DAILY CHART
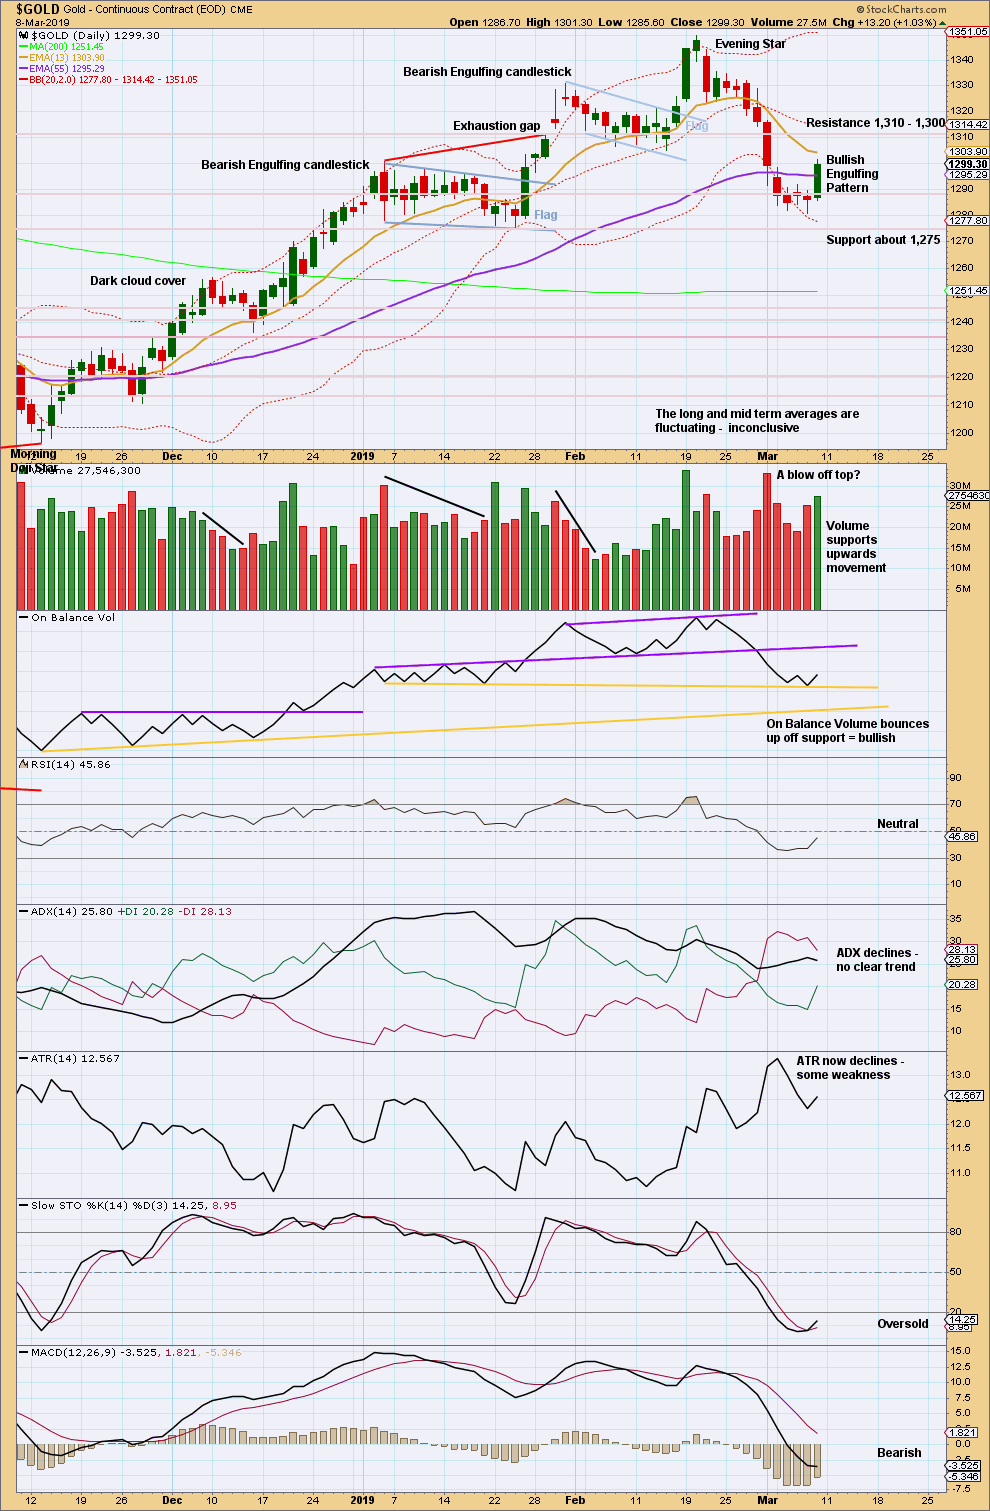
Click chart to enlarge. Chart courtesy of StockCharts.com.
There has been a shorter lived downwards trend at the daily chart level. That trend may now be considered over with a strong bullish candlestick reversal pattern that has support from volume and a bullish signal from On Balance Volume.
Look for a test of resistance about 1,300 to 1,310.
GDX WEEKLY CHART
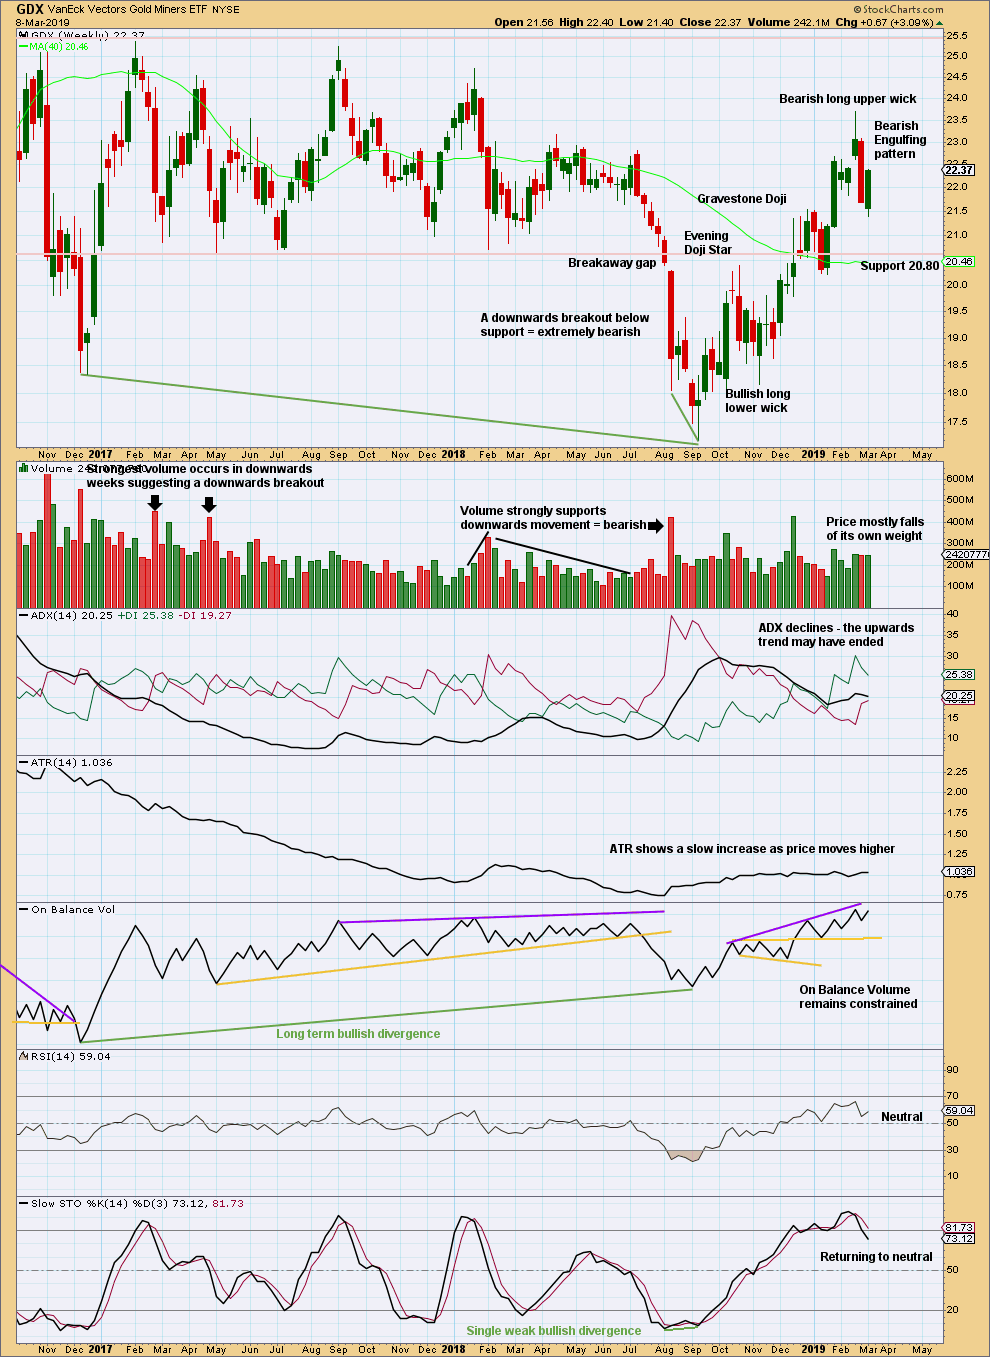
Click chart to enlarge. Chart courtesy of StockCharts.com.
The Bearish Engulfing pattern at the weekly chart level should still be given weight in this analysis. It signals an end to the upwards trend and a new downwards or sideways trend.
GDX DAILY CHART
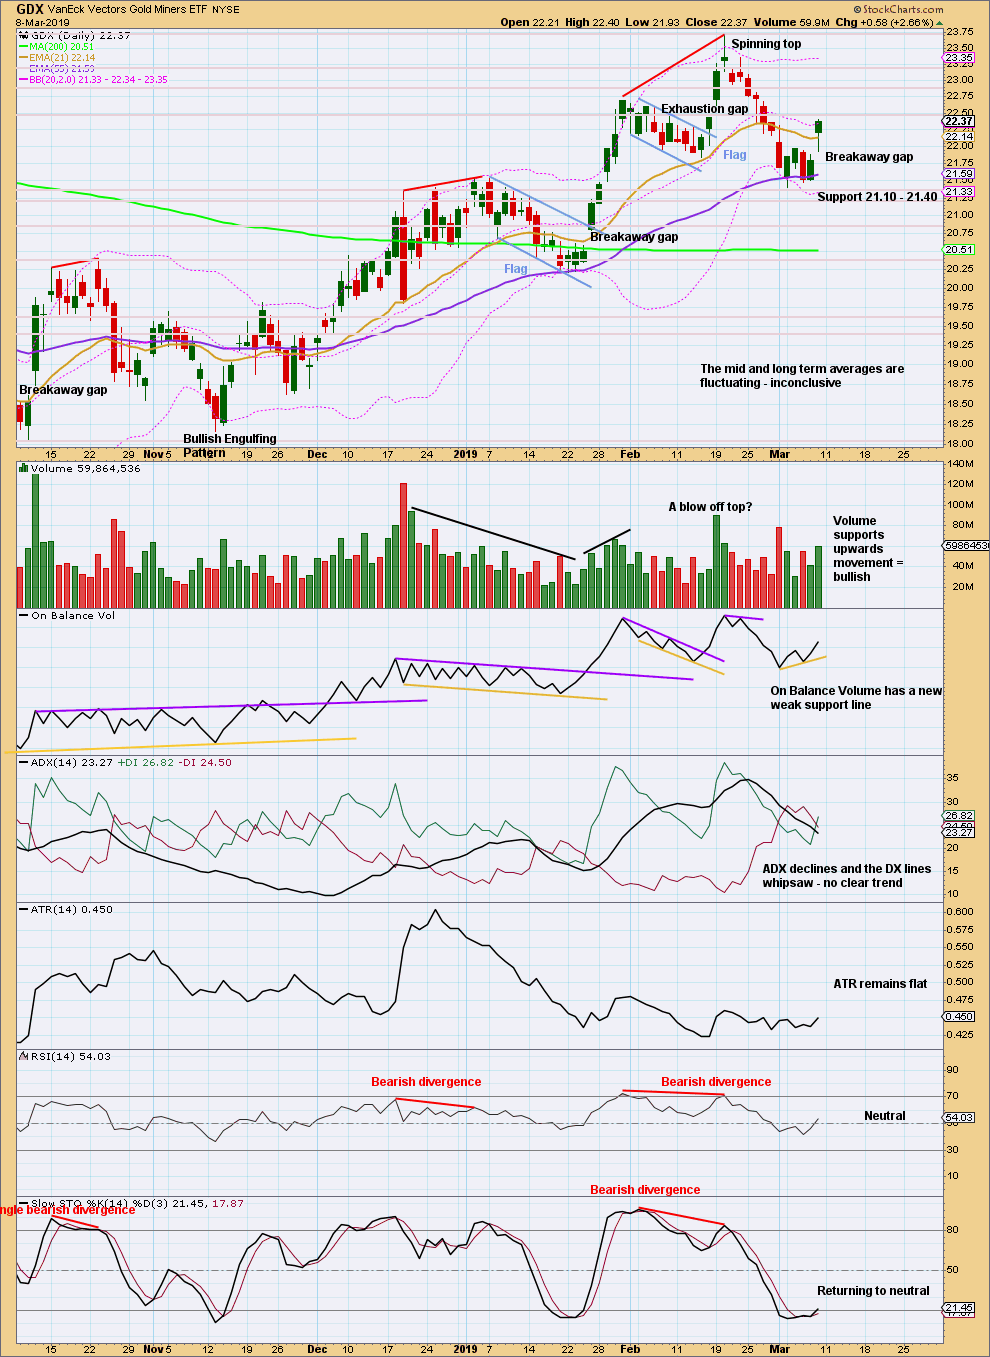
Click chart to enlarge. Chart courtesy of StockCharts.com.
Friday saw an upwards breakout from a small consolidation that has support from volume and a breakaway gap. Look now for support at the breakaway gap at 21.89 and resistance above about 22.50 and then 22.90.
The long lower wick and close near the high for the session indicate more upwards movement as fairly likely on Monday.
US OIL
Price this week remains range bound. Two Elliott wave counts are again used to identify targets after a breakout.
Summary: The larger picture still sees Oil in a new downwards trend to end reasonably below 26.06.
For the short term, a new high above 57.88 would indicate the bounce is not over. The target would be about 63.71.
For the short term, a close below support about 55 would indicate the bounce is over. Downwards movement may then be expected to end reasonably below 42.37.
MAIN ELLIOTT WAVE COUNT
MONTHLY CHART
Click chart to enlarge.
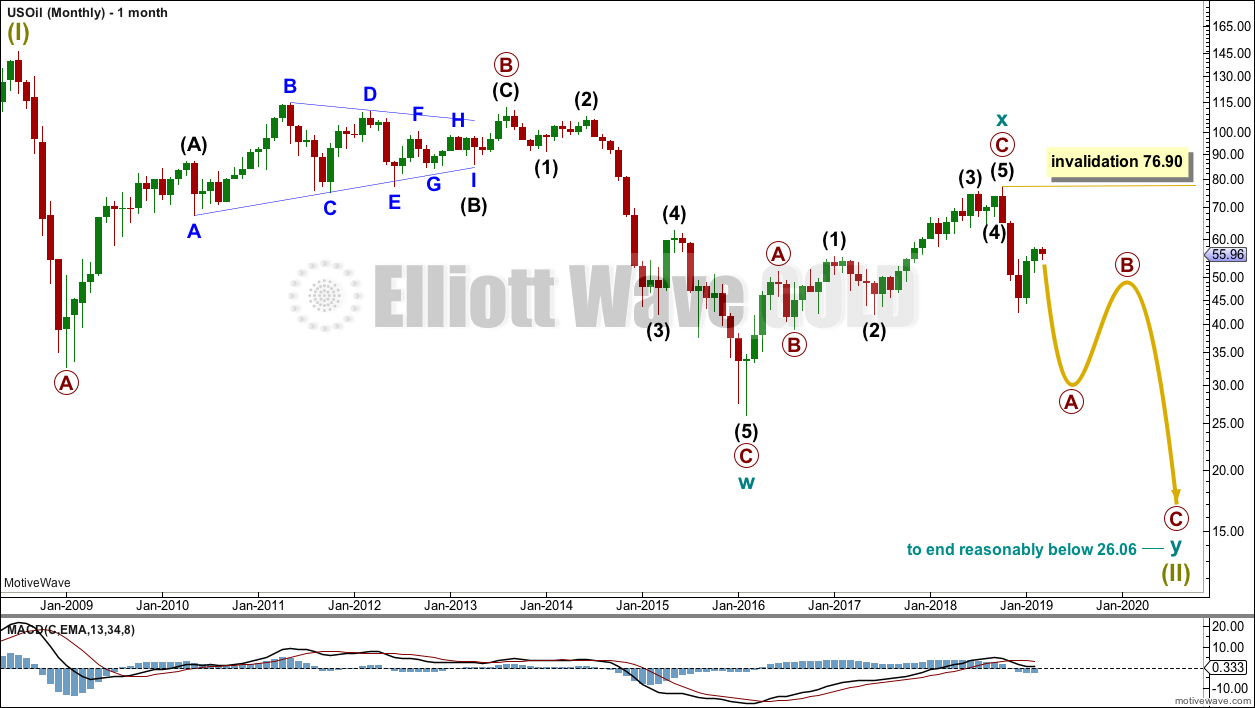
Classic technical analysis favours a bearish wave count for Oil at this time.
The large fall in price from the high in June 2008 to February 2016 is seen as a complete three wave structure. This large zigzag may have been only the first zigzag in a deeper double zigzag.
Upwards movement from February 2016 to October 2018 will not fit readily as a five wave structure but will fit very well as a three. With a three wave structure upwards, this indicates the bear market may not be over.
The first zigzag down is labelled cycle wave w. The double is joined by a now complete three in the opposite direction, a zigzag labelled cycle wave x.
The purpose of a second zigzag in a double is to deepen the correction when the first zigzag does not move price deep enough. Cycle wave y would be expected to move reasonably below the end of cycle wave w to deepen the correction. Were cycle wave y to reach equality with cycle wave w that takes Oil into negative price territory, which is not possible. Cycle wave y would reach 0.618 the length of cycle wave w at $2.33.
A better target calculation would be using the Fibonacci ratios between primary waves A and C within cycle wave y. This cannot be done until both primary waves A and B are complete.
Within cycle wave y, no second wave correction nor B wave may move beyond its start above 76.90.
WEEKLY CHART
Click chart to enlarge.
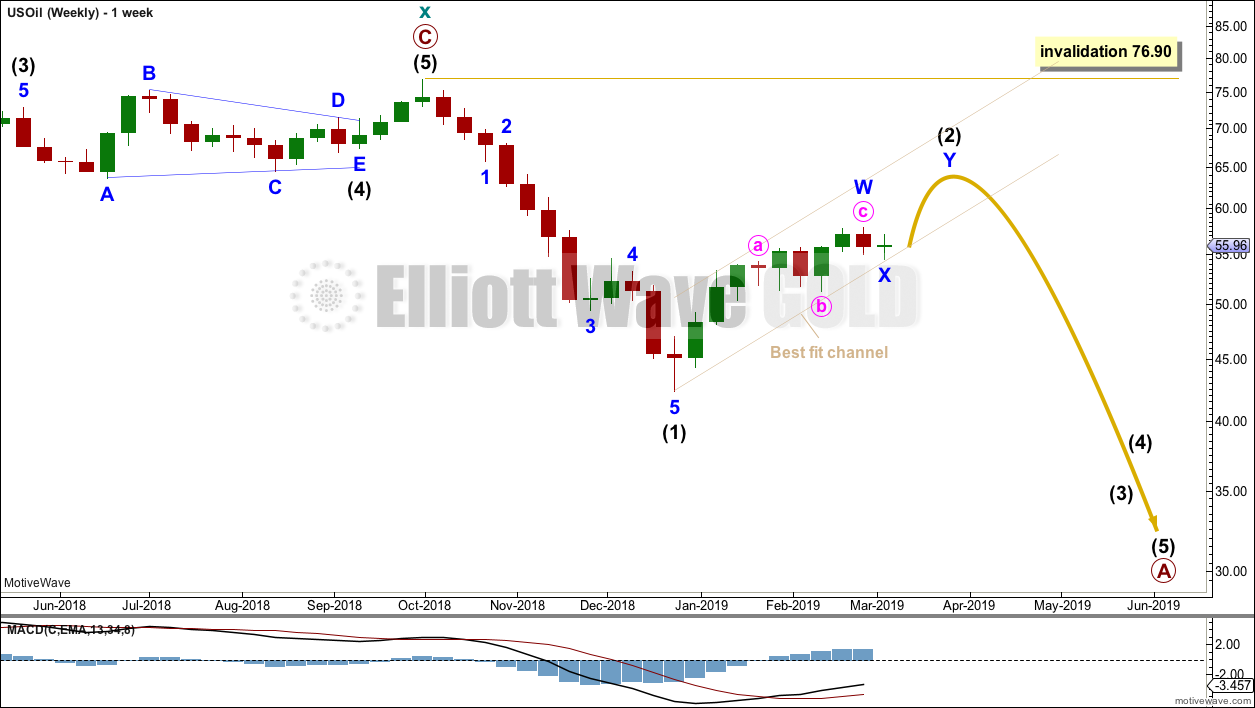
This weekly chart is focussed on the start of cycle wave y.
Cycle wave y is expected to subdivide as a zigzag. A zigzag subdivides 5-3-5. Primary wave A must subdivide as a five wave structure if this wave count is correct.
Within primary wave A, intermediate wave (1) may now be complete.
Intermediate wave (2) is this week relabelled as a possibly incomplete double zigzag. It is again also possible that it may have been over at last week’s high. Two daily charts are published below for both ideas.
Intermediate wave (2) may not move beyond the start of intermediate wave (1) above 76.90.
DAILY CHART
Click chart to enlarge.
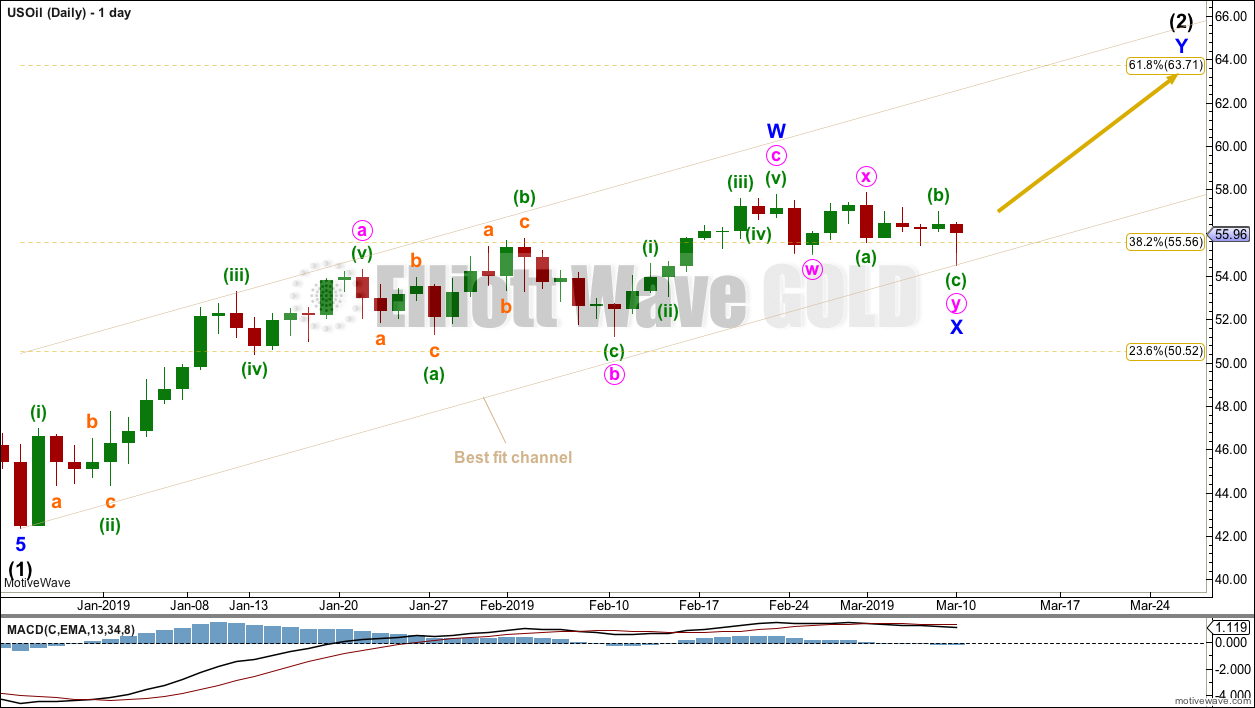
This is the main wave count, only because we should always assume the trend remains the same until proven otherwise.
Intermediate wave (2) may be an incomplete double zigzag. The first zigzag may be complete, labelled minor wave W. The double may be joined by a three in the opposite direction, a double zigzag labelled minor wave X.
The maximum number of corrective structures in a multiple is three. Waves W, Y and Z may only subdivide as single corrective structures (they may not be multiples). But X waves may subdivide as any corrective structure including a multiple. However, X waves almost always subdivide as single zigzags, rarely do they subdivide as multiples. The structure of minor wave X for this wave count must be judged to reduce its probability.
The channel is redrawn this week as a best fit. If this channel is breached by a full candlestick below and not touching it, that may indicate a trend change.
Minor wave Y may end about the 0.618 Fibonacci ratio at 63.71.
Intermediate wave (2) may not move beyond the start of intermediate wave (1) above 76.90.
ALTERNATE DAILY CHART
Click chart to enlarge.
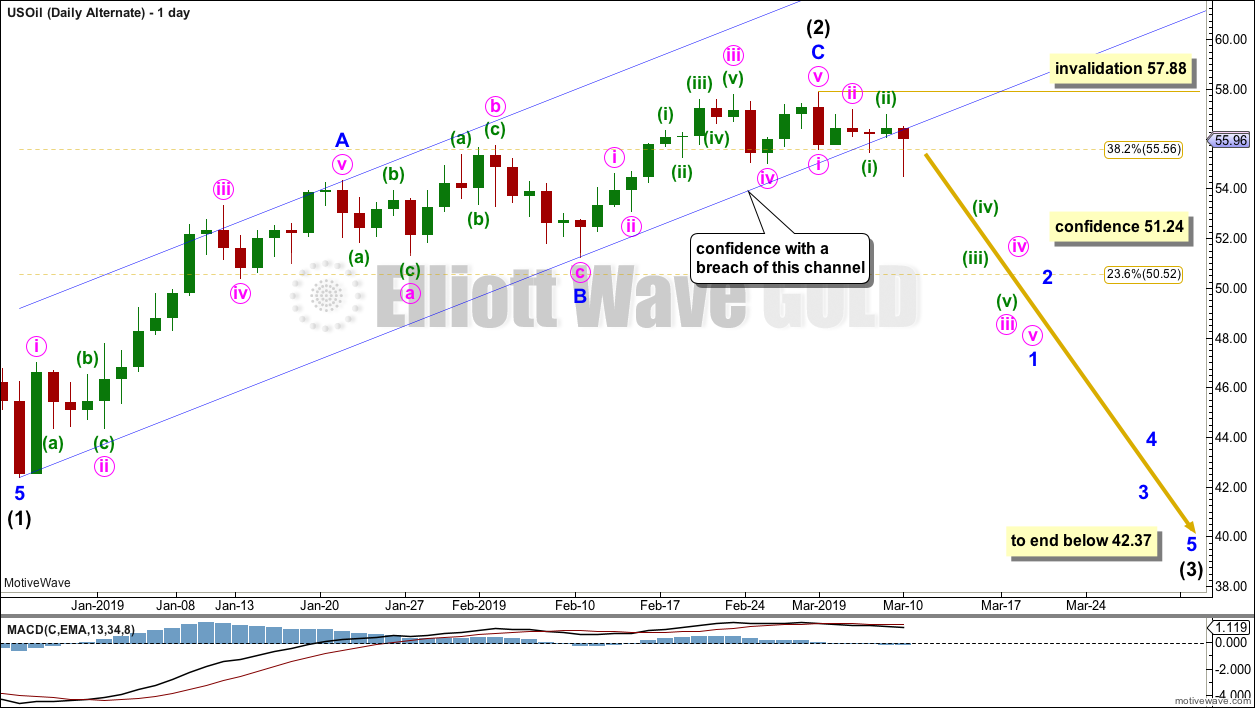
It is possible that intermediate wave (2) may be a complete zigzag, ending close to the 0.382 Fibonacci ratio of intermediate wave (1). Confidence in this wave count may be had with a breach of the blue Elliott channel. At the end of this week, Friday’s candlestick is not fully below the channel; the channel is overshot but not properly breached.
Intermediate wave (3) must move beyond the end of intermediate wave (1). Intermediate wave (3) must move far enough below the end of intermediate wave (1) to allow room for intermediate wave (4) to unfold and remain below intermediate wave (1) price territory.
Within intermediate wave (3), no second wave correction may move beyond the start of its first wave above 57.88.
TECHNICAL ANALYSIS
MONTHLY CHART
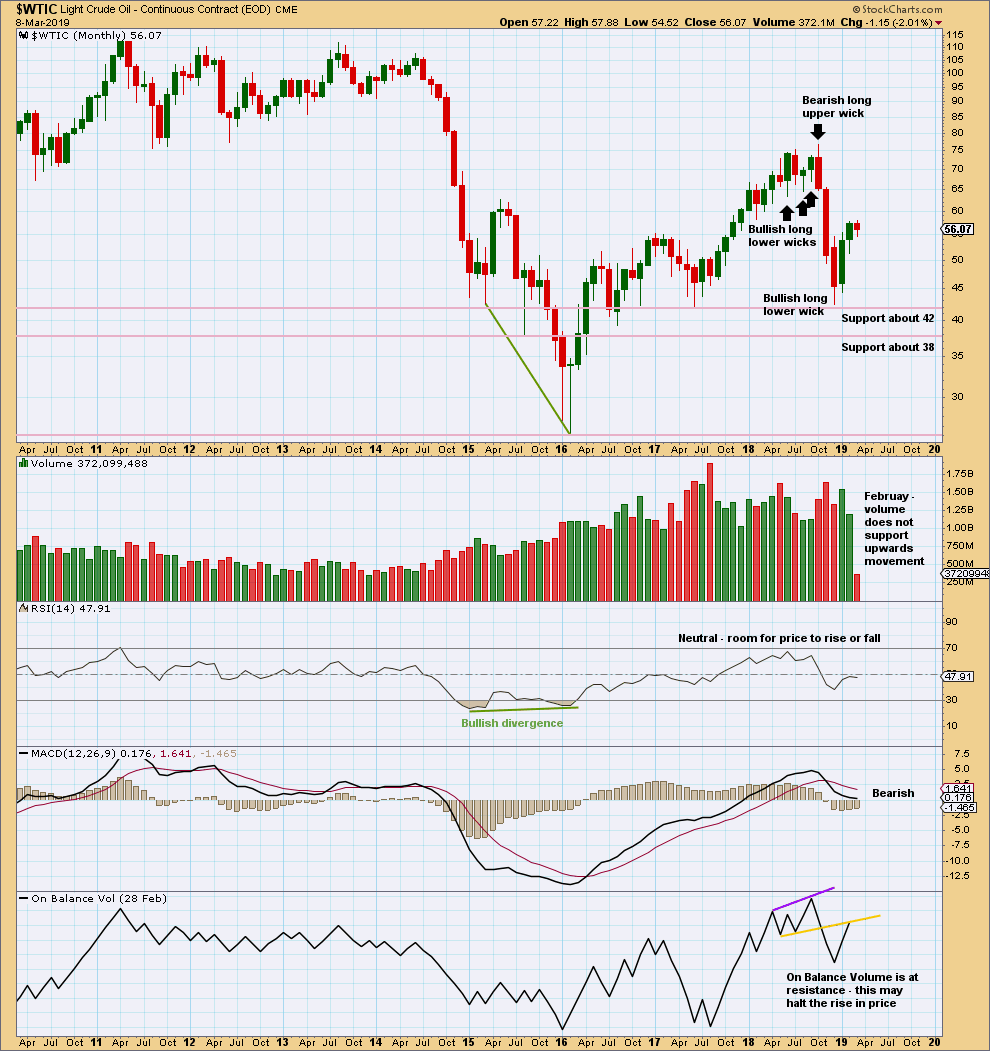
Click chart to enlarge. Chart courtesy of StockCharts.com.
Upwards movement for February lacks support from volume. This bounce may be ending here or very soon.
WEEKLY CHART
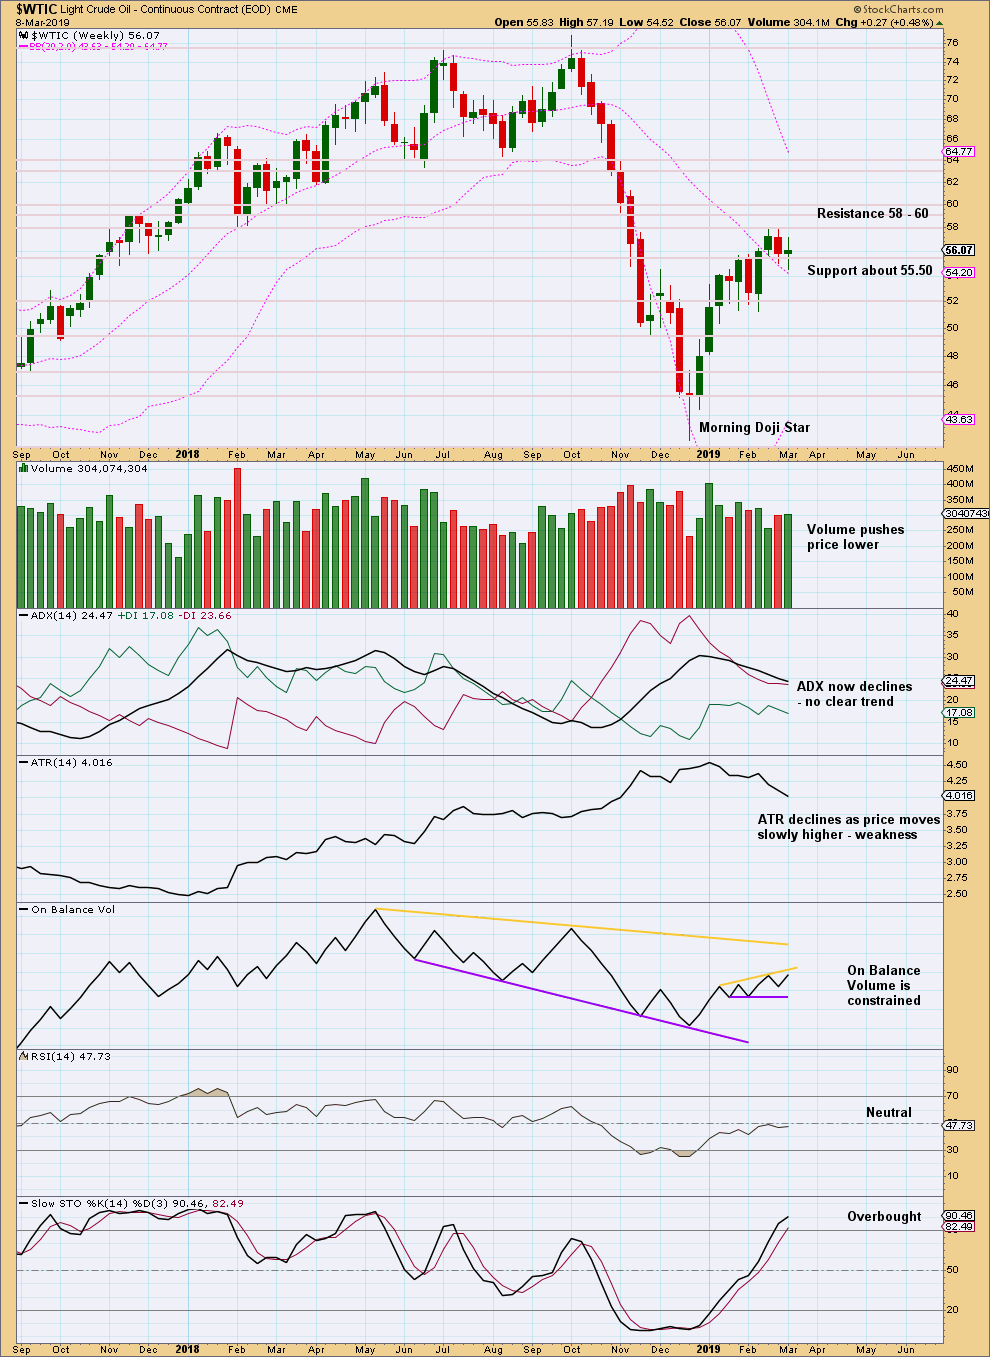
Click chart to enlarge. Chart courtesy of StockCharts.com.
This week price moved lower with a lower low and a lower high. The balance of volume however was upwards and the candlestick closed green. It would be best to look inside the week at daily volume bars for a clearer indication of the short-term volume profile.
The spinning top candlestick this week puts the trend into neutral.
Price has reached resistance and Stochastics is overbought. Look for an end to the bounce here or very soon.
DAILY CHART
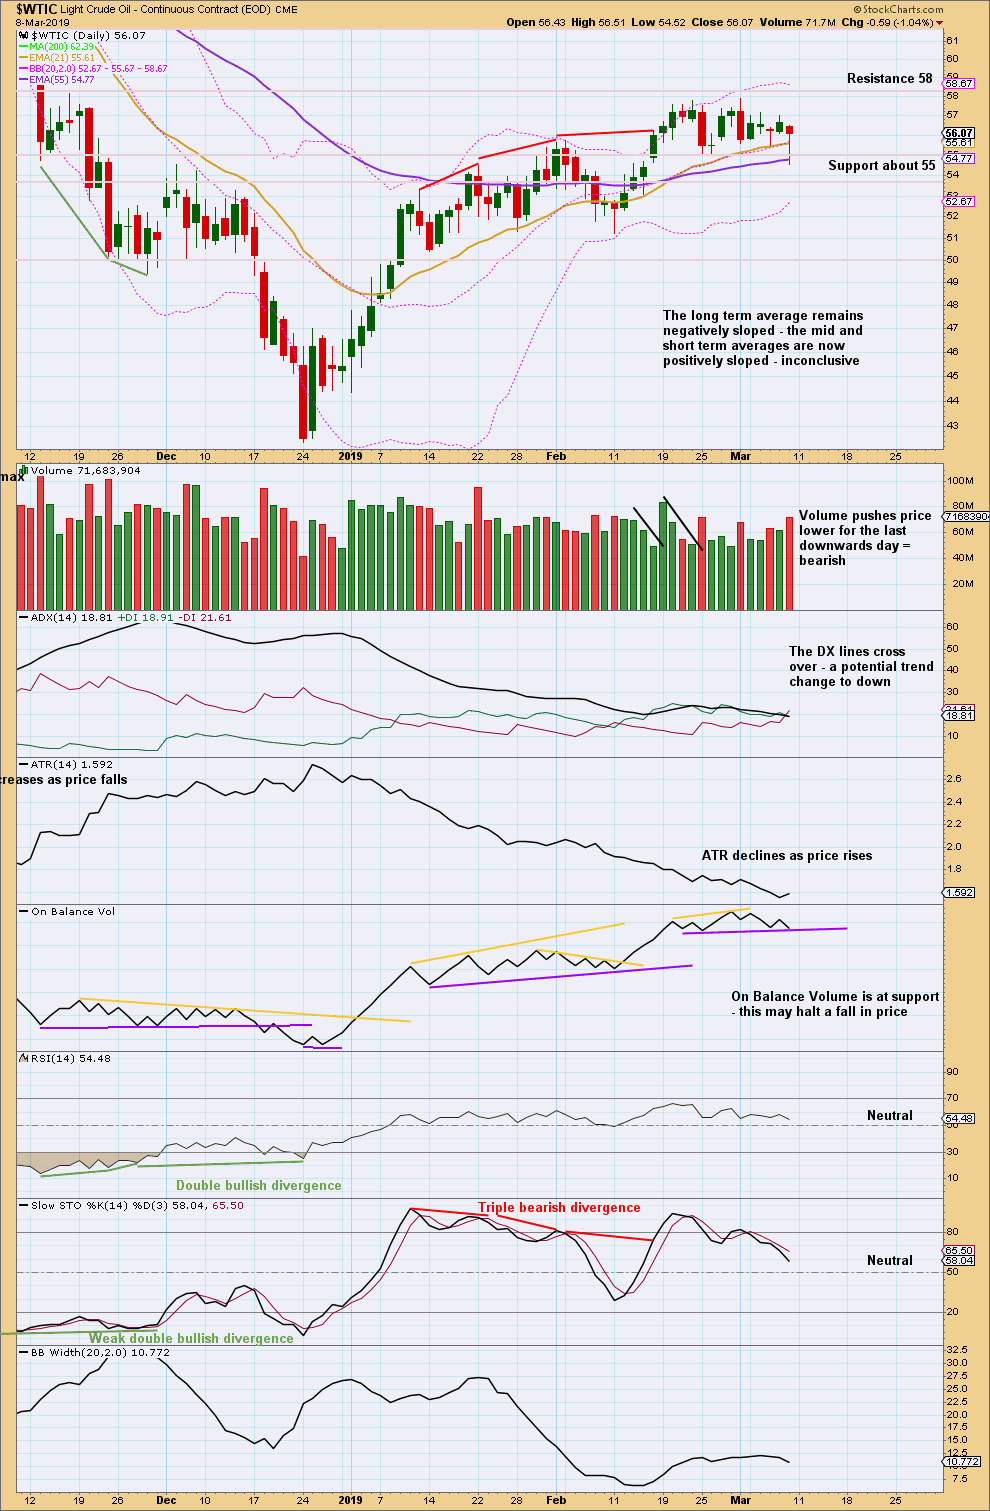
Click chart to enlarge. Chart courtesy of StockCharts.com.
The short-term volume profile remains bearish, but price remains above support. The long lower wick for Friday is bullish.
Price is range bound with resistance about 58 and support about 55. A close above resistance would require support from volume for confidence. If that happens, then look for next resistance about 63.5 – 64.
A close below support about 55 does not require support from volume for confidence. If that happens, then look for next support about 52 in the first instance.
If On Balance Volume breaks out prior to price, then it may indicate the breakout direction for price.
—
Always practice good risk management as the most important aspect of trading. Always trade with stops and invest only 1-5% of equity on any one trade. Failure to manage risk is the most common mistake new traders make.
Gold appears to have found its high. Look out now for a third wave down folks.
Two new daily wave counts for the S&P500:
With now a large number of pullbacks and consolidations within the upwards wave from December lows, there are multiple ways to label this wave.
This is the preferred count today, it has support from classic TA. Inverted VIX today makes a new high with price, the AD line falls short but only by the very smallest of margins and price did not close on a new high. Volume supported upwards movement today.
It’s possible again that primary wave 1 is incomplete.
It’s also possible that when primary wave 2 arrives it may not be very deep nor time consuming. It could be shallow.
Alternate daily chart:
It’s also possible that primary wave 2 is underway as a double flat, double combination or single flat.
If it’s a multiple then intermediate (Y) may end about the same level as intermediate (W) at 2,722.
If it’s an expanded flat then intermediate (C) would = 1.618 the length of intermediate (A) at 2,674.
At the new high today there is bearish divergence between price and On Balance Volume and RSI. That offers a little support to this alternate wave count.
But, bearish divergence can sometimes appear, then disappear. It does not always work as a signal of a trend change.
Hi Lara,
Oil appears to be confirming the ST bullish scenario with today’s move – can we get an updated daily chart?
We might have to see a close above 57.88 to confirm the bullish scenario.
No, not necessary. The alternate US Oil count is invalidated by a new high by any amount at any time frame above 57.88.
The Elliott wave rule applied is black and white. No part of minute wave ii may move beyond the start of minute wave i.
The alternate US Oil count is invalidated today.
This is the main daily chart for US Oil. It’s unchanged.
A little confidence may be had now that the alternate daily chart is invalidated.
Hi Lara,
Great work as usual.
Here are my thoughts…
For the S&P 500, I had a hard time believing a primary correction at these levels since the AD line was so strong…. Now that the AD line made a new all time high this morning, I am now in “your alternate monthly wave count” camp… I do not think that the 3045-3477 target will hold considering how strong the S&P 500 is…
I think we are too bearish…
Cheers,
Mathieu
Your concerns are addressed in new charts above.
Thanks… appreciate it.
Hi Lara,
Do you have an updated daily chart for S&P with the latest move?
Also, I have a copy of your Bitcoin channel on my tradingview account and my phone went nuts yesterday with all the notifications for the bitcoin price crossing the upper edge of the channel. Do you have an updated view on BItcoin? There’s a been a few strong up days on the cryptos over the last week while S&P has been swinging.
Thanks in advance,
Jiten
Hi Laura, I would also be interested in any thoughts you had on BitCoin & Gold. Gold HOD so far is 1311 and several mining stocks are surging to new highs (e.g. MAG, OR, etc).
I’m now seeing Gold at very strong resistance with today a lack of support from volume. The upwards bounce now looks like a nice three on the daily chart.
I’m looking for an end to this bounce here or very soon for Gold.
Lets see what tomorrow brings.
I’m looking at Bitcoin data… and I’m just not seeing anything to be excited about. It’s range bound, essentially moving sideways.
I’ll update it anyway.